111 Channelview Drive Dr · Ripley, MS
Flood risk 1/10 · Minimal
- FEMA flood zone
- X (unshaded)
- Chance of flooding over 30 yrs
- 0.0%
- Est. flood insurance / yr
- $507 – $1,088
Fire risk 5/10 · Moderate
- Est. fire insurance / yr
- $1,241 – $2,305
Heat risk 6/10 · Moderate
- Hot days now (above 108°F)
- 7 days/yr
- Hot days in 30 yrs
- 20 days/yr
Wind risk 5/10 · Moderate
- Chance of severe wind over 30 yrs
- 26.0%
Air-quality risk 1/10 · Minimal
- Unhealthy air days now
- 0 days/yr
- Unhealthy air days in 30 yrs
- 0 days/yr
Risk factors via First Street. Map © Google.
Why this score? — see what drove the D grade
The composite is a weighted blend of 9 inputs, each scored 0–100. Each bar is that input's sub-score; the figure is the points it added to the 100-point composite (weight × sub-score).
- Cash flow +14.8/30.0
- ARV discount +5.7/15.0
- DSCR +4.5/10.0
- 1% rule +4.1/10.0
- Schools +3.3/10.0
- Livability +3.2/5.0
- Rent growth +2.5/5.0
- Condition / age +2.2/5.0
- Appreciation +0.0/10.0
$92,000
🖨 Deal sheet 📄 Offer letter ✓ Due diligence
Listing remarks MLS
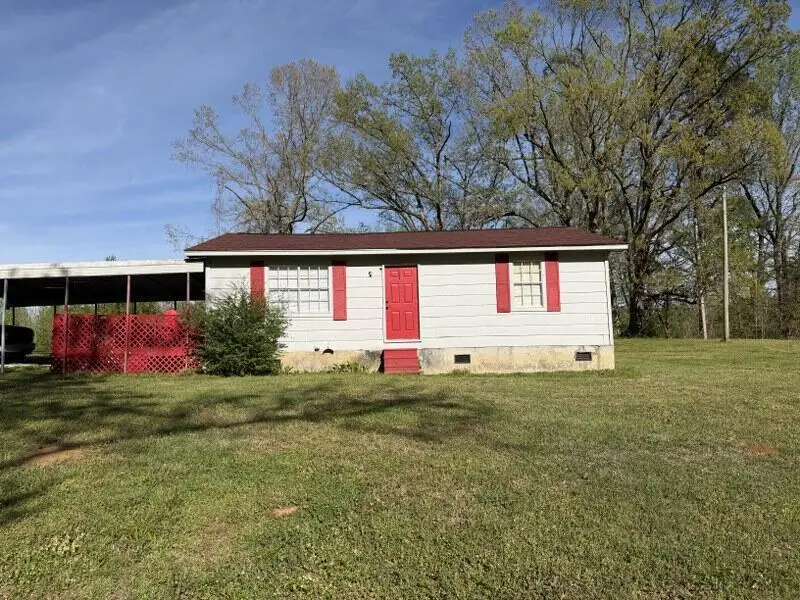
Situated on a half acre lot just minutes from downtown Ripley, this recently updated 2 bedroom, 1 bath home offers 840 sq ft of comfortable living space. A great option for a first time home buyer or someone looking to add to their investment portfolio. All information subject to verification. All info subject to verification.
Key facts
- Built 1991
- Listed 49 days
Neighborhood map
What this means for you Summary
Snapshot
- This is a 2-bed/1.0-bath single-family listed at $92k. Condition is rated fair.
Deal economics
- At list price, monthly cash flow is $25 ($298/yr) — positive.
- The deal already cash-flows at list — no discount required.
- To meet the 1% rule (rent ≥ 1% of price), the offer needs to be $84k (9.1% below list).
- Recommended offer: $84k (9.1% below list) — sets the bar for 1% rule.
Location & tenants
- Location reads 64/100 on livability (#129 in MS) — a middle-class / working-renter tenant base. Strengths: cost of living A+, housing A+, crime A; Watch: schools D-, amenities F, commute F.
- South Tippah School District (town): math 43% / reading 36% proficiency, ranked #42 of 130 in MS (top 32%) — families likely to look elsewhere, expect single-tenant / working-renter base with shorter leases; 61% free/reduced lunch — lower-income household profile, screen leases tightly.
- Market conditions: 51 active listings in the ZIP; 10 units permitted in Tippah County in 2024 (0 in 5+ unit buildings).
Forward outlook
- Local home prices are declining (-3.0%/yr); year-one equity from $636 of loan paydown is wiped out by about $3k of value loss. Plan a longer hold.
- Tippah County population projected to shrink 9% by 2050 — rents likely to lag national; underwrite the cash flow, not the appreciation.
Negotiation context
- It's been on market 49 days — a 3% lower offer ($89k) is reasonable based on typical stale-listing flexibility.
- 2 sale attempts with the ask held roughly flat each time — persistent listings suggest the price (not the market) is what's stuck; bring a comps-based counter.
Risks & watch-outs
- Climate carrying-cost: moderate wind risk, 26% chance of damaging wind over 30y; moderate wildfire risk; extreme-heat days projected 7→20/yr by 2055 (HVAC capex compounding) — expect insurance premiums to compound above CPI over the hold.
Questions for the listing agent
- It's been on market 49 days. Have you received any prior offers? Is the seller open to a 9% concession, seller financing, or rate buy-down credit?
- Have any recent inspections been done? Can we get a copy of the seller's disclosures and any deferred-maintenance estimates?
- Is there a deadline driving the sale (1031 exchange, divorce, estate, relocation)? That informs how much negotiation room exists.
- Schools are D-rated, which usually means shorter tenancies and higher turnover. Who's the typical renter profile here, and what's been the actual vacancy rate?
- The area grade is low — what's the realistic commute time and amenity access for the typical tenant pool here? Any planned neighborhood developments (good or bad) we should know about?
- What's the average days-on-market for RENTAL listings here right now (not sales)? A rising rental-DOM trend means longer vacancies and softer asking-rent achievability than the comps imply.
- What's the recent tenant-quality profile in this submarket — average credit score on applications, eviction rate, late-payment / NSF rate, and stable-employment percentage? A property-management company in the area should have these aggregated.
- How much new for-sale + rental construction is in the pipeline within 1–3 miles? Heavy new supply typically softens prices + rents 12–24 months out; constrained supply supports both.
Investment metrics
- 1% rule
- 0.91% ✗
- Cap rate
- 6.62%
- Cash-on-cash
- 1.16%
- DSCR
- 1.05
- GRM
- 9.2
CMA / ARV
- ARV (median comp)
- $88,518
- List price
- $92,000
- Delta
- 3.93%
- Verdict
- FAIR
- Comps
- 1 within 2.0 mi
Projected returns pro-forma
-3.0% appreciation · 3.0% rent growth · sell at horizon
- IRR
- -14.4%
- Equity multiple
- 0.48×
- Total profit
- $-13,316
- Equity at exit
- $13,717
- IRR
- -5.7%
- Equity multiple
- 0.63×
- Total profit
- $-9,510
- Equity at exit
- $7,954
Cash invested: $25,760 (down + closing). Projections, not guarantees.
Landlord ↔ Tenant lean methodology
- Overall (STATE)
- 90 Strongly Landlord-Friendly
- State Mississippi
- 90 Strongly Landlord-Friendly · R+11
- County
- — inherits STATE
- City
- — inherits STATE
ZIP-level market 38663
- Home prices YoY
- -32.2%
- Active inventory
- 51
- Price-to-rent
- 9.2×
Monthly cashflow live
- Estimated rent
- $836 medium interval (Pro) →
- Mortgage (P&I)
- −$482
- Tax est. 1.5%
- −$115 /mo · $1,380/yr
- Insurance
- −$38
- HOA
- −$0
- Vacancy / Maint / Mgmt
- −$176
- Net cashflow
- $25
Break-even live
UW: 25.0% down · 7.5% · 30yr · 1.5% tax · 5.0% vac · 8.0% maint · 8.0% mgmt
Financing live
Cash to close
- Down payment
- $23,000
- Closing costs
- $2,760
- Reserves months
- —
- Total cash needed
- —
Loan-product check · same deal, 3 products live
Conventional
25% down · 7.5% · 30yr
- Down + closing
- —
- Monthly P&I
- —
- Monthly cashflow
- —
- DSCR
- —
- Eligible?
- —
Personal DTI + credit; lowest rate.
DSCR
20% down · 8.5% · 30yr
- Down + closing
- —
- Monthly P&I
- —
- Monthly cashflow
- —
- DSCR
- —
- Eligible?
- —
No personal income docs; deal must DSCR.
Hard money
10% down · 12.0% · 12mo
- Down + closing
- —
- Monthly P&I
- —
- Monthly cashflow
- —
- DSCR
- —
- Eligible?
- —
Short-term bridge; refi at stabilization.
Listing history 16 events
-
2026-06-18days on market $92,000 Active 49 DOM
-
2026-06-17days on market $92,000 Active 48 DOM
-
2026-06-16days on market $92,000 Active 47 DOM
-
2026-06-15days on market $92,000 Active 46 DOM
-
2026-06-13days on market $92,000 Active 44 DOM
-
2026-06-12days on market $92,000 Active 43 DOM
-
2026-06-09days on market $92,000 Active 40 DOM
-
2026-06-08days on market $92,000 Active 39 DOM
-
2026-06-07days on market $92,000 Active 38 DOM
-
2026-06-07days on market $92,000 Active 37 DOM
-
2026-06-04days on market $92,000 Active 34 DOM
-
2026-06-02days on market $92,000 Active 33 DOM
-
2026-06-01days on market $92,000 Active 32 DOM
-
2026-05-31days on market $92,000 Active 31 DOM
-
2026-05-14status Active 328-char remark
Show marketing remark (328 chars)
Situated on a half acre lot just minutes from downtown Ripley, this recently updated 2 bedroom, 1 bath home offers 840 sq ft of comfortable living space. A great option for a first time home buyer or someone looking to add to their investment portfolio. All information subject to verification. All info subject to verification.
-
2026-04-08$92,000 Active 328-char remark
Show marketing remark (328 chars)
Situated on a half acre lot just minutes from downtown Ripley, this recently updated 2 bedroom, 1 bath home offers 840 sq ft of comfortable living space. A great option for a first time home buyer or someone looking to add to their investment portfolio. All information subject to verification. All info subject to verification.
ⓘ Source: listings_history table (triggers on properties + properties_extension) + one-shot
backfill from property_details.listing_events for pre-trigger history.
Climate risk First Street
- Flood 1/10 Low FEMA zone X (unshaded) · 0% chance over 30 yrs
- Wildfire 5/10 Major
- Heat 6/10 Major 7 d/yr ≥108°F today · 20 d/yr by 30 yrs out
- Wind 5/10 Major 26% chance of damaging wind over 30 yrs
- Air quality 1/10 Low 0 unhealthy d/yr today · 0 by 30 yrs out
Nearby sold comps map
Loading sold comps map…
Walkable amenities ~0.75 mi
Loading nearby amenities…
Taxation est. · year 1
- Rental income
- $10,034
- − Mortgage interest
- −$5,153
- − Property taxes
- −$1,380
- − Insurance
- −$460
- − Repairs & maintenance
- −$803
- − Management
- −$803
- − Depreciation
- −$2,676
- Taxable loss
- −$1,241
- Est. tax savings @ 24.0%
- +$298
- After-tax cash flow
- $595/yr
For passive investors: Depreciation is non-cash, so a rental often shows a tax loss while cash-flowing — sheltering income. Rental losses are passive: they offset passive income freely, and up to $25,000/yr can offset ordinary (W-2) income if you actively participate and your MAGI is under $100k (phasing out to $0 by $150k); unused losses carry forward. On sale, claimed depreciation is recaptured at up to 25%, and gains may owe capital-gains tax (a 1031 exchange can defer both). Figures are a year-1 estimate at your 24.0% rate — not tax advice; consult a CPA.
Condition & rehab AI · 2 photos
This home requires significant repairs and maintenance, including a new roof, exterior painting, HVAC replacement, and landscaping improvements. These updates will significantly increase its resale and rental value.
Repairs flagged
- Major roof — Signs of wear and discoloration suggest significant damage.
- Major siding — Peeling paint and chipping paint indicate severe deterioration.
- Major flooring — Old and possibly damaged flooring requires replacement or repair.
- Major HVAC unit — Old and possibly in need of maintenance or replacement.
- Major interior walls — Signs of wear and discoloration suggest significant damage and need for repainting or repair.
- Major landscaping — Sparse and overgrown landscaping requires significant maintenance and landscaping improvements.
Value-add opportunities
- Resale roof replacement — A new roof will significantly improve the home's appearance and increase its value.
- Resale exterior painting and siding repair — Fresh paint and repairs to the siding will enhance the home's curb appeal and value.
- Both HVAC replacement — A new HVAC system will improve comfort and energy efficiency, benefiting both resale and rental value.
- Both landscaping and curb appeal improvements — A well-maintained and landscaped exterior will increase the home's curb appeal and rental value.
- Resale interior painting and repairs — Fresh paint and repairs to the interior walls will improve the home's appearance and resale value.
Renovation cost estimate screening
| Repair item | Severity | Est. cost |
|---|---|---|
| roof · Signs of wear and discoloration suggest significant damage. | Major | $15,000–50,000 |
| siding · Peeling paint and chipping paint indicate severe deterioration. | Major | $15,000–50,000 |
| flooring · Old and possibly damaged flooring requires replacement or repair. | Major | $15,000–50,000 |
| HVAC unit · Old and possibly in need of maintenance or replacement. | Major | $15,000–50,000 |
| interior walls · Signs of wear and discoloration suggest significant damage and need for repainting or repair. | Major | $15,000–50,000 |
| landscaping · Sparse and overgrown landscaping requires significant maintenance and landscaping improvements. | Major | $15,000–50,000 |
| Total estimated repair cost · 6 items | $90,000–300,000 |
Value-add ROI direction
- Resale roof replacement — A new roof will significantly improve the home's appearance and increase its value. ↑
- Resale exterior painting and siding repair — Fresh paint and repairs to the siding will enhance the home's curb appeal and value. ↑
- Both HVAC replacement — A new HVAC system will improve comfort and energy efficiency, benefiting both resale and rental value. ↑
- Both landscaping and curb appeal improvements — A well-maintained and landscaped exterior will increase the home's curb appeal and rental value. ↑
- Resale interior painting and repairs — Fresh paint and repairs to the interior walls will improve the home's appearance and resale value. ↑
ⓘ Cost ranges are severity-bucket heuristics (US national rule-of-thumb). Get contractor quotes + a written scope before underwriting a rehab budget.
Schools (NCES district)
- District
- South Tippah School District
- NCES district ID
- 2804110
- Math proficiency
- 43% ▼ -9.00%
- Reading proficiency
- 36% ▼ -4.00%
- Median HH income
- $36,577
- Composite
- 32.83/100
- National rank
- #5618
- State rank
- #42 of 130 in MS
Livability — Ripley
- Score
- 64/100
- State rank
- #129
- US rank
- #14136
Category grades
Schools grade is shown separately in the Schools card above.
Census & demographics
- Census place
- Ripley, MS
- Population (ZIP)
- 11,468
Population outlook (Tippah County) Hauer SSP2
- Today (2025)
- 21,864 people
- By 2030
- 21,575 · -1.3%
- By 2040
- 20,850 · -4.6%
- By 2050
- 19,953 · -8.7%
- By 2075
- 17,257 · -21.1%
- By 2100
- 13,705 · -37.3%
Race, ethnicity, and origin ACS 2023
- Neighborhood character
- Predominantly White (75%)
- Race & ethnicity
- White 75% Black 13% Two or more races 9% Hispanic / Latino 7%
- Hispanic origin (detail)
- Mexican 5%
- Common ancestry
- Slovak 2% Serbian 1% Lithuanian 1%
- Foreign-born
- 3% · Canada
- Languages at home
- 94% English-only · Spanish 5%
Political lean MEDSL · Tippah
- 2024 margin
- Solid R (+67.1) · D 16.1% · R 83.2%
- 2008→2024 swing
- -22.8pp toward R · 2008: -44.4pp · 2024: -67.1pp
- All cycles
- 2024: R+67.1 2020: R+60.6 2016: R+58.8 2012: R+48.5 2008: R+44.4
Not yet ingested
- Civics
- —
Market trends
- HPI YoY
- ▼ -61.59%
- Current HPI
- 129.4524
- Rent YoY
- —
- Metro
- —
- State GDP YoY
- —
- F500 in state
- 0
Price history
2 events — show timeline
- 2026-05-14 Relisted — NEMSBD
- 2026-04-08 Listed $92,000 NEMSBD
Cash-flow waterfall
monthlySold comps — $/sqft
last 12 mo · ≤1 miLoading sold comps…