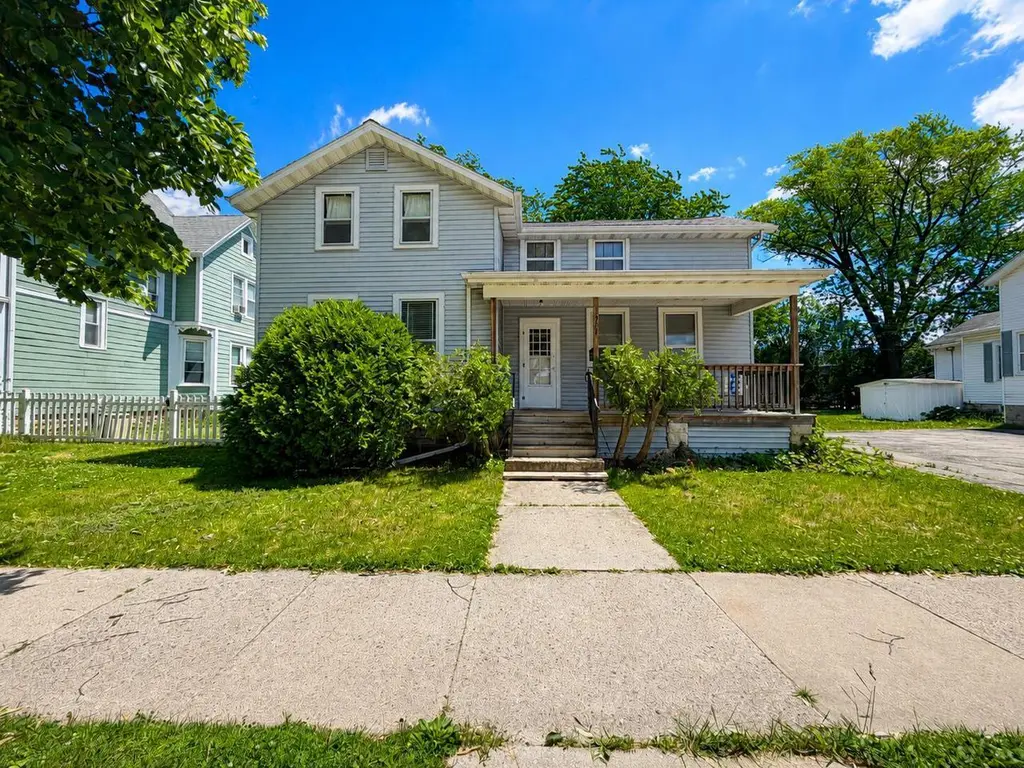
369 Linden St · Fond du Lac, WI
Flood risk 1/10 · Minimal
- FEMA flood zone
- X (unshaded)
- Chance of flooding over 30 yrs
- 0.0%
- Est. flood insurance / yr
- $473 – $860
Fire risk 1/10 · Minimal
- Est. fire insurance / yr
- $636 – $1,182
Heat risk 2/10 · Minimal
- Hot days now (above 98°F)
- 7 days/yr
- Hot days in 30 yrs
- 13 days/yr
Wind risk 2/10 · Minimal
- Chance of severe wind over 30 yrs
- —
Air-quality risk 2/10 · Minimal
- Unhealthy air days now
- 1 days/yr
- Unhealthy air days in 30 yrs
- 2 days/yr
Risk factors via First Street. Map © Google.
Why this score? — see what drove the C grade
The composite is a weighted blend of 9 inputs, each scored 0–100. Each bar is that input's sub-score; the figure is the points it added to the 100-point composite (weight × sub-score).
- Cash flow +22.7/30.0
- ARV discount +7.5/15.0
- DSCR +7.3/10.0
- 1% rule +6.2/10.0
- Rent growth +5.0/5.0
- Livability +3.7/5.0
- Schools +2.8/10.0
- Condition / age +2.5/5.0
- Appreciation +0.0/10.0
$135,000
🖨 Deal sheet 📄 Offer letter ✓ Due diligence
Listing remarks
Good Bones with Tons of Upside! Southside Spacious 2 Story Home in the same family for the last 60+ years. 3+ Bedroom/1.5 Bath home with both a main floor Living Room and Family Room, Eat-in Kitchen, Dining Room and Additional Living Spaces. Upstairs are 3 Conventional Bedrooms plus an additional Den/Office and Full Bath. Upstairs Rooms are irregular sized. Main Roof Updated 16 years ago, Maintenance Free Siding. Water Heater & Plumbing Need Some Attention. Property Sold As-Is. Seller will review Initial Offers on Friday 6/19/26 at 4 PM.
Key facts
- Den/office
- Family room
- Eat-in kitchen
Tags
Property features AI
Exterior
- Parking: 1 parking space
- Utilities: Municipal water; Municipal sewer
- Home design: Single-family, 2-story home; Information source for year built: Assessor/Public Record
- Construction: Less than 1/2 acre lot (approximately 0.16 acre); Zoned R2
- Exterior features: Aluminum and vinyl siding
Interior
- Kitchen: Kitchen on main level — 18 x 13
- Bedrooms: Master bedroom (Upper) — 14 x 12; Bedroom 2 (Upper) — 11 x 9; Bedroom 3 (Upper) — 11 x 8; Den/office (Upper) — 17 x 12
- Bathrooms: 1 full bathroom; 1 half bathroom
- Heating & cooling: Radiant / hot water heating; Natural gas fuel
- Interior features: Full basement with stone finish
- Laundry & utility: Washer and dryer included
Neighborhood map
What this means for you Summary
Snapshot
- This is a 3-bed/1.5-bath single-family listed at $135k.
Deal economics
- At list price, monthly cash flow is $232 ($3k/yr) — positive.
- The deal already cash-flows at list — no discount required.
- Meets the 1% rule at list price ($2k rent vs $135k).
- Cap rate 8.4% vs local median 2.6% in Fond du Lac — top-decile yield for the area; either an underpriced asset or a hidden risk that comps aren't pricing in. Stress-test before assuming the spread holds.
Location & tenants
- Location reads 74/100 on livability (#170 in WI, #4,627 nationally) — a middle-class / working-renter tenant base. Strengths: cost of living A+, housing A+, health & safety A+; Watch: employment C-, crime D, amenities F.
- Fond Du Lac School District (urban): math 34% / reading 31% proficiency, ranked #255 of 342 in WI (top 75%) — families likely to look elsewhere, expect single-tenant / working-renter base with shorter leases.
- Zoned schools: Fond Du Lac High (math 34% / reading 39%, grade F, #137 of 483 statewide, top 28%, 2,006 students, 41% FRL) — zoned schools at 41% FRL track the district average.
- Market conditions: Rents rising fast (+11.2%/yr); 155 active listings in the ZIP; 154 units permitted in Fond du Lac County in 2024 (0 in 5+ unit buildings).
Forward outlook
- Local home prices are declining (-3.0%/yr); year-one equity from $933 of loan paydown is wiped out by about $4k of value loss. Plan a longer hold.
- Fond du Lac County population projected to shrink 7% by 2050 — rents likely to lag national; underwrite the cash flow, not the appreciation.
- At projected returns (-3.0% appreciation + 8.0% rent growth), your $38k cash investment doubles in ~8 years — after that, you're playing with house money.
Negotiation context
- Only 6 days on market — expect competitive offers; lowballing is unlikely to land.
Risks & watch-outs
- Watch-outs: built in 1900 — expect roof / HVAC / electrical / plumbing capex.
Questions for the listing agent
- Built in 1900 — when were the roof, HVAC, electrical panel, plumbing, and water heater last replaced?
- Is there a deadline driving the sale (1031 exchange, divorce, estate, relocation)? That informs how much negotiation room exists.
- Crime grade is D in this area — have there been break-ins, vandalism, or insurance claims at this property in the last 3 years? What carrier currently insures it and at what premium?
- What's the average days-on-market for RENTAL listings here right now (not sales)? A rising rental-DOM trend means longer vacancies and softer asking-rent achievability than the comps imply.
- What's the recent tenant-quality profile in this submarket — average credit score on applications, eviction rate, late-payment / NSF rate, and stable-employment percentage? A property-management company in the area should have these aggregated.
- How much new for-sale + rental construction is in the pipeline within 1–3 miles? Heavy new supply typically softens prices + rents 12–24 months out; constrained supply supports both.
Investment metrics
- 1% rule
- 1.12% ✓
- Cap rate
- 8.36%
- Cash-on-cash
- 7.37%
- DSCR
- 1.33
- GRM
- 7.5
CMA / ARV
- ARV (on-the-fly)
- $284,734
- Comps found
- 12
Show comp detail 12 sales within ~0.75 mi
| Address | Dist | Beds/Ba | Sqft | Sold | Price | $/sf | Match |
|---|---|---|---|---|---|---|---|
| 153 15th St | 0.51mi | 3/2.0 | 2,237 (-0%) | 5mo | $270,000 | $121 | 70 |
| 171 Sheboygan St | 0.75mi | 3/1.0 | 2,202 (-2%) | 2mo | $322,500 | $146 | 58 |
| 285 4th St | 0.69mi | 3/1.5 | 2,137 (-5%) | 4mo | $210,000 | $98 | 57 |
| 106 S Park Ave | 0.66mi | 3/2.5 | 2,280 (+2%) | 8mo | $250,000 | $110 | 56 |
| 48 Woodland Ave | 0.54mi | 4/2.5 (+1) | 2,154 (-4%) | 5mo | $325,000 | $151 | 55 |
| 172 15th St | 0.55mi | 4/1.5 (+1) | 2,367 (+6%) | 6mo | $299,900 | $127 | 55 |
| 668 S Park Ave | 0.73mi | 4/2.0 (+1) | 2,309 (+3%) | 2mo | $255,000 | $110 | 52 |
| 176 15th St | 0.56mi | 4/2.5 (+1) | 2,396 (+7%) | 2mo | $355,000 | $148 | 52 |
| 558 S Park Ave | 0.57mi | 3/2.0 | 1,944 (-13%) | 1mo | $292,000 | $150 | 48 |
| 685 Grace Ave | 0.61mi | 3/3.0 | 2,448 (+9%) | 4mo | $337,500 | $138 | 47 |
| 253 4th St | 0.63mi | 3/1.5 | 1,905 (-15%) | 2mo | $205,000 | $108 | 44 |
| 227 4th St | 0.59mi | 4/2.0 (+1) | 1,984 (-12%) | 3mo | $218,000 | $110 | 44 |
Match score weights: distance 35% · size 25% · config 20% · recency 20%. Top-matched comps best support the ARV.
Projected returns pro-forma
-3.0% appreciation · 8.0% rent growth · sell at horizon
- IRR
- 0.6%
- Equity multiple
- 1.02×
- Total profit
- $910
- Equity at exit
- $20,129
- IRR
- 14.9%
- Equity multiple
- 2.49×
- Total profit
- $56,252
- Equity at exit
- $11,672
Cash invested: $37,800 (down + closing). Projections, not guarantees.
Landlord ↔ Tenant lean methodology
- Overall (STATE)
- 73 Landlord-Friendly
- State Wisconsin
- 73 Landlord-Friendly · R+2
- County
- — inherits STATE
- City
- — inherits STATE
ZIP-level market 54935
- Rents YoY
- 11.2%
- Active inventory
- 155
- Price-to-rent
- 7.5×
Monthly cashflow live
- Estimated rent
- $1,508 medium interval (Pro) →
- Mortgage (P&I)
- −$708
- Tax from tax record
- −$195 /mo · $2,341/yr
- Insurance
- −$56
- HOA
- −$0
- Vacancy / Maint / Mgmt
- −$317
- Net cashflow
- $232
Break-even live
UW: 25.0% down · 7.5% · 30yr · 1.5% tax · 5.0% vac · 8.0% maint · 8.0% mgmt
Financing live
Cash to close
- Down payment
- $33,750
- Closing costs
- $4,050
- Reserves months
- —
- Total cash needed
- —
Loan-product check · same deal, 3 products live
Conventional
25% down · 7.5% · 30yr
- Down + closing
- —
- Monthly P&I
- —
- Monthly cashflow
- —
- DSCR
- —
- Eligible?
- —
Personal DTI + credit; lowest rate.
DSCR
20% down · 8.5% · 30yr
- Down + closing
- —
- Monthly P&I
- —
- Monthly cashflow
- —
- DSCR
- —
- Eligible?
- —
No personal income docs; deal must DSCR.
Hard money
10% down · 12.0% · 12mo
- Down + closing
- —
- Monthly P&I
- —
- Monthly cashflow
- —
- DSCR
- —
- Eligible?
- —
Short-term bridge; refi at stabilization.
Listing history 7 events
-
2026-06-19days on market $135,000 Active 6 DOM
-
2026-06-18days on market $135,000 Active 5 DOM
-
2026-06-17days on market $135,000 Active 4 DOM
-
2026-06-16days on market $135,000 Active 3 DOM
-
2026-06-15days on market $135,000 Active 2 DOM
-
2026-06-14remarks 545-char remark
-
2026-06-14$135,000 Active 1 DOM
ⓘ Source: listings_history table (triggers on properties + properties_extension) + one-shot
backfill from property_details.listing_events for pre-trigger history.
Tax reassessment forecast WI · Partial reset (capped growth)
- Current annual tax
- $2,341 · $195/mo
- Projected year-2 tax
- $2,419 · $202/mo
- Expected delta
- +$78/yr (+$7/mo · 3.3%)
ⓘ Screening estimate from a state-policy table — verify with the county assessor before closing.
Climate risk First Street
- Flood 1/10 Low FEMA zone X (unshaded) · 0% chance over 30 yrs
- Wildfire 1/10 Low
- Heat 2/10 Low 7 d/yr ≥98°F today · 13 d/yr by 30 yrs out
- Wind 2/10 Low
- Air quality 2/10 Low 1 unhealthy d/yr today · 2 by 30 yrs out
Nearby sold comps map
Loading sold comps map…
Walkable amenities ~0.75 mi
Loading nearby amenities…
Taxation est. · year 1
- Rental income
- $18,096
- − Mortgage interest
- −$7,562
- − Property taxes
- −$2,341
- − Insurance
- −$675
- − Repairs & maintenance
- −$1,448
- − Management
- −$1,448
- − Depreciation
- −$3,927
- Taxable income
- $695
- Est. tax owed @ 24.0%
- −$167
- After-tax cash flow
- $2,617/yr
For passive investors: Depreciation is non-cash, so a rental often shows a tax loss while cash-flowing — sheltering income. Rental losses are passive: they offset passive income freely, and up to $25,000/yr can offset ordinary (W-2) income if you actively participate and your MAGI is under $100k (phasing out to $0 by $150k); unused losses carry forward. On sale, claimed depreciation is recaptured at up to 25%, and gains may owe capital-gains tax (a 1031 exchange can defer both). Figures are a year-1 estimate at your 24.0% rate — not tax advice; consult a CPA.
Schools (NCES district)
- District
- Fond Du Lac School District
- NCES district ID
- 5504680
- Math proficiency
- 34% ▼ -8.00%
- Reading proficiency
- 31% ▼ -6.00%
- Median HH income
- $50,125
- Composite
- 28.31/100
- National rank
- #6786
- State rank
- #255 of 342 in WI
Livability — Fond du Lac
- Score
- 74/100
- State rank
- #170
- US rank
- #4627
Category grades
Schools grade is shown separately in the Schools card above.
Census & demographics
- Census place
- Fond du Lac, WI
- County
- Fond du Lac County · 41,613 people
- City population
- 41,613
- Metro
- Fond du Lac, WI
- Population (ZIP)
- 41,613
- Household income
- $63,144
- Rent vs Own
- Severe rent burden
- 1157.0
Population outlook (Fond du Lac County) Hauer SSP2
- Today (2025)
- 102,433 people
- By 2030
- 101,594 · -0.8%
- By 2040
- 98,503 · -3.8%
- By 2050
- 95,039 · -7.2%
- By 2075
- 90,551 · -11.6%
- By 2100
- 87,819 · -14.3%
Race, ethnicity, and origin ACS 2023
- Neighborhood character
- Predominantly White (82%)
- Race & ethnicity
- White 82% Hispanic / Latino 9% Two or more races 6% Asian 3% Black 3%
- Hispanic origin (detail)
- Mexican 5%
- Common ancestry
- Romanian 5% Lithuanian 4% Portuguese 3%
- Foreign-born
- 5% · Canada, China
- Languages at home
- 92% English-only · Spanish 5% Chinese 1% Other Asian/Pacific 1%
Political lean MEDSL · Fond du Lac
- 2024 margin
- Strong R (+28.7) · D 35.1% · R 63.8% · Other 1.1%
- 2008→2024 swing
- -19.7pp toward R · 2008: -9.0pp · 2024: -28.7pp
- All cycles
- 2024: R+28.7 2020: R+26.5 2016: R+26.7 2012: R+15.0 2008: R+9.0
Not yet ingested
- Civics
- —
Market trends
- HPI YoY
- ▼ -178.76%
- Current HPI
- 205.5097
- Rent YoY
- ▲ 11.15%
- Metro
- Fond du Lac, WI
- State GDP YoY
- ▲ 2.10%
- F500 in state
- 20
Industry mix (Fortune 500 HQ in WI)
| Industry | F500 HQs | Revenue |
|---|---|---|
| Industrial Machinery | 4 | $23B |
|
||
| Industrial Technology | 2 | $36B |
|
||
| Insurance | 1 | $36B |
|
||
| Professional Services | 1 | $19B |
|
||
| Utilities | 1 | $9B |
|
||
| Consumer Goods | 1 | $3B |
|
||
Price history
1 event — show timeline
- 2026-06-11 Listed $135,000 METROMLS
Property tax history
+0.2%/yrLatest (2025): $2,341 · +20.0% YoY. Source: county tax records.
Cash-flow waterfall
monthlySold comps — $/sqft
last 12 mo · ≤1 miLoading sold comps…