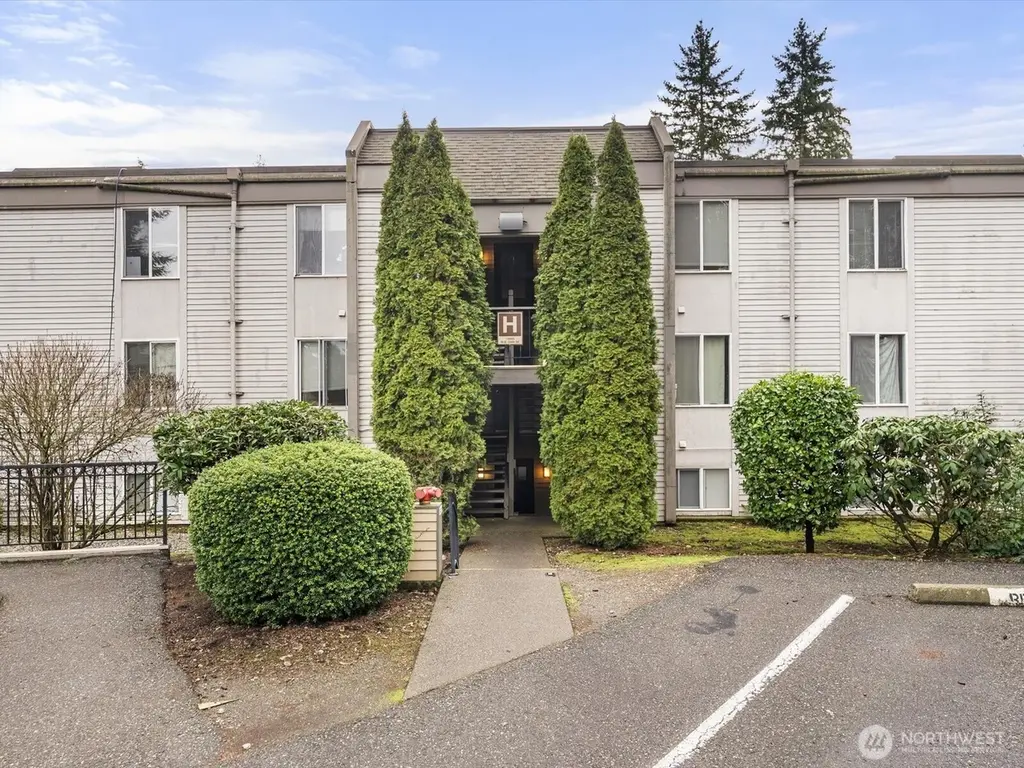
14605 34th St NE Unit h19 · Bellevue, WA
Flood risk 1/10 · Minimal
- FEMA flood zone
- X (unshaded)
- Chance of flooding over 30 yrs
- 0.0%
- Est. flood insurance / yr
- $507 – $1,088
Fire risk 1/10 · Minimal
- Est. fire insurance / yr
- $604 – $1,122
Heat risk 3/10 · Minor
- Hot days now (above 87°F)
- 7 days/yr
- Hot days in 30 yrs
- 15 days/yr
Wind risk 1/10 · Minimal
- Chance of severe wind over 30 yrs
- —
Air-quality risk 7/10 · Major
- Unhealthy air days now
- 10 days/yr
- Unhealthy air days in 30 yrs
- 13 days/yr
Risk factors via First Street. Map © Google.
Why this score? — see what drove the D- grade
The composite is a weighted blend of 9 inputs, each scored 0–100. Each bar is that input's sub-score; the figure is the points it added to the 100-point composite (weight × sub-score).
- ARV discount +15.0/15.0
- Schools +6.9/10.0
- Cash flow +5.2/30.0
- Livability +4.4/5.0
- 1% rule +3.7/10.0
- Condition / age +2.5/5.0
- Rent growth +2.1/5.0
- DSCR +0.0/10.0
- Appreciation +0.0/10.0
$295,000
🖨 Deal sheet (PDF) 📄 Offer letter ✓ Due diligence
Listing remarks
Huge price drop! Location! Location! Location! top floor unit! This 2 bedroom Bellevue Condo is in a Prime location w/ the Microsoft campus across the street, EZ access to Hwy-520 & Hwy-405 & mins from shops, dining & entertainment. The perfect home for First Time Buyers or Investors. (NO RENTAL CAP!) Primary bedroom has double closets & private bath, large 2nd bedroom, good sized living room opens to the deck & dining room w/ LARGE pantry or storage area. Designated parking spot & plenty of guest parking. Community offers: Swimming Pool, tennis court, Cabana w/ exercise room & green spaces all in the Awarding winning Bellevue School District.
Key facts
- Tennis court
- Exercise room
- Swimming pool
Tags
Property features AI
Finance
- Other: Property is residential condominium within Bellevue Manor
- Financial info: Listing terms: Cash
- HOA & community: Monthly HOA fee of $790 covering water, sewer and trash; HOA-managed water and sewer; Community allows cats and dogs; Community contains 215 units; 24 units in building; Association contact: Catherine Fobi
Exterior
- Parking: One uncovered/open parking space
- Security: No security details provided
- Utilities: Electric power (PSE); Water and sewer provided through HOA
- Home design: Attached condominium; One-level condo unit; Unit has a view; Main entry level; Third-floor unit within a three-story building
- Construction: Wood construction; Torch down roof; Effective year built 1976; Condominium structure
- Exterior features: Wood and wood products exterior
Interior
- Kitchen: No specific kitchen appliance details provided
- Bedrooms: Two bedrooms (both on the main level)
- Flooring: No flooring details provided
- Bathrooms: One full bathroom; One half bathroom; One bathtub; One shower
- Heating & cooling: Baseboard heating; No cooling
- Interior features: Electric water heater located in closet; Water heater present
- Laundry & utility: No laundry appliance details provided
Neighborhood map
What this means for you Summary
Snapshot
- This is a 2-bed/2.0-bath condo listed at $295k.
Deal economics
- At list price, monthly cash flow is $-666 ($-8k/yr) — negative.
- To cash-flow at today's rent, offer at most $177k (39.9% below list).
- To meet the 1% rule (rent ≥ 1% of price), the offer needs to be $257k (13.0% below list).
- Recommended offer: $177k (39.9% below list) — sets the bar for cash-flow.
- Cap rate 3.6% vs local median 1.1% in Bellevue — top-decile yield for the area; either an underpriced asset or a hidden risk that comps aren't pricing in. Stress-test before assuming the spread holds.
Location & tenants
- Location reads 87/100 on livability (#15 in WA, #314 nationally) — a professional / high-income tenant draw. Strengths: amenities A+, commute A+, employment A+; Watch: cost of living F.
- Bellevue School District (urban): math 73% / reading 79% proficiency, ranked #7 of 291 in WA (top 2%) — strong family-tenant draw, lease renewals of 3-5y typical; only 15% free/reduced lunch — higher-income household profile.
- Zoned schools: Ardmore Elementary School (358 students, 50% FRL); Highland Middle School (618 students, 58% FRL); Interlake Senior High School (1,543 students, 26% FRL) — zoned schools average 45% FRL vs 15% district-wide (30 pts higher); higher-poverty schools than district average — tighter screening recommended.
- Market conditions: Rents soft (-1.7%/yr); 133 active listings in the ZIP; 40 comparable units currently listed for rent nearby; rentals leasing fast (median 2d on market — plan ~1-2 weeks tenant-placement turnaround); high-income renter base; 10,555 units permitted in King County in 2024 (7,119 in 5+ unit buildings).
Forward outlook
- Local home prices are declining (-3.0%/yr); year-one equity from $2k of loan paydown is wiped out by about $9k of value loss. Plan a longer hold.
- King County population projected at +44% by 2050 — long-run rental-demand tailwind backs the buy-and-hold thesis.
Negotiation context
- It's been on market 18 days — a 2% lower offer ($291k) is reasonable based on typical stale-listing flexibility.
- 8 sale attempts since 23y ago with the ask held roughly flat each time — persistent listings suggest the price (not the market) is what's stuck; bring a comps-based counter.
Risks & watch-outs
- Watch-outs: HOA is 31% of rent.
Questions for the listing agent
- What do current leases actually rent for vs. the listed asking? Can we see a recent rent roll and the last 12 months of T-12 income?
- Built in 1976 — when were the roof, HVAC, electrical panel, plumbing, and water heater last replaced?
- What does the HOA fee cover, when was the last increase, and are there any pending special assessments or reserve-fund shortfalls?
- Any open or pending special assessments — roof, HVAC, plumbing, elevator, façade? What's the per-unit balance and payoff schedule, and is the seller paying it off at close or rolling it to the buyer?
- Is there a deadline driving the sale (1031 exchange, divorce, estate, relocation)? That informs how much negotiation room exists.
- Schools are A-rated — typically a magnet for longer-tenancy family renters. What's the average tenant stay here, and is there a school-zone premium baked into asking?
- The area grade is low — what's the realistic commute time and amenity access for the typical tenant pool here? Any planned neighborhood developments (good or bad) we should know about?
- What's the average days-on-market for RENTAL listings here right now (not sales)? A rising rental-DOM trend means longer vacancies and softer asking-rent achievability than the comps imply.
- What's the recent tenant-quality profile in this submarket — average credit score on applications, eviction rate, late-payment / NSF rate, and stable-employment percentage? A property-management company in the area should have these aggregated.
- How much new apartment / multifamily construction is in the pipeline within 1–3 miles? Heavy new supply (>2% of stock underway) typically softens rents 12–24 months out; light construction supports rent growth.
Investment metrics
- 1% rule
- 0.87% ✗
- Cap rate
- 3.58%
- Cash-on-cash
- -9.68%
- DSCR
- 0.57
- GRM
- 9.6
CMA / ARV
- ARV (median comp)
- $383,173
- List price
- $295,000
- Delta
- -22.23%
- Verdict
- UNDERPRICED
- Comps
- 20 within 1.0 mi
Projected returns pro-forma
-3.0% appreciation · 0.0% rent growth · sell at horizon
- IRR
- -38.3%
- Equity multiple
- -0.18×
- Total profit
- $-97,301
- Equity at exit
- $43,985
- IRR
- -91.3%
- Equity multiple
- -1.02×
- Total profit
- $-166,617
- Equity at exit
- $25,506
Cash invested: $82,600 (down + closing). Projections, not guarantees.
Landlord ↔ Tenant lean methodology
- Overall (STATE)
- 28 Tenant-Leaning
- State Washington
- 28 Tenant-Leaning · D+8
- County
- — inherits STATE
- City
- — inherits STATE
ZIP-level market 98007
- Rents YoY
- -1.7%
- Active inventory
- 133
- Price-to-rent
- 9.6×
Monthly cashflow live
- Estimated rent
- $2,566 high interval (Pro) →
- Mortgage (P&I)
- −$1,547
- Tax from tax record
- −$233 /mo · $2,796/yr
- Insurance
- −$123
- HOA
- −$790
- Vacancy / Maint / Mgmt
- −$539
- Net cashflow
- $-666
Break-even live
Sensitivity live
| Price | -10% $-499 | -5% $-583 | +0% $-666 | +5% $-750 | +10% $-833 |
|---|---|---|---|---|---|
| Rent | -10% $-869 | -5% $-767 | +0% $-666 | +5% $-565 | +10% $-463 |
| Rate | -1.0pp $-517 | -0.5pp $-591 | base $-666 | +0.5pp $-742 | +1.0pp $-820 |
UW: 25.0% down · 7.5% · 30yr · 1.5% tax · 5.0% vac · 8.0% maint · 8.0% mgmt
Financing live
Cash to close
- Down payment
- $73,750
- Closing costs
- $8,850
- Reserves months
- —
- Total cash needed
- —
Loan-product check · same deal, 3 products live
Conventional
25% down · 7.5% · 30yr
- Down + closing
- —
- Monthly P&I
- —
- Monthly cashflow
- —
- DSCR
- —
- Eligible?
- —
Personal DTI + credit; lowest rate.
DSCR
20% down · 8.5% · 30yr
- Down + closing
- —
- Monthly P&I
- —
- Monthly cashflow
- —
- DSCR
- —
- Eligible?
- —
No personal income docs; deal must DSCR.
Hard money
10% down · 12.0% · 12mo
- Down + closing
- —
- Monthly P&I
- —
- Monthly cashflow
- —
- DSCR
- —
- Eligible?
- —
Short-term bridge; refi at stabilization.
Rent comps 40 comps
| Address | Beds | Baths | Sqft | Rent | $/sqft | DOM | Units | Dist |
|---|---|---|---|---|---|---|---|---|
| 14605 NE 34th St Unit H22 Bellevue, WA | 2.0 | 1.5 | 955 | $2,000 | $2.09 | 26d | 1 | 0.03mi |
| 14625 NE 34th St Unit G15 Bellevue, WA | 3.0 | 2.0 | 1062 | $2,800 | $2.64 | 45d | 1 | 0.04mi |
| 14620 NE 32nd St Unit F7 Bellevue, WA | 3.0 | 2.0 | 1062 | $3,500 | $3.30 | 45d | 1 | 0.05mi |
| 14665 NE 34th St Unit B21 Bellevue, WA | 1.0 | 1.0 | 684 | $1,990 | $2.91 | 26d | 1 | 0.06mi |
| 14620 NE 31st St Bellevue, WA | 1.0 | 1.0 | 680 | $1,892 | $2.78 | 45d | 2 | 0.13mi |
| 14700 NE 35th St Bellevue, WA | 1.0–3.0 | 1.0–2.5 | 924 | $2,995 | $3.24 | 1d | 19 | 0.13mi |
| 14620 NE 31st St Unit E304 Bellevue, WA | 1.0 | 1.0 | 680 | $1,995 | $2.93 | 26d | 1 | 0.13mi |
| 14620 NE 31st St Unit F205 Bellevue, WA | 1.0 | 1.0 | 680 | $2,000 | $2.94 | 26d | 1 | 0.13mi |
| 14620 NE 31st St Unit E-305 Bellevue, WA | 1.0 | 1.0 | 680 | $1,995 | $2.93 | 18d | 1 | 0.13mi |
| 14515 NE 32nd St Unit H-202 Bellevue, WA | 2.0 | 1.0 | 890 | $2,499 | $2.81 | 45d | 1 | 0.14mi |
| 3615 147th Pl NE Bellevue, WA | 1.0–2.0 | 1.0 | 862 | $2,710 | $3.14 | 0d | 10 | 0.22mi |
| 14629 NE 37th Pl Bellevue, WA | 1.0–2.0 | 1.0 | 736 | $2,370 | $3.22 | 0d | 10 | 0.25mi |
| 14537 NE 40th St Unit 104 Bellevue, WA | 2.0 | 2.0 | 1080 | $2,750 | $2.55 | 1d | 1 | 0.38mi |
| 14527 NE 40th St Unit G101 Bellevue, WA | 2.0 | 1.0 | 900 | $2,299 | $2.55 | 4d | 1 | 0.40mi |
| 14425 NE 40th St Bellevue, WA | 2.0 | 2.0 | 1080 | $2,750 | $2.55 | 45d | 1 | 0.41mi |
| 14710 NE 40th St Bellevue, WA | 1.0–2.0 | 1.0–2.0 | 976 | $3,228 | $3.31 | 0d | 22 | 0.44mi |
| 2808 Calder Ave NE Redmond, WA | 2.0 | 1.0–2.0 | 873 | $3,865 | $4.42 | 0d | 40 | 0.55mi |
| 2690 152nd Ave NE Redmond, WA | 3.0 | 1.0–2.0 | 1111 | $3,212 | $2.89 | 1d | 1 | 0.55mi |
| 15301 NE Turing St Redmond, WA | 2.0 | 1.0–2.0 | 923 | $3,801 | $4.12 | 1d | 1 | 0.61mi |
| 4277 148th Ave NE Bellevue, WA | 1.0–2.0 | 1.0–2.0 | 781 | $2,838 | $3.63 | 1d | 10 | 0.65mi |
| 15551 NE Turing St Redmond, WA | 2.0 | 1.0–2.0 | 868 | $3,730 | $4.30 | 1d | 34 | 0.66mi |
| 2710 Tagore Ave NE Redmond, WA | 3.0 | 1.0–2.0 | 856 | $1,919 | $2.24 | 0d | 9 | 0.67mi |
| 2651 156th Ave NE Redmond, WA | 2.0 | 1.0–2.0 | 908 | $3,975 | $4.38 | 1d | 14 | 0.71mi |
| 15602 NE 40th St Redmond, WA | 3.0 | 1.0–2.0 | 935 | $3,332 | $3.56 | 1d | 1 | 0.72mi |
| 2222 152nd Ave NE Redmond, WA | 2.0 | 2.0 | 1059 | $2,850 | $2.69 | 45d | 2 | 0.75mi |
| 15606 NE 40th St Bldg Z Redmond, WA | 1.0 | 1.0 | 664 | $3,120 | $4.70 | 22d | 1 | 0.86mi |
| 15350 Bel Red Rd Redmond, WA | 2.0 | 1.0–2.0 | 824 | $3,865 | $4.69 | 1d | 10 | 0.87mi |
| 15566 NE 22 Pl #910 Bellevue, WA | 1.0–2.0 | 1.0–2.0 | 832 | $3,320 | $3.99 | 45d | 2 | 0.88mi |
| 2170 Bel-Red Rd Bellevue, WA | 2.0 | 1.0–2.0 | 867 | $3,802 | $4.39 | 1d | 20 | 0.88mi |
| 15606 NE 40th St Redmond, WA | 1.0–3.0 | 1.0–2.0 | 964 | $2,951 | $3.06 | 1d | 1 | 0.91mi |
| 2030 155th Pl NE Bellevue, WA | 2.0 | 1.0–2.0 | 830 | $3,641 | $4.38 | 0d | 54 | 0.94mi |
| 4850 156th Ave NE Redmond, WA | 1.0–2.0 | 1.0–2.0 | 850 | $2,903 | $3.42 | 1d | 17 | 1.06mi |
| 15207 NE 16th Pl Bellevue, WA | 2.0 | 1.0–2.0 | 704 | $2,600 | $3.69 | 1d | 25 | 1.19mi |
| 16539 NE 35th Ct Redmond, WA | 1.0–3.0 | 1.0–2.0 | 818 | $2,468 | $3.02 | 1d | 11 | 1.23mi |
| 1616 156th Ave NE Bellevue, WA | 1.0 | 1.0 | 445 | $1,994 | $4.48 | 14d | 10 | 1.26mi |
| 1400 154th Ave NE #4303 Bellevue, WA | 1.0 | 1.0 | 700 | $1,850 | $2.64 | 45d | 1 | 1.30mi |
| 15309 NE 13th Pl Bellevue, WA | 2.0 | 1.0–2.0 | 726 | $2,597 | $3.58 | 0d | 19 | 1.33mi |
| 15750 NE 15th St Bellevue, WA | 1.0 | 1.0 | 451 | $1,736 | $3.84 | 5d | 6 | 1.34mi |
| 13238 NE Spring Blvd Bellevue, WA | 2.0 | 1.0–2.0 | 696 | $3,870 | $5.56 | 1d | 21 | 1.36mi |
| 1468 158th Ct NE #703 Bellevue, WA | 3.0 | 2.0 | 1050 | $2,900 | $2.76 | 26d | 1 | 1.40mi |
HOA detail condo
- Monthly dues
- $790 · $9,480/yr
- Likely covers
- pool
- Assessments
- None detected in remarks — confirm with the listing agent.
Listing history 43 events
-
2026-06-21days on market $295,000 Active 18 DOM
-
2026-06-18days on market $295,000 Active 15 DOM
-
2026-06-17days on market $295,000 Active 14 DOM
-
2026-06-16days on market $295,000 Active 13 DOM
-
2026-06-15days on market $295,000 Active 12 DOM
-
2026-06-13days on market $295,000 Active 10 DOM
-
2026-06-09days on market $295,000 Active 6 DOM
-
2026-06-08days on market $295,000 Active 5 DOM
-
2026-06-07days on market $295,000 Active 4 DOM
-
2026-06-04pricedays on market $295,000 Active 1 DOM
-
2026-06-02days on market $298,000 Active 120 DOM
-
2026-06-01days on market $298,000 Active 119 DOM
-
2026-05-31days on market $298,000 Active 118 DOM
-
2026-05-07price $298,000
-
2026-04-29price $310,000
-
2026-04-09price $320,000
-
2026-02-02$330,000 Active
-
2018-02-28soldstatus $330,000 Sold
-
2018-02-28soldstatus $330,000
-
2018-01-28status Pending
-
2018-01-18$299,990 Active
-
2015-12-15soldstatus $199,000 Sold
-
2015-11-30status Pending
-
2015-11-02price $207,000
-
2015-10-28status Active
-
2015-10-27status Pending
-
2015-10-08$222,000 Active
-
2011-10-07soldstatus $115,000 Sold
-
2011-09-29status Pending
-
2011-09-20status Pending Inspection
-
2011-09-06status Active
-
2011-09-03historical Expired
-
2011-08-11$115,000 Active
-
2006-06-27soldstatus $191,000 Closed
-
2006-06-27soldstatus $191,000
-
2006-05-25historical
-
2006-05-18price $195,000
-
2006-04-27$199,500
-
2003-10-17soldstatus $110,000
-
2003-10-17soldstatus $110,000
-
2003-09-11$111,950
-
1999-05-14soldstatus $87,000
-
1979-09-12soldstatus $41,000
ⓘ Source: listings_history table (triggers on properties + properties_extension) + one-shot
backfill from property_details.listing_events for pre-trigger history.
Tax reassessment forecast WA · Resets to sale price
- Current annual tax
- $2,796 · $233/mo
- Projected year-2 tax
- $2,891 · $241/mo
- Expected delta
- +$95/yr (+$8/mo · 3.4%)
ⓘ Screening estimate from a state-policy table — verify with the county assessor before closing.
Climate risk First Street
- Flood 1/10 Low FEMA zone X (unshaded) · 0% chance over 30 yrs
- Wildfire 1/10 Low
- Heat 3/10 Moderate 7 d/yr ≥87°F today · 15 d/yr by 30 yrs out
- Wind 1/10 Low
- Air quality 7/10 Severe 10 unhealthy d/yr today · 13 by 30 yrs out
Nearby sold comps map
Loading sold comps map…
Walkable amenities ~0.75 mi
Loading nearby amenities…
Taxation est. · year 1
- Rental income
- $30,788
- − Mortgage interest
- −$16,525
- − Property taxes
- −$2,796
- − Insurance
- −$1,475
- − Repairs & maintenance
- −$2,463
- − Management
- −$2,463
- − HOA
- −$9,480
- − Depreciation
- −$8,582
- Taxable loss
- −$12,995
- Est. tax savings @ 24.0%
- +$3,119
- After-tax cash flow
- $-4,874/yr
For passive investors: Depreciation is non-cash, so a rental often shows a tax loss while cash-flowing — sheltering income. Rental losses are passive: they offset passive income freely, and up to $25,000/yr can offset ordinary (W-2) income if you actively participate and your MAGI is under $100k (phasing out to $0 by $150k); unused losses carry forward. On sale, claimed depreciation is recaptured at up to 25%, and gains may owe capital-gains tax (a 1031 exchange can defer both). Figures are a year-1 estimate at your 24.0% rate — not tax advice; consult a CPA.
Schools (NCES district)
- District
- Bellevue School District
- NCES district ID
- 5300390
- Math proficiency
- 73% ▼ -2.00%
- Reading proficiency
- 79% ▬ 0.00%
- Median HH income
- $92,676
- Composite
- 69.36/100
- National rank
- #622
- State rank
- #7 of 291 in WA
Livability — Bellevue
- Score
- 87/100
- State rank
- #15
- US rank
- #314
Category grades
Schools grade is shown separately in the Schools card above.
Census & demographics
- Census place
- Bellevue, WA
- County
- King County · 2,251,916 people
- City population
- 156,686
- Metro
- Seattle-Tacoma-Bellevue, WA
- Population (ZIP)
- 27,692
- Household income
- $131,109
- Rent vs Own
- Severe rent burden
- 1260.0
Population outlook (King County) Hauer SSP2
- Today (2025)
- 2,576,485 people
- By 2030
- 2,803,316 · +8.8%
- By 2040
- 3,255,921 · +26.4%
- By 2050
- 3,706,444 · +43.9%
- By 2075
- 4,746,063 · +84.2%
- By 2100
- 5,407,730 · +109.9%
Race, ethnicity, and origin ACS 2023
- Neighborhood character
- Diverse neighborhood (Simpson 0.68)
- Race & ethnicity
- Asian 46% White 31% Hispanic / Latino 12% Two or more races 9% Black 5%
- Hispanic origin (detail)
- Mexican 8%
- Common ancestry
- Scotch-Irish 2% Lithuanian 1% Italian 1%
- Foreign-born
- 52% · China, Canada, Vietnam
- Languages at home
- 43% English-only · Other Indo-European 16% Other Asian/Pacific 12% Chinese 9%
Political lean MEDSL · King
- 2024 margin
- Solid D (+51.7) · D 74.2% · R 22.5% · Other 3.4%
- 2008→2024 swing
- +9.6pp toward D · 2008: 42.1pp · 2024: 51.7pp
- All cycles
- 2024: D+51.7 2020: D+52.7 2016: D+50.4 2012: D+39.9 2008: D+42.1
Not yet ingested
- Civics
- —
Market trends
- HPI YoY
- ▼ -886.99%
- Current HPI
- 424.8727
- Rent YoY
- ▼ -1.74%
- Metro
- Seattle-Tacoma-Bellevue, WA
- State GDP YoY
- ▲ 4.65%
- F500 in state
- 22
Industry mix (Fortune 500 HQ in WA)
| Industry | F500 HQs | Revenue |
|---|---|---|
| Retail | 2 | $269B |
|
||
| Technology / Retail | 1 | $638B |
|
||
| Technology | 1 | $245B |
|
||
| Telecommunications | 1 | $38B |
|
||
| Food / Beverage | 1 | $36B |
|
||
| Automotive / Trucks | 1 | $34B |
|
||
Price history
+619.5% since first listed27 events — show timeline
- 2026-06-03 Listed $295,000 NWMLS as Distributed by MLS Grid
- 2018-02-28 Sold (Public Records) $330,000 Public Records
- 2018-02-28 Sold (MLS) $330,000 NWMLS as Distributed by MLS Grid
- 2018-01-28 Pending — NWMLS as Distributed by MLS Grid
- 2018-01-18 Listed $299,990 NWMLS as Distributed by MLS Grid
- 2015-12-15 Sold (MLS) $199,000 NWMLS as Distributed by MLS Grid
- 2015-11-30 Pending — NWMLS as Distributed by MLS Grid
- 2015-11-02 Price Changed $207,000 NWMLS as Distributed by MLS Grid
- 2015-10-28 Relisted — NWMLS as Distributed by MLS Grid
- 2015-10-27 Pending — NWMLS as Distributed by MLS Grid
- 2015-10-08 Listed $222,000 NWMLS as Distributed by MLS Grid
- 2011-10-07 Sold (MLS) $115,000 NWMLS as Distributed by MLS Grid
- 2011-09-29 Pending — NWMLS as Distributed by MLS Grid
- 2011-09-20 Pending — NWMLS as Distributed by MLS Grid
- 2011-09-06 Relisted — NWMLS as Distributed by MLS Grid
- 2011-09-03 Delisted — NWMLS as Distributed by MLS Grid
- 2011-08-11 Listed $115,000 NWMLS as Distributed by MLS Grid
- 2006-06-27 Sold (Public Records) $191,000 Public Records
- 2006-06-27 Sold (MLS) $191,000 NWMLS as Distributed by MLS Grid
- 2006-05-25 Delisted — NWMLS as Distributed by MLS Grid
- 2006-05-18 Price Changed $195,000 NWMLS as Distributed by MLS Grid
- 2006-04-27 Listed $199,500 NWMLS as Distributed by MLS Grid
- 2003-10-17 Sold (Public Records) $110,000 Public Records
- 2003-10-17 Sold (MLS) $110,000 NWMLS as Distributed by MLS Grid
- 2003-09-11 Listed $111,950 NWMLS as Distributed by MLS Grid
- 1999-05-14 Sold (Public Records) $87,000 Public Records
- 1979-09-12 Sold (Public Records) $41,000 Public Records
Property tax history
+4.9%/yrLatest (2025): $2,796 · -8.1% YoY. Source: county tax records.
Cash-flow waterfall
monthlySold comps — $/sqft
last 12 mo · ≤1 miLoading sold comps…