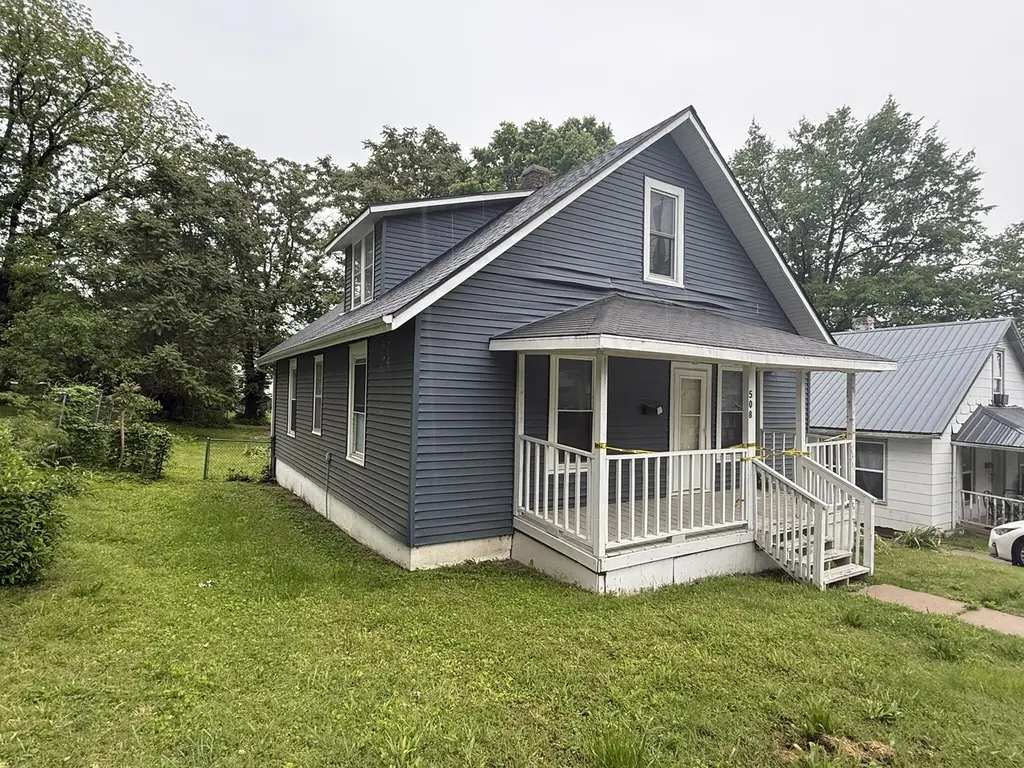
508 Poertner St · Boonville, MO
Flood risk 1/10 · Minimal
- FEMA flood zone
- X (unshaded)
- Chance of flooding over 30 yrs
- 0.0%
- Est. flood insurance / yr
- $507 – $1,088
Fire risk 3/10 · Minor
- Est. fire insurance / yr
- $1,054 – $1,958
Heat risk 4/10 · Minor
- Hot days now (above 107°F)
- 7 days/yr
- Hot days in 30 yrs
- 18 days/yr
Wind risk 2/10 · Minimal
- Chance of severe wind over 30 yrs
- —
Air-quality risk 2/10 · Minimal
- Unhealthy air days now
- 0 days/yr
- Unhealthy air days in 30 yrs
- 1 days/yr
Risk factors via First Street. Map © Google.
Why this score? — see what drove the F grade
The composite is a weighted blend of 9 inputs, each scored 0–100. Each bar is that input's sub-score; the figure is the points it added to the 100-point composite (weight × sub-score).
- Cash flow +8.7/30.0
- ARV discount +7.5/15.0
- Livability +3.1/5.0
- Schools +3.0/10.0
- Rent growth +2.5/5.0
- Condition / age +2.5/5.0
- DSCR +2.4/10.0
- 1% rule +1.6/10.0
- Appreciation +0.0/10.0
$144,900
🖨 Deal sheet (PDF) 📄 Offer letter ✓ Due diligence
Listing remarks MLS
Nicely remodeled 4 bedroom cottage style home. 2 bedrooms on main, 2 on upper. 1.5 baths. Full, unfinished basement. Nice backyard, off-street parking.
Key facts
- 7,500 sq ft lot
- Garage
- Built 1920
Property features AI
Exterior
- Parking: Has garage; Carport
- Utilities: Public water
- Home design: Single-family residence; Residential property
- Construction: Zoned for single-family residential; Lot dimensions approximately 50 x 150
- Exterior features: Deck
Interior
- Bedrooms: 2 total rooms (bedrooms/other rooms)
- Flooring: Carpet; Laminate
- Bathrooms: 1 full bathroom; 1 half bathroom
- Heating & cooling: Natural gas forced-air heating
- Interior features: Carpet and laminate flooring; Basement
Neighborhood map
What this means for you Summary
Snapshot
- This is a 2-bed/1.5-bath other listed at $145k.
Deal economics
- At list price, monthly cash flow is $-121 ($-1k/yr) — negative.
- To cash-flow at today's rent, offer at most $124k (14.8% below list).
- To meet the 1% rule (rent ≥ 1% of price), the offer needs to be $96k (33.7% below list).
- Recommended offer: $96k (33.7% below list) — sets the bar for 1% rule.
Location & tenants
- Location reads 61/100 on livability (#410 in MO) — a middle-class / working-renter tenant base. Strengths: cost of living A+, housing A+; Watch: amenities F, commute F, employment D-.
- Boonville R-I (town): math 31% / reading 39% proficiency, ranked #215 of 324 in MO (top 66%) — families likely to look elsewhere, expect single-tenant / working-renter base with shorter leases.
- Zoned schools: Boonville High (math 32% / reading 62%, grade D-, #155 of 521 statewide, top 32%, 569 students, 40% FRL) — zoned schools at 40% FRL track the district average.
- Zoned-school proficiency averages 47% at this address vs 35% district-wide (+12 pts) — the actual schools serving this property are materially stronger than the Boonville R-I average implies; a family-tenant draw the district grade alone would hide.
- Market conditions: 138 active listings in the ZIP; 3 comparable units currently listed for rent nearby; rentals at typical pace (median 22d on market — plan ~3-4 weeks tenant-placement turnaround); 10 units permitted in Cooper County in 2024 (0 in 5+ unit buildings).
Forward outlook
- Local home prices are declining (-3.0%/yr); year-one equity from $1k of loan paydown is wiped out by about $4k of value loss. Plan a longer hold.
- Cooper County population projected to shrink 4% by 2050 — rents likely to lag national; underwrite the cash flow, not the appreciation.
Negotiation context
- It's been on market 15 days — a 2% lower offer ($143k) is reasonable based on typical stale-listing flexibility.
- 5 sale attempts since 3y ago with the ask held roughly flat each time — persistent listings suggest the price (not the market) is what's stuck; bring a comps-based counter.
Risks & watch-outs
- Watch-outs: built in 1920 — expect roof / HVAC / electrical / plumbing capex.
Questions for the listing agent
- What do current leases actually rent for vs. the listed asking? Can we see a recent rent roll and the last 12 months of T-12 income?
- Built in 1920 — when were the roof, HVAC, electrical panel, plumbing, and water heater last replaced?
- Is there a deadline driving the sale (1031 exchange, divorce, estate, relocation)? That informs how much negotiation room exists.
- Schools are D-rated, which usually means shorter tenancies and higher turnover. Who's the typical renter profile here, and what's been the actual vacancy rate?
- The area grade is low — what's the realistic commute time and amenity access for the typical tenant pool here? Any planned neighborhood developments (good or bad) we should know about?
- What's the average days-on-market for RENTAL listings here right now (not sales)? A rising rental-DOM trend means longer vacancies and softer asking-rent achievability than the comps imply.
- What's the recent tenant-quality profile in this submarket — average credit score on applications, eviction rate, late-payment / NSF rate, and stable-employment percentage? A property-management company in the area should have these aggregated.
- How much new for-sale + rental construction is in the pipeline within 1–3 miles? Heavy new supply typically softens prices + rents 12–24 months out; constrained supply supports both.
Investment metrics
- 1% rule
- 0.66% ✗
- Cap rate
- 5.29%
- Cash-on-cash
- -3.58%
- DSCR
- 0.84
- GRM
- 12.6
CMA / ARV
No comps found within radius.
Projected returns pro-forma
-3.0% appreciation · 3.0% rent growth · sell at horizon
- IRR
- -22.4%
- Equity multiple
- 0.23×
- Total profit
- $-31,248
- Equity at exit
- $21,605
- IRR
- -16.6%
- Equity multiple
- 0.08×
- Total profit
- $-37,380
- Equity at exit
- $12,528
Cash invested: $40,572 (down + closing). Projections, not guarantees.
Landlord ↔ Tenant lean methodology
- Overall (STATE)
- 81 Strongly Landlord-Friendly
- State Missouri
- 81 Strongly Landlord-Friendly · R+10
- County
- — inherits STATE
- City
- — inherits STATE
ZIP-level market 65233
- Active inventory
- 138
- Price-to-rent
- 12.6×
Monthly cashflow live
- Estimated rent
- $961 medium interval (Pro) →
- Mortgage (P&I)
- −$760
- Tax from tax record
- −$60 /mo · $716/yr
- Insurance
- −$60
- HOA
- −$0
- Vacancy / Maint / Mgmt
- −$202
- Net cashflow
- $-121
Break-even live
Sensitivity live
| Price | -10% $-39 | -5% $-80 | +0% $-121 | +5% $-162 | +10% $-203 |
|---|---|---|---|---|---|
| Rent | -10% $-197 | -5% $-159 | +0% $-121 | +5% $-83 | +10% $-45 |
| Rate | -1.0pp $-48 | -0.5pp $-84 | base $-121 | +0.5pp $-159 | +1.0pp $-197 |
UW: 25.0% down · 7.5% · 30yr · 1.5% tax · 5.0% vac · 8.0% maint · 8.0% mgmt
Financing live
Cash to close
- Down payment
- $36,225
- Closing costs
- $4,347
- Reserves months
- —
- Total cash needed
- —
Loan-product check · same deal, 3 products live
Conventional
25% down · 7.5% · 30yr
- Down + closing
- —
- Monthly P&I
- —
- Monthly cashflow
- —
- DSCR
- —
- Eligible?
- —
Personal DTI + credit; lowest rate.
DSCR
20% down · 8.5% · 30yr
- Down + closing
- —
- Monthly P&I
- —
- Monthly cashflow
- —
- DSCR
- —
- Eligible?
- —
No personal income docs; deal must DSCR.
Hard money
10% down · 12.0% · 12mo
- Down + closing
- —
- Monthly P&I
- —
- Monthly cashflow
- —
- DSCR
- —
- Eligible?
- —
Short-term bridge; refi at stabilization.
Rent comps 3 comps
| Address | Beds | Baths | Sqft | Rent | $/sqft | DOM | Units | Dist |
|---|---|---|---|---|---|---|---|---|
| 622 7th St Unit B Boonville, MO | 2.0 | 1.0 | 700 | $1,100 | $1.57 | 44d | 1 | 0.67mi |
| 622 7th St Unit 622 7th St-C Boonville, MO | 1.0 | 1.0 | 700 | $900 | $1.29 | 21d | 1 | 0.67mi |
| 1214 Commercial St Apt C Boonville, MO | 2.0 | 1.0 | 850 | $850 | $1.00 | 21d | 1 | 1.14mi |
Listing history 12 events
-
2026-06-19days on market $144,900 Active 15 DOM
-
2026-06-18days on market $144,900 Active 14 DOM
-
2026-06-17days on market $144,900 Active 13 DOM
-
2026-06-16days on market $144,900 Active 12 DOM
-
2026-06-15days on market $144,900 Active 11 DOM
-
2026-06-14days on market $144,900 Active 9 DOM
-
2026-06-13days on market $144,900 Active 8 DOM
-
2026-06-10days on market $144,900 Active 6 DOM
-
2026-06-09days on market $144,900 Active 5 DOM
-
2026-06-08days on market $144,900 Active 4 DOM
-
2026-06-07remarks 172-char remark
-
2026-06-07$144,900 Active 3 DOM
ⓘ Source: listings_history table (triggers on properties + properties_extension) + one-shot
backfill from property_details.listing_events for pre-trigger history.
Tax reassessment forecast MO · Resets to sale price
- Current annual tax
- $716 · $60/mo
- Projected year-2 tax
- $1,406 · $117/mo
- Expected delta
- +$690/yr (+$57/mo · 96.4%)
ⓘ Screening estimate from a state-policy table — verify with the county assessor before closing.
Climate risk First Street
- Flood 1/10 Low FEMA zone X (unshaded) · 0% chance over 30 yrs
- Wildfire 3/10 Moderate
- Heat 4/10 Moderate 7 d/yr ≥107°F today · 18 d/yr by 30 yrs out
- Wind 2/10 Low
- Air quality 2/10 Low 0 unhealthy d/yr today · 1 by 30 yrs out
Nearby sold comps map
Loading sold comps map…
Walkable amenities ~0.75 mi
Loading nearby amenities…
Taxation est. · year 1
- Rental income
- $11,527
- − Mortgage interest
- −$8,117
- − Property taxes
- −$716
- − Insurance
- −$724
- − Repairs & maintenance
- −$922
- − Management
- −$922
- − Depreciation
- −$4,215
- Taxable loss
- −$4,089
- Est. tax savings @ 24.0%
- +$981
- After-tax cash flow
- $-471/yr
For passive investors: Depreciation is non-cash, so a rental often shows a tax loss while cash-flowing — sheltering income. Rental losses are passive: they offset passive income freely, and up to $25,000/yr can offset ordinary (W-2) income if you actively participate and your MAGI is under $100k (phasing out to $0 by $150k); unused losses carry forward. On sale, claimed depreciation is recaptured at up to 25%, and gains may owe capital-gains tax (a 1031 exchange can defer both). Figures are a year-1 estimate at your 24.0% rate — not tax advice; consult a CPA.
Schools (NCES district)
- District
- Boonville R-I
- NCES district ID
- 2905580
- Math proficiency
- 31% ▼ -7.00%
- Reading proficiency
- 39% ▼ -5.00%
- Median HH income
- $44,038
- Composite
- 29.75/100
- National rank
- #6441
- State rank
- #215 of 324 in MO
Livability — Boonville
- Score
- 61/100
- State rank
- #410
- US rank
- #17337
Category grades
Schools grade is shown separately in the Schools card above.
Census & demographics
- Census place
- Boonville, MO
- Population (ZIP)
- 10,853
Population outlook (Cooper County) Hauer SSP2
- Today (2025)
- 17,611 people
- By 2030
- 17,665 · +0.3%
- By 2040
- 17,445 · -0.9%
- By 2050
- 16,916 · -3.9%
- By 2075
- 15,807 · -10.2%
- By 2100
- 13,148 · -25.3%
Race, ethnicity, and origin ACS 2023
- Neighborhood character
- Predominantly White (85%)
- Race & ethnicity
- White 85% Black 8% Two or more races 5% Hispanic / Latino 2%
- Common ancestry
- Slovak 3% Lithuanian 2% Iranian 2%
- Foreign-born
- 1%
- Languages at home
- 96% English-only · Spanish 1% German/W. Germanic 1% Chinese 1%
Political lean MEDSL · Cooper
- 2024 margin
- Solid R (+45.8) · D 26.6% · R 72.4% · Other 1.1%
- 2008→2024 swing
- -22.1pp toward R · 2008: -23.8pp · 2024: -45.8pp
- All cycles
- 2024: R+45.8 2020: R+46.3 2016: R+46.3 2012: R+32.1 2008: R+23.8
Not yet ingested
- Civics
- —
Market trends
- HPI YoY
- ▼ -214.93%
- Current HPI
- 213.6529
- Rent YoY
- —
- Metro
- —
- State GDP YoY
- ▲ 1.84%
- F500 in state
- 20
Industry mix (Fortune 500 HQ in MO)
| Industry | F500 HQs | Revenue |
|---|---|---|
| Healthcare | 1 | $163B |
|
||
| Insurance | 1 | $21B |
|
||
| Industrial Technology | 1 | $17B |
|
||
| Retail | 1 | $16B |
|
||
| Industrial Distribution | 1 | $10B |
|
||
| Utilities | 1 | $9B |
|
||
Price history
-7.7% since first listed14 events — show timeline
- 2026-06-03 Listed $144,900 CBORMLS
- 2023-06-02 Sold (Public Records) — Public Records
- 2023-05-31 Sold (MLS) — CMBR
- 2023-05-31 Sold (MLS) — CBORMLS
- 2023-05-01 Pending — CMBR
- 2023-05-01 Pending — CBORMLS
- 2023-04-24 Relisted — CBORMLS
- 2023-04-24 Relisted — CMBR
- 2023-04-23 Pending — CBORMLS
- 2023-04-21 Price Changed $157,000 CMBR
- 2023-04-21 Listed $15,700 CMBR
- 2023-04-21 Listed $157,000 CBORMLS
- 2021-07-01 Sold (Public Records) — Public Records
- 1995-05-01 Sold (Public Records) — Public Records
Property tax history
+2.8%/yrLatest (2025): $716 · +7.6% YoY. Source: county tax records.
Cash-flow waterfall
monthlySold comps — $/sqft
last 12 mo · ≤1 miLoading sold comps…