12831 Eagle Lake Ave · Rancho Cordova, CA
Flood risk No data
- FEMA flood zone
- —
- Chance of flooding over 30 yrs
- —
- Est. flood insurance / yr
- —
Fire risk No data
- Est. fire insurance / yr
- —
Heat risk No data
- Hot days now (above threshold)
- —
- Hot days in 30 yrs
- —
Wind risk No data
- Chance of severe wind over 30 yrs
- —
Air-quality risk No data
- Unhealthy air days now
- —
- Unhealthy air days in 30 yrs
- —
Risk factors via First Street. Map © Google.
Why this score? — see what drove the D- grade
The composite is a weighted blend of 9 inputs, each scored 0–100. Each bar is that input's sub-score; the figure is the points it added to the 100-point composite (weight × sub-score).
- Appreciation +10.0/10.0
- ARV discount +7.5/15.0
- Cash flow +6.2/30.0
- Schools +4.1/10.0
- Livability +3.4/5.0
- Rent growth +3.0/5.0
- Condition / age +2.5/5.0
- 1% rule +0.6/10.0
- DSCR +0.6/10.0
$640,000
🖨 Deal sheet (PDF) 📄 Offer letter ✓ Due diligence
Listing remarks MLS
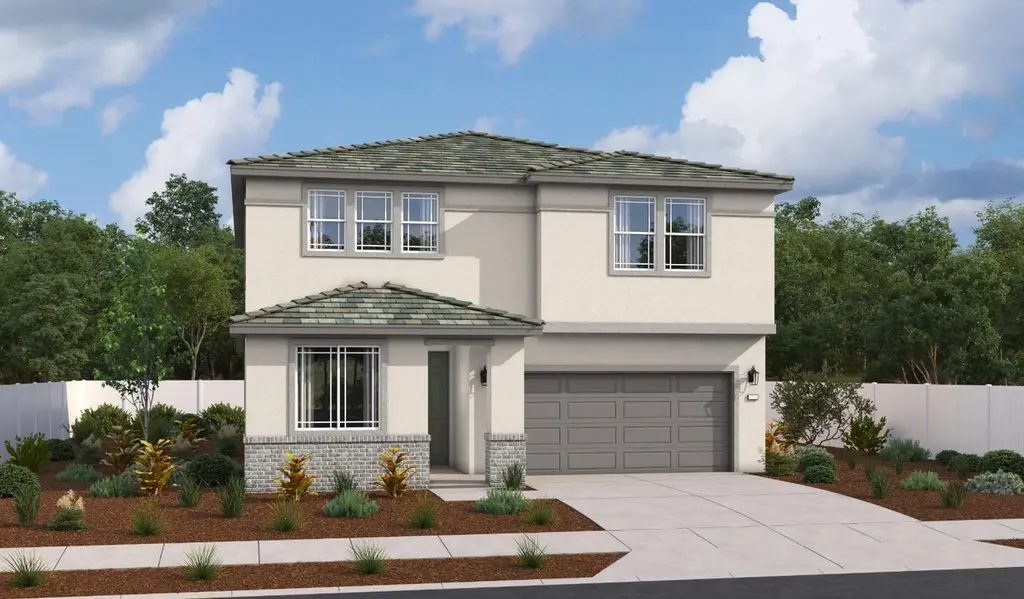
The Moonstone plan offers two stories of thoughtful living space. A spacious kitchen provides a panoramic view across the main floor's elegant dining area and an expansive great room. A main-floor bedroom and bathroom and a storage area round out this level. Upstairs, a stunning primary suite offers a roomy walk-in closet and a private bath. A laundry, a loft and three secondary bedrooms can also be found on this floor. Professionally curated fixtures and finishes are included. Visit today!
Key facts
- Panoramic view
- Main-floor bedroom
- Private bath
Tags
Neighborhood map
What this means for you Summary
Snapshot
- This is a 5-bed/3.0-bath land listed at $640k.
Deal economics
- At list price, monthly cash flow is $-1k ($-14k/yr) — negative.
- To cash-flow at today's rent, offer at most $436k (31.9% below list).
- To meet the 1% rule (rent ≥ 1% of price), the offer needs to be $356k (44.4% below list).
- Recommended offer: $356k (44.4% below list) — sets the bar for 1% rule.
- Cap rate 4.1% vs local median 3.0% in Rancho Cordova — top-decile yield for the area; either an underpriced asset or a hidden risk that comps aren't pricing in. Stress-test before assuming the spread holds.
Location & tenants
- Location reads 68/100 on livability (#268 in CA) — a middle-class / working-renter tenant base. Strengths: housing A+, employment B; Watch: commute C-, crime D, cost of living F.
- Elk Grove Unified (suburban): math 40% / reading 51% proficiency, ranked #165 of 517 in CA (top 32%) — families likely to look elsewhere, expect single-tenant / working-renter base with shorter leases.
- Zoned schools: Sunrise Elementary (math 65% / reading 67%, grade B+, #176 of 1,571 statewide, top 11%, 966 students, 21% FRL); Katherine L. Albiani Middle (math 55% / reading 67%, grade B+, #57 of 498 statewide, top 12%, 1,307 students, 27% FRL); Pleasant Grove High (math 57% / reading 74%, grade B, #157 of 1,170 statewide, top 14%, 2,520 students, 22% FRL) — zoned schools average 23% FRL vs 43% district-wide (19 pts lower); this property's tenant base skews higher-income than the district average.
- Zoned-school proficiency averages 64% at this address vs 46% district-wide (+19 pts) — the actual schools serving this property are materially stronger than the Elk Grove Unified average implies; a family-tenant draw the district grade alone would hide.
- Market conditions: Rents rising (+2.1%/yr); 471 active listings in the ZIP; 7 comparable units currently listed for rent nearby; rentals at typical pace (median 14d on market — plan ~3-4 weeks tenant-placement turnaround); 43% of comp listings sitting > 30 days — soft ceiling on asking rent; high-income renter base; 6,825 units permitted in Sacramento County in 2024 (1,752 in 5+ unit buildings).
Forward outlook
- In year one you build about $68k of equity ($4k loan paydown + $64k appreciation (10.0% local appreciation)).
- Sacramento County population projected at +17% by 2050 — long-run rental-demand tailwind backs the buy-and-hold thesis.
- By year 2, paydown + projected appreciation supports a ~$110k cash-out refi (75% LTV) — recoverable capital for the next deal without selling this one.
Negotiation context
- It's been on market 53 days — a 3% lower offer ($621k) is reasonable based on typical stale-listing flexibility.
Questions for the listing agent
- What do current leases actually rent for vs. the listed asking? Can we see a recent rent roll and the last 12 months of T-12 income?
- It's been on market 53 days. Have you received any prior offers? Is the seller open to a 44% concession, seller financing, or rate buy-down credit?
- Is there a deadline driving the sale (1031 exchange, divorce, estate, relocation)? That informs how much negotiation room exists.
- Crime grade is D in this area — have there been break-ins, vandalism, or insurance claims at this property in the last 3 years? What carrier currently insures it and at what premium?
- The area grade is low — what's the realistic commute time and amenity access for the typical tenant pool here? Any planned neighborhood developments (good or bad) we should know about?
- What's the average days-on-market for RENTAL listings here right now (not sales)? A rising rental-DOM trend means longer vacancies and softer asking-rent achievability than the comps imply.
- What's the recent tenant-quality profile in this submarket — average credit score on applications, eviction rate, late-payment / NSF rate, and stable-employment percentage? A property-management company in the area should have these aggregated.
- How much new for-sale + rental construction is in the pipeline within 1–3 miles? Heavy new supply typically softens prices + rents 12–24 months out; constrained supply supports both.
Investment metrics
- 1% rule
- 0.56% ✗
- Cap rate
- 4.12%
- Cash-on-cash
- -7.75%
- DSCR
- 0.66
- GRM
- 15.0
CMA / ARV
No comps found within radius.
Projected returns pro-forma
10.0% appreciation · 2.08% rent growth · sell at horizon
- IRR
- 18.6%
- Equity multiple
- 2.51×
- Total profit
- $271,384
- Equity at exit
- $576,563
- IRR
- 17.1%
- Equity multiple
- 5.74×
- Total profit
- $850,297
- Equity at exit
- $1,243,379
Cash invested: $179,200 (down + closing). Projections, not guarantees.
Landlord ↔ Tenant lean methodology
- Overall (STATE)
- 18 Strongly Tenant-Friendly
- State California
- 18 Strongly Tenant-Friendly · D+13
- County
- — inherits STATE
- City
- — inherits STATE
ZIP-level market 95742
- Home prices YoY
- 28.3%
- Rents YoY
- 2.1%
- Active inventory
- 471
- Price-to-rent
- 15.0×
Monthly cashflow live
- Estimated rent
- $3,561 high interval (Pro) →
- Mortgage (P&I)
- −$3,356
- Tax from tax record
- −$347 /mo · $4,164/yr
- Insurance
- −$267
- HOA
- −$0
- Vacancy / Maint / Mgmt
- −$748
- Net cashflow
- $-1,157
Break-even live
Sensitivity live
| Price | -10% $-795 | -5% $-976 | +0% $-1,157 | +5% $-1,338 | +10% $-1,519 |
|---|---|---|---|---|---|
| Rent | -10% $-1,438 | -5% $-1,298 | +0% $-1,157 | +5% $-1,016 | +10% $-876 |
| Rate | -1.0pp $-835 | -0.5pp $-994 | base $-1,157 | +0.5pp $-1,323 | +1.0pp $-1,491 |
UW: 25.0% down · 7.5% · 30yr · 1.5% tax · 5.0% vac · 8.0% maint · 8.0% mgmt
Financing live
Cash to close
- Down payment
- $160,000
- Closing costs
- $19,200
- Reserves months
- —
- Total cash needed
- —
Loan-product check · same deal, 3 products live
Conventional
25% down · 7.5% · 30yr
- Down + closing
- —
- Monthly P&I
- —
- Monthly cashflow
- —
- DSCR
- —
- Eligible?
- —
Personal DTI + credit; lowest rate.
DSCR
20% down · 8.5% · 30yr
- Down + closing
- —
- Monthly P&I
- —
- Monthly cashflow
- —
- DSCR
- —
- Eligible?
- —
No personal income docs; deal must DSCR.
Hard money
10% down · 12.0% · 12mo
- Down + closing
- —
- Monthly P&I
- —
- Monthly cashflow
- —
- DSCR
- —
- Eligible?
- —
Short-term bridge; refi at stabilization.
Rent comps 7 comps
| Address | Beds | Baths | Sqft | Rent | $/sqft | DOM | Units | Dist |
|---|---|---|---|---|---|---|---|---|
| 4328 Greenshank Cir Rancho Cordova, CA | 4.0 | 2.0 | 1800 | $3,100 | $1.72 | 45d | 1 | 0.52mi |
| 12855 Daylily Coast Ln Rancho Cordova, CA | 4.0 | 3.0 | 2745 | $3,400 | $1.24 | 14d | 1 | 0.55mi |
| 12647 Spotted Wren Way Rancho Cordova, CA | 5.0 | 3.0 | 2609 | $3,450 | $1.32 | 45d | 1 | 0.55mi |
| 12658 Rosefinch Way Unit 1 Rancho Cordova, CA | 5.0 | 3.5 | 2466 | $2,800 | $1.14 | 0d | 1 | 0.67mi |
| 4454 Greenshank Way Rancho Cordova, CA | 4.0 | 3.0 | 1900 | $2,795 | $1.47 | 0d | 1 | 0.75mi |
| 4480 Arctic Tern Way Rancho Cordova, CA | 4.0 | 2.5 | 2550 | $3,000 | $1.18 | 45d | 1 | 0.85mi |
| 3686 Rockdale Dr Rancho Cordova, CA | 4.0 | 2.0 | 1880 | $2,795 | $1.49 | 9d | 1 | 1.40mi |
Listing history 5 events
-
2026-05-07status Pending 496-char remark
Show marketing remark (496 chars)
The Moonstone plan offers two stories of thoughtful living space. A spacious kitchen provides a panoramic view across the main floor's elegant dining area and an expansive great room. A main-floor bedroom and bathroom and a storage area round out this level. Upstairs, a stunning primary suite offers a roomy walk-in closet and a private bath. A laundry, a loft and three secondary bedrooms can also be found on this floor. Professionally curated fixtures and finishes are included. Visit today!
-
2026-04-30price $640,000 496-char remark
Show marketing remark (496 chars)
The Moonstone plan offers two stories of thoughtful living space. A spacious kitchen provides a panoramic view across the main floor's elegant dining area and an expansive great room. A main-floor bedroom and bathroom and a storage area round out this level. Upstairs, a stunning primary suite offers a roomy walk-in closet and a private bath. A laundry, a loft and three secondary bedrooms can also be found on this floor. Professionally curated fixtures and finishes are included. Visit today!
-
2026-04-07price $646,875 496-char remark
Show marketing remark (496 chars)
The Moonstone plan offers two stories of thoughtful living space. A spacious kitchen provides a panoramic view across the main floor's elegant dining area and an expansive great room. A main-floor bedroom and bathroom and a storage area round out this level. Upstairs, a stunning primary suite offers a roomy walk-in closet and a private bath. A laundry, a loft and three secondary bedrooms can also be found on this floor. Professionally curated fixtures and finishes are included. Visit today!
-
2026-03-31price $656,875 496-char remark
Show marketing remark (496 chars)
The Moonstone plan offers two stories of thoughtful living space. A spacious kitchen provides a panoramic view across the main floor's elegant dining area and an expansive great room. A main-floor bedroom and bathroom and a storage area round out this level. Upstairs, a stunning primary suite offers a roomy walk-in closet and a private bath. A laundry, a loft and three secondary bedrooms can also be found on this floor. Professionally curated fixtures and finishes are included. Visit today!
-
2026-03-15$666,875 Active 496-char remark
Show marketing remark (496 chars)
The Moonstone plan offers two stories of thoughtful living space. A spacious kitchen provides a panoramic view across the main floor's elegant dining area and an expansive great room. A main-floor bedroom and bathroom and a storage area round out this level. Upstairs, a stunning primary suite offers a roomy walk-in closet and a private bath. A laundry, a loft and three secondary bedrooms can also be found on this floor. Professionally curated fixtures and finishes are included. Visit today!
ⓘ Source: listings_history table (triggers on properties + properties_extension) + one-shot
backfill from property_details.listing_events for pre-trigger history.
Tax reassessment forecast CA · Resets to sale price
- Current annual tax
- $4,164 · $347/mo
- Projected year-2 tax
- $4,864 · $405/mo
- Expected delta
- +$700/yr (+$58/mo · 16.8%)
ⓘ Screening estimate from a state-policy table — verify with the county assessor before closing.
Nearby sold comps map
Loading sold comps map…
Walkable amenities ~0.75 mi
Loading nearby amenities…
Taxation est. · year 1
- Rental income
- $42,728
- − Mortgage interest
- −$35,850
- − Property taxes
- −$4,164
- − Insurance
- −$3,200
- − Repairs & maintenance
- −$3,418
- − Management
- −$3,418
- − Depreciation
- −$18,618
- Taxable loss
- −$25,940
- Est. tax savings @ 24.0%
- +$6,226
- After-tax cash flow
- $-7,658/yr
For passive investors: Depreciation is non-cash, so a rental often shows a tax loss while cash-flowing — sheltering income. Rental losses are passive: they offset passive income freely, and up to $25,000/yr can offset ordinary (W-2) income if you actively participate and your MAGI is under $100k (phasing out to $0 by $150k); unused losses carry forward. On sale, claimed depreciation is recaptured at up to 25%, and gains may owe capital-gains tax (a 1031 exchange can defer both). Figures are a year-1 estimate at your 24.0% rate — not tax advice; consult a CPA.
Schools (NCES district)
- District
- Elk Grove Unified
- NCES district ID
- 0612330
- Math proficiency
- 40% ▼ -5.00%
- Reading proficiency
- 51% ▼ -5.00%
- Median HH income
- $67,860
- Composite
- 40.72/100
- National rank
- #3658
- State rank
- #165 of 517 in CA
Livability — Rancho Cordova
- Score
- 68/100
- State rank
- #268
- US rank
- #9126
Category grades
Schools grade is shown separately in the Schools card above.
Census & demographics
- Census place
- Rancho Cordova, CA
- County
- Sacramento County · 1,539,646 people
- City population
- 98,329
- Metro
- Sacramento-Roseville-Folsom, CA
- Population (ZIP)
- 17,768
- Household income
- $155,855
- Rent vs Own
- Severe rent burden
- 172.0
Population outlook (Sacramento County) Hauer SSP2
- Today (2025)
- 1,660,763 people
- By 2030
- 1,732,990 · +4.3%
- By 2040
- 1,855,755 · +11.7%
- By 2050
- 1,941,335 · +16.9%
- By 2075
- 2,046,162 · +23.2%
- By 2100
- 1,961,444 · +18.1%
Race, ethnicity, and origin ACS 2023
- Neighborhood character
- Highly diverse neighborhood (Simpson 0.72)
- Race & ethnicity
- White 42% Asian 28% Hispanic / Latino 15% Two or more races 13% Black 7%
- Hispanic origin (detail)
- Mexican 11% Puerto Rican 1%
- Common ancestry
- Italian 3% Slovak 2% Subsaharan African 2%
- Foreign-born
- 25% · China, South Korea, Canada
- Languages at home
- 67% English-only · Other Asian/Pacific 7% Other Indo-European 7% Tagalog/Filipino 5%
Political lean MEDSL · Sacramento
- 2024 margin
- D (+19.7) · D 58.1% · R 38.4% · Other 3.5%
- 2008→2024 swing
- +0.7pp no change · 2008: 19.0pp · 2024: 19.7pp
- All cycles
- 2024: D+19.7 2020: D+25.3 2016: D+23.7 2012: D+16.3 2008: D+19.0
Not yet ingested
- Civics
- —
Market trends
- HPI YoY
- ▲ 52.05%
- Current HPI
- 236.1388
- Rent YoY
- ▲ 2.08%
- Metro
- Sacramento-Roseville-Folsom, CA
- State GDP YoY
- ▲ 3.21%
- F500 in state
- 116
Industry mix (Fortune 500 HQ in CA)
| Industry | F500 HQs | Revenue |
|---|---|---|
| Technology | 27 | $1,492B |
|
||
| Financial Services | 3 | $174B |
|
||
| Retail | 3 | $44B |
|
||
| Insurance | 3 | $26B |
|
||
| Media / Entertainment | 2 | $115B |
|
||
| Pharmaceuticals / Biotech | 2 | $62B |
|
||
Price history
-4.0% since first listed5 events — show timeline
- 2026-05-07 Pending — BAREIS
- 2026-04-30 Price Changed $640,000 BAREIS
- 2026-04-07 Price Changed $646,875 BAREIS
- 2026-03-31 Price Changed $656,875 BAREIS
- 2026-03-15 Listed $666,875 BAREIS
Cash-flow waterfall
monthlySold comps — $/sqft
last 12 mo · ≤1 miLoading sold comps…