 🏷️ Likely Rental
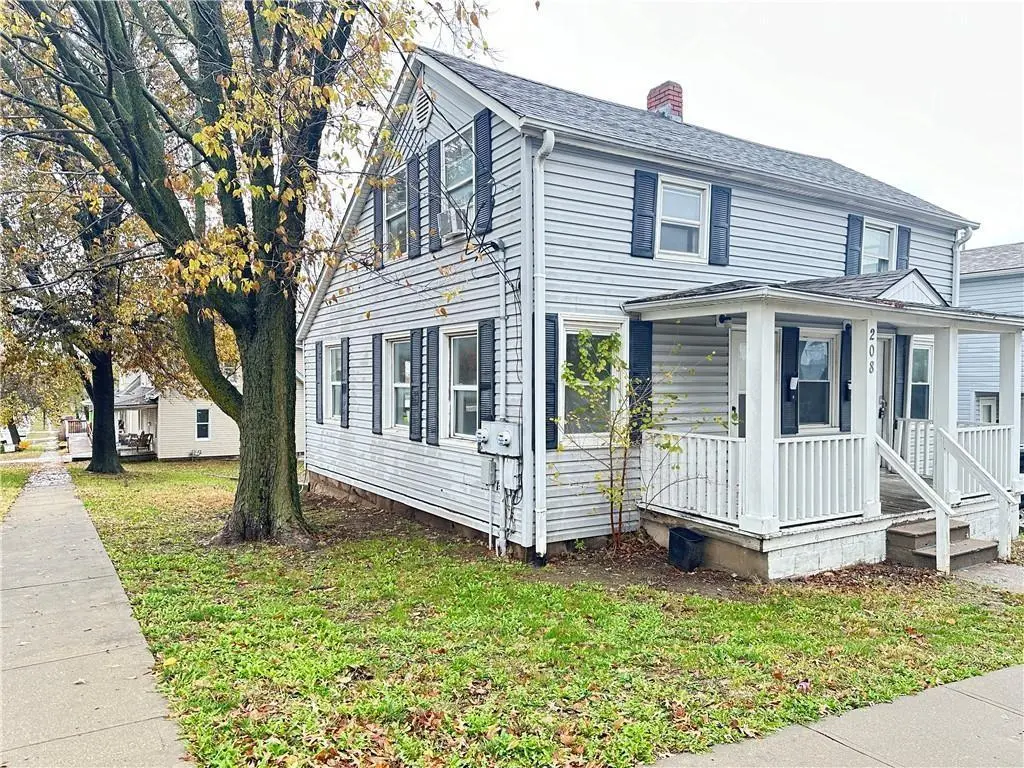
208 S Washington St · Warrensburg, MO
Flood risk 1/10 · Minimal
- FEMA flood zone
- X (unshaded)
- Chance of flooding over 30 yrs
- 0.0%
- Est. flood insurance / yr
- $507 – $1,088
Fire risk 4/10 · Minor
- Est. fire insurance / yr
- $1,054 – $1,958
Heat risk 5/10 · Moderate
- Hot days now (above 109°F)
- 7 days/yr
- Hot days in 30 yrs
- 17 days/yr
Wind risk 2/10 · Minimal
- Chance of severe wind over 30 yrs
- —
Air-quality risk 1/10 · Minimal
- Unhealthy air days now
- 0 days/yr
- Unhealthy air days in 30 yrs
- 0 days/yr
Risk factors via First Street. Map © Google.
Why this score? — see what drove the B- grade
The composite is a weighted blend of 9 inputs, each scored 0–100. Each bar is that input's sub-score; the figure is the points it added to the 100-point composite (weight × sub-score).
- Cash flow +24.4/30.0
- ARV discount +15.0/15.0
- DSCR +7.9/10.0
- 1% rule +5.1/10.0
- Rent growth +4.2/5.0
- Livability +3.7/5.0
- Schools +3.2/10.0
- Condition / age +2.5/5.0
- Appreciation +0.0/10.0
$159,500
🖨 Deal sheet 📄 Offer letter ✓ Due diligence
Listing remarks MLS
Duplex investment opportunity at 208 South Washington in an exceptional location just steps from the University of Central Missouri. Unit A is vacant and features 2 bedrooms and 1 bathroom, making it a great option for an owner-occupant or investor ready to make improvements and build value. Unit A previously rented for $900 per month, offering strong upside potential with updates. Unit B is currently leased at $625 per month through March 2027 and offers immediate income with a 1 bedroom, 1 bathroom layout. This older property does need renovation work, but for the right buyer it presents a chance to add value and grow rental income in a highly desirable area. Property shares a driveway and small parking area with 206 South Washington.
Key facts
- Shares a driveway
- Exceptional location
- 4,966 sq ft lot
Tags
Neighborhood map
What this means for you Summary
Snapshot
- This is a 6-bed/4.0-bath other listed at $160k.
Deal economics
- At list price, monthly cash flow is $324 ($4k/yr) — positive.
- The deal already cash-flows at list — no discount required.
- Meets the 1% rule at list price ($2k rent vs $160k).
- Recommended offer: $145k (9.0% below list) — sets the bar for market timing.
- Cap rate 8.7% vs local median 3.2% in Warrensburg — top-decile yield for the area; either an underpriced asset or a hidden risk that comps aren't pricing in. Stress-test before assuming the spread holds.
Location & tenants
- Location reads 74/100 on livability (#71 in MO, #4,801 nationally) — a middle-class / working-renter tenant base. Strengths: cost of living A+, housing A+, health & safety A; Watch: crime D+, employment D+, commute F.
- Warrensburg R-VI (town): math 30% / reading 45% proficiency, ranked #184 of 324 in MO (top 57%) — families likely to look elsewhere, expect single-tenant / working-renter base with shorter leases.
- Market conditions: Rents rising fast (+6.7%/yr); 270 active listings in the ZIP; 80 units permitted in Johnson County in 2024 (27 in 5+ unit buildings).
- This rent runs 32% of the median local income ($61k/yr) — at the standard rent-burdened threshold; future hikes will face affordability resistance.
Forward outlook
- Local home prices are declining (-3.0%/yr); year-one equity from $1k of loan paydown is wiped out by about $5k of value loss. Plan a longer hold.
- Johnson County population projected at +6% by 2050 — modest demand growth; plan on rents tracking national, not racing it.
- At projected returns (-3.0% appreciation + 6.7% rent growth), your $45k cash investment doubles in ~9 years — after that, you're playing with house money.
Negotiation context
- It's been on market 95 days — a 9% lower offer ($145k) is reasonable based on typical stale-listing flexibility.
- 4 sale attempts since 3y ago with the ask held roughly flat each time — persistent listings suggest the price (not the market) is what's stuck; bring a comps-based counter.
Risks & watch-outs
- Watch-outs: built in 1880 — expect roof / HVAC / electrical / plumbing capex.
- Climate carrying-cost: extreme-heat days projected 7→17/yr by 2055 (HVAC capex compounding) — expect insurance premiums to compound above CPI over the hold.
Questions for the listing agent
- It's been on market 95 days. Have you received any prior offers? Is the seller open to a 9% concession, seller financing, or rate buy-down credit?
- Built in 1880 — when were the roof, HVAC, electrical panel, plumbing, and water heater last replaced?
- Why hasn't it sold? Are there any deal-killer items the seller is aware of (foundation, flood, title, zoning, code violations)?
- Is there a deadline driving the sale (1031 exchange, divorce, estate, relocation)? That informs how much negotiation room exists.
- Schools are B-rated — typically a magnet for longer-tenancy family renters. What's the average tenant stay here, and is there a school-zone premium baked into asking?
- Crime grade is D in this area — have there been break-ins, vandalism, or insurance claims at this property in the last 3 years? What carrier currently insures it and at what premium?
- What's the average days-on-market for RENTAL listings here right now (not sales)? A rising rental-DOM trend means longer vacancies and softer asking-rent achievability than the comps imply.
- What's the recent tenant-quality profile in this submarket — average credit score on applications, eviction rate, late-payment / NSF rate, and stable-employment percentage? A property-management company in the area should have these aggregated.
- How much new for-sale + rental construction is in the pipeline within 1–3 miles? Heavy new supply typically softens prices + rents 12–24 months out; constrained supply supports both.
Investment metrics
- 1% rule
- 1.01% ✓
- Cap rate
- 8.73%
- Cash-on-cash
- 8.72%
- DSCR
- 1.39
- GRM
- 8.2
CMA / ARV
- ARV (median comp)
- $273,561
- List price
- $159,500
- Delta
- -41.69%
- Verdict
- UNDERPRICED
- Comps
- 18 within 1.0 mi
Projected returns pro-forma
-3.0% appreciation · 6.68% rent growth · sell at horizon
- IRR
- 0.5%
- Equity multiple
- 1.02×
- Total profit
- $944
- Equity at exit
- $23,782
- IRR
- 13.3%
- Equity multiple
- 2.22×
- Total profit
- $54,575
- Equity at exit
- $13,791
Cash invested: $44,660 (down + closing). Projections, not guarantees.
Landlord ↔ Tenant lean methodology
- Overall (STATE)
- 81 Strongly Landlord-Friendly
- State Missouri
- 81 Strongly Landlord-Friendly · R+10
- County
- — inherits STATE
- City
- — inherits STATE
ZIP-level market 64093
- Home prices YoY
- -33.4%
- Rents YoY
- 6.7%
- Active inventory
- 270
- Price-to-rent
- 8.2×
Monthly cashflow live
- Estimated rent
- $1,614 medium interval (Pro) →
- Mortgage (P&I)
- −$836
- Tax from tax record
- −$47 /mo · $570/yr
- Insurance
- −$66
- HOA
- −$0
- Vacancy / Maint / Mgmt
- −$339
- Net cashflow
- $324
Break-even live
UW: 25.0% down · 7.5% · 30yr · 1.5% tax · 5.0% vac · 8.0% maint · 8.0% mgmt
Financing live
Cash to close
- Down payment
- $39,875
- Closing costs
- $4,785
- Reserves months
- —
- Total cash needed
- —
Loan-product check · same deal, 3 products live
Conventional
25% down · 7.5% · 30yr
- Down + closing
- —
- Monthly P&I
- —
- Monthly cashflow
- —
- DSCR
- —
- Eligible?
- —
Personal DTI + credit; lowest rate.
DSCR
20% down · 8.5% · 30yr
- Down + closing
- —
- Monthly P&I
- —
- Monthly cashflow
- —
- DSCR
- —
- Eligible?
- —
No personal income docs; deal must DSCR.
Hard money
10% down · 12.0% · 12mo
- Down + closing
- —
- Monthly P&I
- —
- Monthly cashflow
- —
- DSCR
- —
- Eligible?
- —
Short-term bridge; refi at stabilization.
Listing history 29 events
-
2026-06-19days on market $159,500 Active 95 DOM
-
2026-06-18days on market $159,500 Active 94 DOM
-
2026-06-17days on market $159,500 Active 93 DOM
-
2026-06-16days on market $159,500 Active 92 DOM
-
2026-06-15days on market $159,500 Active 91 DOM
-
2026-06-14days on market $159,500 Active 89 DOM
-
2026-06-12days on market $159,500 Active 88 DOM
-
2026-06-09days on market $159,500 Active 85 DOM
-
2026-06-08days on market $159,500 Active 84 DOM
-
2026-06-07days on market $159,500 Active 83 DOM
-
2026-06-03days on market $159,500 Active 79 DOM
-
2026-06-02days on market $159,500 Active 78 DOM
-
2026-06-01days on market $159,500 Active 77 DOM
-
2026-05-31days on market $159,500 Active 76 DOM
-
2026-05-30days on market $159,500 Active 75 DOM
-
2026-03-16$159,500 Active 746-char remark
Show marketing remark (746 chars)
Duplex investment opportunity at 208 South Washington in an exceptional location just steps from the University of Central Missouri. Unit A is vacant and features 2 bedrooms and 1 bathroom, making it a great option for an owner-occupant or investor ready to make improvements and build value. Unit A previously rented for $900 per month, offering strong upside potential with updates. Unit B is currently leased at $625 per month through March 2027 and offers immediate income with a 1 bedroom, 1 bathroom layout. This older property does need renovation work, but for the right buyer it presents a chance to add value and grow rental income in a highly desirable area. Property shares a driveway and small parking area with 206 South Washington.
-
2026-03-14historical
-
2026-03-13$135,000 Active
-
2024-12-18historical
-
2024-11-24price $205,900
-
2024-11-14price $219,000
-
2024-11-11price $229,000
-
2024-11-08$244,900 Active
-
2023-08-10soldstatus Closed
-
2023-05-30status Pending
-
2023-05-27price $150,000
-
2023-05-26historical
-
2023-05-24price $175,000
-
2023-05-24$150,000 Active
ⓘ Source: listings_history table (triggers on properties + properties_extension) + one-shot
backfill from property_details.listing_events for pre-trigger history.
Tax reassessment forecast MO · Resets to sale price
- Current annual tax
- $570 · $47/mo
- Projected year-2 tax
- $1,547 · $129/mo
- Expected delta
- +$978/yr (+$81/mo · 171.6%)
ⓘ Screening estimate from a state-policy table — verify with the county assessor before closing.
Climate risk First Street
- Flood 1/10 Low FEMA zone X (unshaded) · 0% chance over 30 yrs
- Wildfire 4/10 Moderate
- Heat 5/10 Major 7 d/yr ≥109°F today · 17 d/yr by 30 yrs out
- Wind 2/10 Low
- Air quality 1/10 Low 0 unhealthy d/yr today · 0 by 30 yrs out
Nearby sold comps map
Loading sold comps map…
Walkable amenities ~0.75 mi
Loading nearby amenities…
Taxation est. · year 1
- Rental income
- $19,364
- − Mortgage interest
- −$8,934
- − Property taxes
- −$570
- − Insurance
- −$798
- − Repairs & maintenance
- −$1,549
- − Management
- −$1,549
- − Depreciation
- −$4,640
- Taxable income
- $1,324
- Est. tax owed @ 24.0%
- −$318
- After-tax cash flow
- $3,575/yr
For passive investors: Depreciation is non-cash, so a rental often shows a tax loss while cash-flowing — sheltering income. Rental losses are passive: they offset passive income freely, and up to $25,000/yr can offset ordinary (W-2) income if you actively participate and your MAGI is under $100k (phasing out to $0 by $150k); unused losses carry forward. On sale, claimed depreciation is recaptured at up to 25%, and gains may owe capital-gains tax (a 1031 exchange can defer both). Figures are a year-1 estimate at your 24.0% rate — not tax advice; consult a CPA.
Schools (NCES district)
- District
- Warrensburg R-VI
- NCES district ID
- 2931020
- Math proficiency
- 30% ▼ -11.00%
- Reading proficiency
- 45% ▼ -11.00%
- Median HH income
- $43,760
- Composite
- 31.77/100
- National rank
- #5895
- State rank
- #184 of 324 in MO
Livability — Warrensburg
- Score
- 74/100
- State rank
- #71
- US rank
- #4801
Category grades
Schools grade is shown separately in the Schools card above.
Census & demographics
- Census place
- Warrensburg, MO
- County
- Johnson County · 34,718 people
- City population
- 28,199
- Metro
- Warrensburg, MO
- Population (ZIP)
- 28,199
- Household income
- $61,094
- Rent vs Own
- Severe rent burden
- 855.0
Population outlook (Johnson County) Hauer SSP2
- Today (2025)
- 55,794 people
- By 2030
- 56,861 · +1.9%
- By 2040
- 58,239 · +4.4%
- By 2050
- 59,168 · +6.0%
- By 2075
- 62,222 · +11.5%
- By 2100
- 60,118 · +7.7%
Race, ethnicity, and origin ACS 2023
- Neighborhood character
- Predominantly White (84%)
- Race & ethnicity
- White 84% Two or more races 5% Hispanic / Latino 5% Black 4% Asian 2%
- Common ancestry
- Slovak 2% Italian 2% Serbian 2%
- Foreign-born
- 2% · South Korea
- Languages at home
- 95% English-only · Spanish 2% Other Asian/Pacific 1% Other Indo-European 1%
Political lean MEDSL · Johnson
- 2024 margin
- Solid R (+39.6) · D 29.5% · R 69.1% · Other 1.4%
- 2008→2024 swing
- -27.3pp toward R · 2008: -12.2pp · 2024: -39.6pp
- All cycles
- 2024: R+39.6 2020: R+36.8 2016: R+36.9 2012: R+24.2 2008: R+12.2
Not yet ingested
- Civics
- —
Market trends
- HPI YoY
- ▼ -90.22%
- Current HPI
- 179.7251
- Rent YoY
- ▲ 6.68%
- Metro
- Warrensburg, MO
- State GDP YoY
- ▲ 1.84%
- F500 in state
- 20
Industry mix (Fortune 500 HQ in MO)
| Industry | F500 HQs | Revenue |
|---|---|---|
| Healthcare | 1 | $163B |
|
||
| Insurance | 1 | $21B |
|
||
| Industrial Technology | 1 | $17B |
|
||
| Retail | 1 | $16B |
|
||
| Industrial Distribution | 1 | $10B |
|
||
| Utilities | 1 | $9B |
|
||
Price history
+6.3% since first listed14 events — show timeline
- 2026-03-16 Listed $159,500 Heartland MLS as Distributed by MLS Grid
- 2026-03-14 Listing Removed — Heartland MLS as Distributed by MLS Grid
- 2026-03-13 Listed $135,000 Heartland MLS as Distributed by MLS Grid
- 2024-12-18 Listing Removed — Heartland MLS as Distributed by MLS Grid
- 2024-11-24 Price Changed $205,900 Heartland MLS as Distributed by MLS Grid
- 2024-11-14 Price Changed $219,000 Heartland MLS as Distributed by MLS Grid
- 2024-11-11 Price Changed $229,000 Heartland MLS as Distributed by MLS Grid
- 2024-11-08 Listed $244,900 Heartland MLS as Distributed by MLS Grid
- 2023-08-10 Sold (MLS) — Heartland MLS as Distributed by MLS Grid
- 2023-05-30 Pending — Heartland MLS as Distributed by MLS Grid
- 2023-05-27 Price Changed $150,000 Heartland MLS as Distributed by MLS Grid
- 2023-05-26 Rental Removed — RENT.
- 2023-05-24 Price Changed $175,000 Heartland MLS as Distributed by MLS Grid
- 2023-05-24 Listed $150,000 Heartland MLS as Distributed by MLS Grid
Property tax history
+2.8%/yrLatest (2025): $570 · +6.4% YoY. Source: county tax records.
Cash-flow waterfall
monthlySold comps — $/sqft
last 12 mo · ≤1 miLoading sold comps…