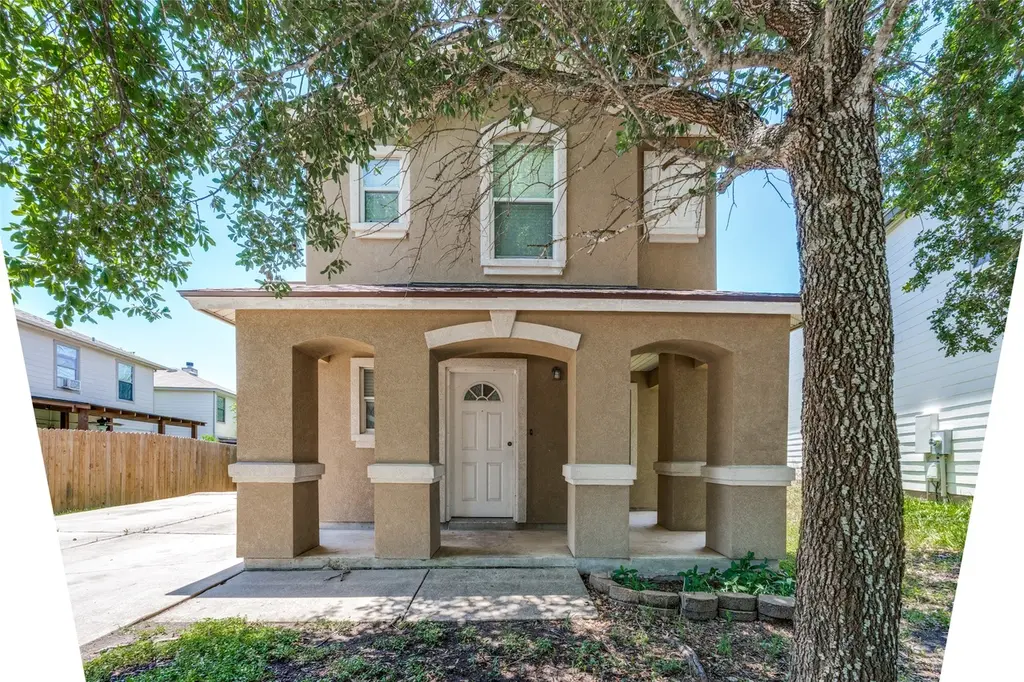
205 Xavier Dr · San Marcos, TX
Flood risk 1/10 · Minimal
- FEMA flood zone
- X (unshaded)
- Chance of flooding over 30 yrs
- 0.0%
- Est. flood insurance / yr
- $507 – $1,088
Fire risk 4/10 · Minor
- Est. fire insurance / yr
- $1,222 – $2,270
Heat risk 8/10 · Major
- Hot days now (above 108°F)
- 7 days/yr
- Hot days in 30 yrs
- 22 days/yr
Wind risk 8/10 · Major
- Chance of severe wind over 30 yrs
- 80.0%
Air-quality risk 1/10 · Minimal
- Unhealthy air days now
- 0 days/yr
- Unhealthy air days in 30 yrs
- 0 days/yr
Risk factors via First Street. Map © Google.
Why this score? — see what drove the D+ grade
The composite is a weighted blend of 9 inputs, each scored 0–100. Each bar is that input's sub-score; the figure is the points it added to the 100-point composite (weight × sub-score).
- ARV discount +15.0/15.0
- Cash flow +11.6/30.0
- 1% rule +4.8/10.0
- Livability +4.0/5.0
- DSCR +3.4/10.0
- Rent growth +3.0/5.0
- Condition / age +2.5/5.0
- Schools +2.0/10.0
- Appreciation +0.0/10.0
$209,999
🖨 Deal sheet 📄 Offer letter ✓ Due diligence
Listing remarks MLS
Move in Ready! Pride in Ownership, meticulously cared for 3 Bdrm 2.5 Bath 4 sided stucco home. Excellent insulation with low electric bills year round. Wrap around front porch. Open concept living/dining/kitchen. Master bedroom has wood floors and garden tub. Convenient upstairs utility room. Oversized covered back patio. 8x12 custom built storage shed. Sprinkler system. Recent 30 yr roof installation (2-3 yrs). Culdesac. Restrictions: Yes Sprinkler Sys:Yes
Key facts
- Storage shed
- Covered back patio
- Mature trees
Tags
Property features AI
Finance
- HOA & community: Part of homeowners association (El Camino Real HOA); HOA fee $250 annually covering common area maintenance; Community features include playground, park, sidewalks, trails/paths, and curbs
Exterior
- Parking: Attached garage with single door (garage faces front); Total 4 parking spaces (1 covered)
- Security: Smoke detector(s)
- Utilities: Electricity available; Public water; Public sewer
- Home design: Two-story residence; Resale property; Faces east; Entry on slab foundation
- Construction: Masonry and stucco construction; Composition roof; Built as recorded in public records
- Exterior features: Covered patio and porch; Porch; Outbuilding / Storage; Privacy wood fencing; Smoke detector(s); Cul-de-sac lot; Level lot; Manual sprinklers; Medium-size trees
Interior
- Kitchen: Dishwasher; Electric cooktop; Free-standing range / Oven; Self-cleaning oven; Garbage disposal; Electric water heater
- Flooring: Carpet; Linoleum; Wood
- Bathrooms: 2 full bathrooms; 1 half bathroom
- Heating & cooling: Central heating; Central air conditioning
- Interior features: High ceilings; Interior steps; Pantry; Walk-in closet(s)
- Laundry & utility: Laundry room on upper level
Neighborhood map
What this means for you Summary
Snapshot
- This is a 3-bed/1.0-bath single-family listed at $210k.
Deal economics
- At list price, monthly cash flow is $-64 ($-771/yr) — negative.
- To cash-flow at today's rent, offer at most $199k (5.4% below list).
- To meet the 1% rule (rent ≥ 1% of price), the offer needs to be $205k (2.3% below list).
- Recommended offer: $199k (5.4% below list) — sets the bar for cash-flow.
- Cap rate 5.9% vs local median 3.1% in San Marcos — top-decile yield for the area; either an underpriced asset or a hidden risk that comps aren't pricing in. Stress-test before assuming the spread holds.
Location & tenants
- Location reads 81/100 on livability (#30 in TX, #1,601 nationally) — a professional / high-income tenant draw. Strengths: amenities A+, cost of living A+, health & safety A+; Watch: crime D+, schools F, employment F.
- San Marcos CISD (rural): math 18% / reading 31% proficiency, ranked #731 of 826 in TX (top 88%) — low school quality limits family demand, transient renter base, plan for 1-2y turnover; 63% free/reduced lunch — lower-income household profile, screen leases tightly.
- Market conditions: Rents rising (+2.0%/yr); 1122 active listings in the ZIP; 33 comparable units currently listed for rent nearby; rentals leasing fast (median 11d on market — plan ~1-2 weeks tenant-placement turnaround); 5,270 units permitted in Hays County in 2024 (1,464 in 5+ unit buildings).
- At $2,053/mo this rent would consume 45% of the median local household income ($55k/yr) (locally 6504% of renters already pay >50% of income on rent) — very limited rent-growth headroom before tenants either downsize or default.
Forward outlook
- Local home prices are declining (-3.0%/yr); year-one equity from $1k of loan paydown is wiped out by about $6k of value loss. Plan a longer hold.
- Hays County population projected at +93% by 2050 — long-run rental-demand tailwind backs the buy-and-hold thesis.
Negotiation context
- It's been on market 20 days — a 2% lower offer ($207k) is reasonable based on typical stale-listing flexibility.
- 4 sale attempts since 11y ago with the ask held roughly flat each time — persistent listings suggest the price (not the market) is what's stuck; bring a comps-based counter.
Risks & watch-outs
- Watch-outs: property tax is 2.7% of price.
- Climate carrying-cost: severe wind risk, 80% chance of damaging wind over 30y; extreme-heat days projected 7→22/yr by 2055 (HVAC capex compounding) — expect insurance premiums to compound above CPI over the hold.
Questions for the listing agent
- What do current leases actually rent for vs. the listed asking? Can we see a recent rent roll and the last 12 months of T-12 income?
- Property tax is high relative to price — has the assessment been appealed recently, and will the sale trigger a re-assessment?
- What does the HOA fee cover, when was the last increase, and are there any pending special assessments or reserve-fund shortfalls?
- Is there a deadline driving the sale (1031 exchange, divorce, estate, relocation)? That informs how much negotiation room exists.
- Schools are F-rated, which usually means shorter tenancies and higher turnover. Who's the typical renter profile here, and what's been the actual vacancy rate?
- Crime grade is D in this area — have there been break-ins, vandalism, or insurance claims at this property in the last 3 years? What carrier currently insures it and at what premium?
- The area grade is low — what's the realistic commute time and amenity access for the typical tenant pool here? Any planned neighborhood developments (good or bad) we should know about?
- What's the average days-on-market for RENTAL listings here right now (not sales)? A rising rental-DOM trend means longer vacancies and softer asking-rent achievability than the comps imply.
- What's the recent tenant-quality profile in this submarket — average credit score on applications, eviction rate, late-payment / NSF rate, and stable-employment percentage? A property-management company in the area should have these aggregated.
- How much new for-sale + rental construction is in the pipeline within 1–3 miles? Heavy new supply typically softens prices + rents 12–24 months out; constrained supply supports both.
Investment metrics
- 1% rule
- 0.98% ✗
- Cap rate
- 5.93%
- Cash-on-cash
- -1.31%
- DSCR
- 0.94
- GRM
- 8.5
CMA / ARV
- ARV (on-the-fly)
- $257,040
- Comps found
- 12
Show comp detail 12 sales within ~0.75 mi
| Address | Dist | Beds/Ba | Sqft | Sold | Price | $/sf | Match |
|---|---|---|---|---|---|---|---|
| 115 Encina Cv | 0.29mi | 3/2.0 | 1,490 (-3%) | 3mo | $229,000 | $154 | 76 |
| 203 Teron Dr | 0.31mi | 3/2.0 | 1,490 (-3%) | 9mo | $245,900 | $165 | 70 |
| 808 Cardenas St | 0.28mi | 3/2.0 | 1,644 (+8%) | 1mo | $305,990 | $186 | 70 |
| 109 Salas Dr | 0.29mi | 4/2.0 (+1) | 1,500 (-2%) | 6mo | $230,000 | $153 | 70 |
| 301 Teron Dr | 0.37mi | 3/2.0 | 1,490 (-3%) | 10mo | $249,900 | $168 | 67 |
| 507 Teron Dr | 0.37mi | 3/2.0 | 1,490 (-3%) | 9mo | $225,000 | $151 | 66 |
| 214 Calixto Ct | 0.09mi | 3/2.0 | 1,364 (-11%) | 10mo | $225,900 | $166 | 66 |
| 168 Cazador Dr | 0.27mi | 3/2.0 | 1,373 (-10%) | 1mo | $238,900 | $174 | 66 |
| 165 Cazador Dr | 0.23mi | 3/2.0 | 1,397 (-9%) | 8mo | $249,900 | $179 | 64 |
| 136 Hazy View Rd | 0.45mi | 3/2.0 | 1,610 (+5%) | 4mo | $289,990 | $180 | 63 |
| 208 Hazy View Rd | 0.46mi | 4/2.0 (+1) | 1,553 (+2%) | 7mo | $324,990 | $209 | 61 |
| 219 Capistrano Dr | 0.12mi | 3/2.0 | 1,332 (-13%) | 11mo | $205,000 | $154 | 60 |
Match score weights: distance 35% · size 25% · config 20% · recency 20%. Top-matched comps best support the ARV.
Projected returns pro-forma
-3.0% appreciation · 1.98% rent growth · sell at horizon
- IRR
- -19.7%
- Equity multiple
- 0.32×
- Total profit
- $-40,029
- Equity at exit
- $31,312
- IRR
- -15.0%
- Equity multiple
- 0.19×
- Total profit
- $-47,795
- Equity at exit
- $18,157
Cash invested: $58,800 (down + closing). Projections, not guarantees.
Landlord ↔ Tenant lean methodology
- Overall (STATE)
- 87 Strongly Landlord-Friendly
- State Texas
- 87 Strongly Landlord-Friendly · R+5
- County
- — inherits STATE
- City
- — inherits STATE
ZIP-level market 78666
- Rents YoY
- 2.0%
- Active inventory
- 1122
- Price-to-rent
- 8.5×
Monthly cashflow live
- Estimated rent
- $2,053 high interval (Pro) →
- Mortgage (P&I)
- −$1,101
- Tax from tax record
- −$476 /mo · $5,713/yr
- Insurance
- −$87
- HOA
- −$21
- Vacancy / Maint / Mgmt
- −$431
- Net cashflow
- $-64
Break-even live
UW: 25.0% down · 7.5% · 30yr · 1.5% tax · 5.0% vac · 8.0% maint · 8.0% mgmt
Financing live
Cash to close
- Down payment
- $52,500
- Closing costs
- $6,300
- Reserves months
- —
- Total cash needed
- —
Loan-product check · same deal, 3 products live
Conventional
25% down · 7.5% · 30yr
- Down + closing
- —
- Monthly P&I
- —
- Monthly cashflow
- —
- DSCR
- —
- Eligible?
- —
Personal DTI + credit; lowest rate.
DSCR
20% down · 8.5% · 30yr
- Down + closing
- —
- Monthly P&I
- —
- Monthly cashflow
- —
- DSCR
- —
- Eligible?
- —
No personal income docs; deal must DSCR.
Hard money
10% down · 12.0% · 12mo
- Down + closing
- —
- Monthly P&I
- —
- Monthly cashflow
- —
- DSCR
- —
- Eligible?
- —
Short-term bridge; refi at stabilization.
Rent comps 33 comps
| Address | Beds | Baths | Sqft | Rent | $/sqft | DOM | Units | Dist |
|---|---|---|---|---|---|---|---|---|
| 284 Cordero Dr San Marcos, TX | 3.0 | 2.5 | 2004 | $3,465 | $1.73 | 10d | 1 | 0.08mi |
| 224 Capistrano Dr San Marcos, TX | 4.0 | 2.0 | 1495 | $2,150 | $1.44 | 43d | 1 | 0.11mi |
| 101 Salas Dr San Marcos, TX | 3.0 | 2.0 | 1132 | $1,700 | $1.50 | 12d | 1 | 0.24mi |
| 210 Teron Dr San Marcos, TX | 3.0 | 2.0 | 1490 | $1,709 | $1.15 | 2d | 1 | 0.30mi |
| 417 Capistrano Dr San Marcos, TX | 3.0 | 2.0 | 1354 | $1,850 | $1.37 | 17d | 1 | 0.34mi |
| 409 Teron Dr San Marcos, TX | 3.0 | 2.0 | 1373 | $1,775 | $1.29 | 17d | 1 | 0.36mi |
| 3085 N State Highway 123 San Marcos, TX | 1.0–4.0 | 1.0–2.5 | 948 | $1,352 | $1.43 | 1d | 15 | 0.45mi |
| 834 Cottonwood Pkwy San Marcos, TX | 3.0 | 1.0–2.0 | 838 | $1,829 | $2.18 | 1d | 53 | 0.51mi |
| 261 Elk Ave San Marcos, TX | 3.0 | 2.0 | 1682 | $1,925 | $1.14 | 7d | 1 | 0.94mi |
| 326 Wild Plum San Marcos, TX | 3.0 | 2.5 | 1723 | $1,850 | $1.07 | 43d | 1 | 0.99mi |
| 1271 Sadler Dr San Marcos, TX | 1.0–2.0 | 1.0–2.0 | 900 | $1,511 | $1.68 | 2d | 20 | 1.07mi |
| 213 Hoya Ln San Marcos, TX | 3.0 | 2.0 | 1400 | $1,700 | $1.21 | 23d | 1 | 1.12mi |
| 821 Benning San Marcos, TX | 3.0 | 2.5 | 1790 | $1,825 | $1.02 | 17d | 1 | 1.15mi |
| 205 Tallow Trl San Marcos, TX | 4.0 | 2.5 | 2146 | $1,945 | $0.91 | 2d | 1 | 1.21mi |
| 208 Picasso Dr San Marcos, TX | 3.0 | 2.0 | 1120 | $1,650 | $1.47 | 12d | 1 | 1.22mi |
| 1250 Sadler Dr San Marcos, TX | 4.0 | 1.0–4.0 | 923 | $1,059 | $1.15 | 17d | 1 | 1.23mi |
| 117 Linden Ln San Marcos, TX | 3.0 | 2.0 | 1400 | $1,750 | $1.25 | 23d | 1 | 1.23mi |
| 224 Lake Gln San Marcos, TX | 3.0 | 2.0 | 1529 | $1,825 | $1.19 | 19d | 1 | 1.23mi |
| 190 Tallow Trl San Marcos, TX | 4.0 | 2.0 | 1647 | $1,900 | $1.15 | 17d | 1 | 1.24mi |
| 186 Tallow Trl San Marcos, TX | 3.0 | 2.0 | 1462 | $1,888 | $1.29 | 17d | 1 | 1.24mi |
| 114 Cloverleaf St San Marcos, TX | 4.0 | 2.0 | 1420 | $1,995 | $1.40 | 43d | 1 | 1.25mi |
| 1441 Leah Ave San Marcos, TX | 4.0 | 4.0 | 1500 | $512 | $0.34 | 7d | 4 | 1.29mi |
| 1350 Sadler Dr San Marcos, TX | 1.0–3.0 | 1.0–2.0 | 873 | $1,478 | $1.69 | 2d | 10 | 1.30mi |
| 131 Lake Gln San Marcos, TX | 3.0 | 2.5 | 1839 | $1,849 | $1.01 | 43d | 1 | 1.33mi |
| 1301 Leah Ave San Marcos, TX | 1.0–3.0 | 1.0–2.0 | 1016 | $2,259 | $2.22 | 4d | 17 | 1.35mi |
| 1811 Medical Pkwy San Marcos, TX | 1.0–2.0 | 1.0–2.0 | 849 | $1,377 | $1.62 | 2d | 14 | 1.36mi |
| 2380 Staples Rd San Marcos, TX | 1.0–3.0 | 1.0–2.0 | 1053 | $2,279 | $2.16 | 1d | 127 | 1.36mi |
| 128 Shimmering Cv San Marcos, TX | 4.0 | 2.0 | 1544 | $1,890 | $1.22 | 43d | 1 | 1.37mi |
| 133 Whipporwill Ln San Marcos, TX | 4.0 | 2.5 | 1831 | $2,100 | $1.15 | 1d | 1 | 1.37mi |
| 1001 Leah Ave San Marcos, TX | 1.0–2.0 | 1.0–2.0 | 861 | $1,599 | $1.86 | 3d | 17 | 1.42mi |
| 1041 Vervain Rd San Marcos, TX | 1.0–3.0 | 1.0–2.0 | 943 | $1,450 | $1.54 | 1d | 13 | 1.43mi |
| 133 Lily Pond Trl San Marcos, TX | 4.0 | 2.0 | 1739 | $1,795 | $1.03 | 1d | 1 | 1.48mi |
| 153 Roanwood Dr San Marcos, TX | 3.0 | 2.0 | 1535 | $1,825 | $1.19 | 2d | 1 | 1.49mi |
HOA detail
- Monthly dues
- $21 · $252/yr
- Likely covers
- electric
Listing history 13 events
-
2026-06-18days on market $209,999 Active 20 DOM
-
2026-06-17days on market $209,999 Active 19 DOM
-
2026-06-16days on market $209,999 Active 18 DOM
-
2026-06-15days on market $209,999 Active 17 DOM
-
2026-06-13days on market $209,999 Active 15 DOM
-
2026-06-09days on market $209,999 Active 11 DOM
-
2026-06-08days on market $209,999 Active 10 DOM
-
2026-06-07days on market $209,999 Active 9 DOM
-
2026-06-05days on market $209,999 Active 6 DOM
-
2026-06-03days on market $209,999 Active 5 DOM
-
2026-06-02days on market $209,999 Active 4 DOM
-
2026-06-01days on market $209,999 Active 3 DOM
-
2026-05-31days on market $209,999 Active 2 DOM
ⓘ Source: listings_history table (triggers on properties + properties_extension) + one-shot
backfill from property_details.listing_events for pre-trigger history.
Tax reassessment forecast TX · Resets to sale price
- Current annual tax
- $5,713 · $476/mo
- Projected year-2 tax
- $5,713 · $476/mo
- Expected delta
- $0/yr ($0/mo · 0.0%)
ⓘ Screening estimate from a state-policy table — verify with the county assessor before closing.
Climate risk First Street
- Flood 1/10 Low FEMA zone X (unshaded) · 0% chance over 30 yrs
- Wildfire 4/10 Moderate
- Heat 8/10 Severe 7 d/yr ≥108°F today · 22 d/yr by 30 yrs out
- Wind 8/10 Severe 80% chance of damaging wind over 30 yrs
- Air quality 1/10 Low 0 unhealthy d/yr today · 0 by 30 yrs out
Nearby sold comps map
Loading sold comps map…
Walkable amenities ~0.75 mi
Loading nearby amenities…
Taxation est. · year 1
- Rental income
- $24,633
- − Mortgage interest
- −$11,763
- − Property taxes
- −$5,713
- − Insurance
- −$1,050
- − Repairs & maintenance
- −$1,971
- − Management
- −$1,971
- − HOA
- −$252
- − Depreciation
- −$6,109
- Taxable loss
- −$4,196
- Est. tax savings @ 24.0%
- +$1,007
- After-tax cash flow
- $237/yr
For passive investors: Depreciation is non-cash, so a rental often shows a tax loss while cash-flowing — sheltering income. Rental losses are passive: they offset passive income freely, and up to $25,000/yr can offset ordinary (W-2) income if you actively participate and your MAGI is under $100k (phasing out to $0 by $150k); unused losses carry forward. On sale, claimed depreciation is recaptured at up to 25%, and gains may owe capital-gains tax (a 1031 exchange can defer both). Figures are a year-1 estimate at your 24.0% rate — not tax advice; consult a CPA.
Schools (NCES district)
- District
- San Marcos CISD
- NCES district ID
- 4838970
- Math proficiency
- 18% ▼ -16.00%
- Reading proficiency
- 31% ▼ -8.00%
- Median HH income
- $34,538
- Composite
- 20.11/100
- National rank
- #8644
- State rank
- #731 of 826 in TX
Livability — San Marcos
- Score
- 81/100
- State rank
- #30
- US rank
- #1601
Category grades
Schools grade is shown separately in the Schools card above.
Census & demographics
- Census place
- San Marcos, TX
- County
- Hays County · 280,138 people
- City population
- 88,583
- Metro
- Austin-Round Rock-Georgetown, TX
- Population (ZIP)
- 88,583
- Household income
- $54,737
- Rent vs Own
- Severe rent burden
- 6504.0
Population outlook (Hays County) Hauer SSP2
- Today (2025)
- 286,948 people
- By 2030
- 336,923 · +17.4%
- By 2040
- 441,894 · +54.0%
- By 2050
- 553,462 · +92.9%
- By 2075
- 838,261 · +192.1%
- By 2100
- 1,063,658 · +270.7%
Race, ethnicity, and origin ACS 2023
- Neighborhood character
- Diverse neighborhood (Simpson 0.60)
- Race & ethnicity
- White 45% Hispanic / Latino 44% Two or more races 20% Black 5% Asian 2%
- Hispanic origin (detail)
- Mexican 37%
- Common ancestry
- Slovak 2% Lithuanian 2% Italian 1%
- Foreign-born
- 8% · Canada
- Languages at home
- 73% English-only · Spanish 24% Other Indo-European 1%
Political lean MEDSL · Hays
- 2024 margin
- Lean D (+5.7) · D 52.1% · R 46.5% · Other 1.4%
- 2008→2024 swing
- +7.7pp toward D · 2008: -2.0pp · 2024: 5.7pp
- All cycles
- 2024: D+5.7 2020: D+10.8 2016: R+0.9 2012: R+10.4 2008: R+2.0
Not yet ingested
- Civics
- —
Market trends
- HPI YoY
- ▼ -108.27%
- Current HPI
- 187.6679
- Rent YoY
- ▲ 1.98%
- Metro
- Austin-Round Rock-Georgetown, TX
- State GDP YoY
- ▲ 3.95%
- F500 in state
- 110
Industry mix (Fortune 500 HQ in TX)
| Industry | F500 HQs | Revenue |
|---|---|---|
| Energy | 16 | $1,198B |
|
||
| Technology | 5 | $198B |
|
||
| Engineering / Construction | 4 | $72B |
|
||
| Energy Services | 3 | $60B |
|
||
| Utilities | 3 | $41B |
|
||
| Healthcare | 2 | $330B |
|
||
Price history
+28.8% since first listed11 events — show timeline
- 2026-05-29 Listed $209,999 Unlock MLS
- 2015-12-22 Sold (Public Records) — Public Records
- 2015-12-21 Sold (MLS) — CTXMLS
- 2015-12-21 Sold (MLS) — Unlock MLS
- 2015-11-13 Pending — Unlock MLS
- 2015-11-13 Relisted — Unlock MLS
- 2015-11-07 Pending — Unlock MLS
- 2015-10-29 Price Changed $159,900 Unlock MLS
- 2015-10-14 Price Changed $162,000 Unlock MLS
- 2015-10-08 Listed $159,900 CTXMLS
- 2015-10-08 Listed $163,000 Unlock MLS
Property tax history
+5.6%/yrLatest (2025): $5,713 · +2.4% YoY. Source: county tax records.
Cash-flow waterfall
monthlySold comps — $/sqft
last 12 mo · ≤1 miLoading sold comps…