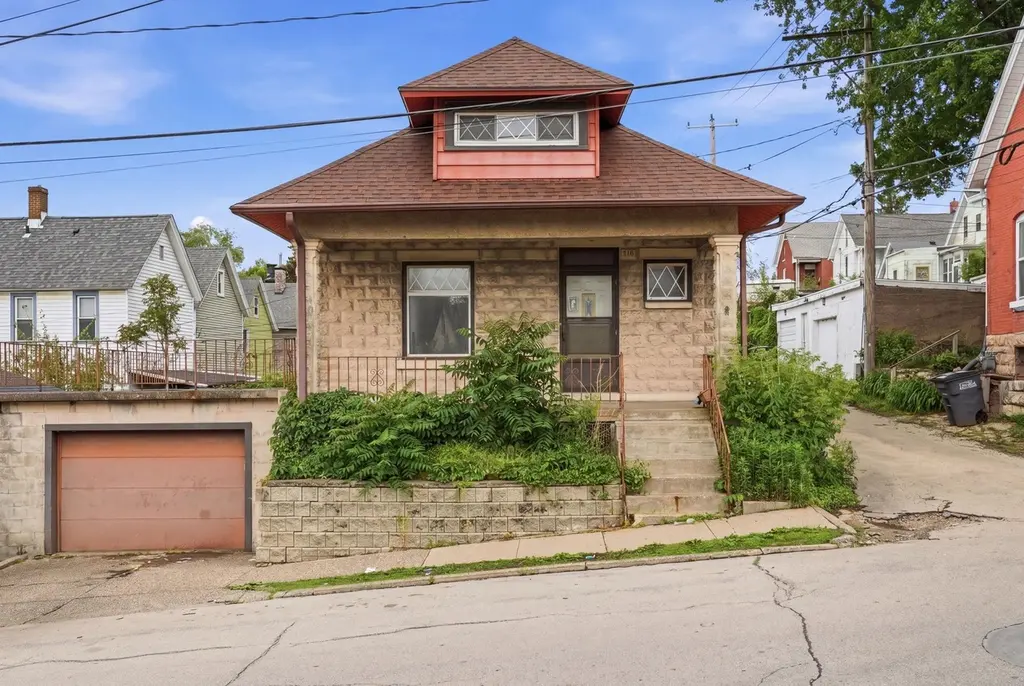
615 E 24th St · Dubuque, IA
Flood risk 8/10 · Major
- FEMA flood zone
- X (unshaded)
- Chance of flooding over 30 yrs
- 0.99%
- Est. flood insurance / yr
- $473 – $860
Fire risk 3/10 · Minor
- Est. fire insurance / yr
- $902 – $1,676
Heat risk 3/10 · Minor
- Hot days now (above 102°F)
- 7 days/yr
- Hot days in 30 yrs
- 15 days/yr
Wind risk 2/10 · Minimal
- Chance of severe wind over 30 yrs
- —
Air-quality risk 2/10 · Minimal
- Unhealthy air days now
- 1 days/yr
- Unhealthy air days in 30 yrs
- 2 days/yr
Risk factors via First Street. Map © Google.
Why this score? — see what drove the B grade
The composite is a weighted blend of 9 inputs, each scored 0–100. Each bar is that input's sub-score; the figure is the points it added to the 100-point composite (weight × sub-score).
- Cash flow +30.0/30.0
- 1% rule +10.0/10.0
- DSCR +10.0/10.0
- ARV discount +7.5/15.0
- Schools +5.5/10.0
- Livability +4.5/5.0
- Rent growth +3.9/5.0
- Condition / age +2.5/5.0
- Appreciation +0.0/10.0
$70,000
🖨 Deal sheet 📄 Offer letter ✓ Due diligence
Listing remarks
Calling all investors, flippers, or buyers ready to roll up their sleeves! This 2-bedroom, 1.5-bath home is full of potential and ready for its next chapter. Whether you're looking for your next project or a chance to create something special, this fixer-upper offers endless possibilities. Ready to bring your vision to life? Contact your agent today for more details or a showing!
Key facts
- Garage
- Built 1924
Property features AI
Exterior
- Parking: Attached garage (1 parking space)
- Utilities: Public water; Public sewer
- Home design: Single-family residence; One and one-half stories; Residential property
- Construction: Block construction; Block foundation
- Exterior features: Deck; Shingle roof
Interior
- Bathrooms: 1 full bathroom; 1 half bathroom
- Heating & cooling: Central air conditioning; Forced air heating
- Interior features: No built-in appliances listed; No fireplace
- Laundry & utility: Laundry located on the upper level; Full basement
Neighborhood map
What this means for you Summary
Snapshot
- This is a 2-bed/1.5-bath single-family listed at $70k.
Deal economics
- At list price, monthly cash flow is $485 ($6k/yr) — positive.
- The deal already cash-flows at list — no discount required.
- Meets the 1% rule at list price ($1k rent vs $70k).
- Cap rate 15.6% vs local median 3.5% in Dubuque — top-decile yield for the area; either an underpriced asset or a hidden risk that comps aren't pricing in. Stress-test before assuming the spread holds.
Location & tenants
- Location reads 89/100 on livability (#7 in IA, #119 nationally) — a professional / high-income tenant draw. Strengths: amenities A+, commute A+, cost of living A+; Watch: crime C-.
- Dubuque Community School District (urban): math 63% / reading 65% proficiency, ranked #205 of 289 in IA (top 71%) — acceptable for families but not a draw, mixed tenant base, ~2y average lease.
- Zoned schools: Audubon Elementary School (math 27% / reading 27%, grade F, #607 of 616 statewide, top 99%, 281 students, 77% FRL); Hempstead High School (math 64% / reading 71%, grade B, #186 of 336 statewide, top 57%, 1,584 students, 38% FRL) — zoned schools average 58% FRL vs 32% district-wide (26 pts higher); higher-poverty schools than district average — tighter screening recommended.
- Zoned-school proficiency averages 47% at this address vs 64% district-wide (-17 pts) — the specific schools serving this property underperform the Dubuque Community School District average; the district grade overstates school quality for this exact location.
- Market conditions: Rents rising fast (+5.6%/yr); 225 active listings in the ZIP; 4 comparable units currently listed for rent nearby; rentals lingering (median 44d on market — plan ~5-8 weeks vacancy on turnover, expect pricing pressure); 100% of comp listings sitting > 30 days — soft ceiling on asking rent; 473 units permitted in Dubuque County in 2024 (319 in 5+ unit buildings).
Forward outlook
- Local home prices are declining (-3.0%/yr); year-one equity from $484 of loan paydown is wiped out by about $2k of value loss. Plan a longer hold.
- Dubuque County population projected at +13% by 2050 — modest demand growth; plan on rents tracking national, not racing it.
- At projected returns (-3.0% appreciation + 5.6% rent growth), your $20k cash investment doubles in ~4 years — after that, you're playing with house money.
Negotiation context
- Only 1 days on market — expect competitive offers; lowballing is unlikely to land.
Risks & watch-outs
- Watch-outs: flood insurance adds $56/mo; built in 1924 — expect roof / HVAC / electrical / plumbing capex.
- Climate carrying-cost: severe flood risk — expect insurance premiums to compound above CPI over the hold.
Questions for the listing agent
- Built in 1924 — when were the roof, HVAC, electrical panel, plumbing, and water heater last replaced?
- What's the actual annual flood-insurance premium (NFIP or private), and is the property in a SFHA with mandatory coverage?
- Is there a deadline driving the sale (1031 exchange, divorce, estate, relocation)? That informs how much negotiation room exists.
- Schools are B-rated — typically a magnet for longer-tenancy family renters. What's the average tenant stay here, and is there a school-zone premium baked into asking?
- What's the average days-on-market for RENTAL listings here right now (not sales)? A rising rental-DOM trend means longer vacancies and softer asking-rent achievability than the comps imply.
- What's the recent tenant-quality profile in this submarket — average credit score on applications, eviction rate, late-payment / NSF rate, and stable-employment percentage? A property-management company in the area should have these aggregated.
- How much new for-sale + rental construction is in the pipeline within 1–3 miles? Heavy new supply typically softens prices + rents 12–24 months out; constrained supply supports both.
Investment metrics
- 1% rule
- 1.93% ✓
- Cap rate
- 15.57%
- Cash-on-cash
- 33.12%
- DSCR
- 2.47
- GRM
- 4.3
CMA / ARV
- ARV (on-the-fly)
- $170,814
- Comps found
- 12
Show comp detail 12 sales within ~0.75 mi
| Address | Dist | Beds/Ba | Sqft | Sold | Price | $/sf | Match |
|---|---|---|---|---|---|---|---|
| 2248 Prince St | 0.12mi | 3/3.0 (+1) | 1,722 (-1%) | 6mo | $173,000 | $100 | 76 |
| 155 W 24 St | 0.34mi | 3/2.0 (+1) | 1,720 (-1%) | 1mo | $85,000 | $49 | 74 |
| 2415 Queen St | 0.05mi | 3/1.0 (+1) | 1,526 (-12%) | 5mo | $78,000 | $51 | 66 |
| 379 Kaufmann Ave | 0.52mi | 3/2.0 (+1) | 1,668 (-4%) | 1mo | $177,500 | $106 | 60 |
| 1567 Elm St | 0.64mi | 3/2.0 (+1) | 1,776 (+2%) | 2mo | $105,000 | $59 | 58 |
| 57 Diagonal St | 0.42mi | 3/1.0 (+1) | 1,524 (-13%) | 0mo | $170,000 | $112 | 52 |
| 2839 Elm St | 0.66mi | 3/2.0 (+1) | 1,650 (-5%) | 2mo | $180,000 | $109 | 52 |
| 365 Kaufmann Ave | 0.51mi | 3/1.5 (+1) | 1,918 (+10%) | 5mo | $160,000 | $83 | 50 |
| 2710 Elm St | 0.47mi | 3/1.5 (+1) | 1,524 (-13%) | 3mo | $180,000 | $118 | 50 |
| 316 Kaufmann Ave | 0.50mi | 3/2.0 (+1) | 1,536 (-12%) | 3mo | $145,000 | $94 | 48 |
| 2915 White St | 0.73mi | 3/1.5 (+1) | 1,648 (-6%) | 6mo | $140,000 | $85 | 47 |
| 523 Kaufmann Ave | 0.66mi | 2/2.0 | 1,528 (-12%) | 2mo | $150,000 | $98 | 46 |
Match score weights: distance 35% · size 25% · config 20% · recency 20%. Top-matched comps best support the ARV.
Projected returns pro-forma
-3.0% appreciation · 5.63% rent growth · sell at horizon
- IRR
- 27.5%
- Equity multiple
- 2.19×
- Total profit
- $23,317
- Equity at exit
- $10,437
- IRR
- 36.8%
- Equity multiple
- 4.89×
- Total profit
- $76,311
- Equity at exit
- $6,052
Cash invested: $19,600 (down + closing). Projections, not guarantees.
Landlord ↔ Tenant lean methodology
- Overall (STATE)
- 83 Strongly Landlord-Friendly
- State Iowa
- 83 Strongly Landlord-Friendly · R+6
- County
- — inherits STATE
- City
- — inherits STATE
ZIP-level market 52001
- Rents YoY
- 5.6%
- Active inventory
- 225
- Price-to-rent
- 4.3×
Monthly cashflow live
- Estimated rent
- $1,350 medium interval (Pro) →
- Mortgage (P&I)
- −$367
- Tax from tax record
- −$129 /mo · $1,548/yr
- Insurance
- −$29
- Flood insurance flood zone
- −$56 /mo · $666/yr
- HOA
- −$0
- Vacancy / Maint / Mgmt
- −$283
- Net cashflow
- $485
Break-even live
UW: 25.0% down · 7.5% · 30yr · 1.5% tax · 5.0% vac · 8.0% maint · 8.0% mgmt
Financing live
Cash to close
- Down payment
- $17,500
- Closing costs
- $2,100
- Reserves months
- —
- Total cash needed
- —
Loan-product check · same deal, 3 products live
Conventional
25% down · 7.5% · 30yr
- Down + closing
- —
- Monthly P&I
- —
- Monthly cashflow
- —
- DSCR
- —
- Eligible?
- —
Personal DTI + credit; lowest rate.
DSCR
20% down · 8.5% · 30yr
- Down + closing
- —
- Monthly P&I
- —
- Monthly cashflow
- —
- DSCR
- —
- Eligible?
- —
No personal income docs; deal must DSCR.
Hard money
10% down · 12.0% · 12mo
- Down + closing
- —
- Monthly P&I
- —
- Monthly cashflow
- —
- DSCR
- —
- Eligible?
- —
Short-term bridge; refi at stabilization.
Rent comps 4 comps
| Address | Beds | Baths | Sqft | Rent | $/sqft | DOM | Units | Dist |
|---|---|---|---|---|---|---|---|---|
| 1501 Central Ave Unit 1513-1 Dubuque, IA | 3.0 | 1.0 | 1374 | $1,175 | $0.86 | 43d | 1 | 0.74mi |
| 333 E 10th St Dubuque, IA | 2.0 | 2.0 | 1530 | $1,750 | $1.14 | 43d | 3 | 0.99mi |
| 823 Hawkeye Dr Dubuque, IA | 2.0 | 1.5 | 1228 | $1,550 | $1.26 | 44d | 1 | 1.31mi |
| 703 Caledonia Pl Dubuque, IA | 3.0 | 1.0 | 1400 | $1,400 | $1.00 | 43d | 1 | 1.43mi |
Listing history 2 events
-
2026-05-21status Pending
-
2026-05-20$70,000 Active
ⓘ Source: listings_history table (triggers on properties + properties_extension) + one-shot
backfill from property_details.listing_events for pre-trigger history.
Tax reassessment forecast IA · Partial reset (capped growth)
- Current annual tax
- $1,548 · $129/mo
- Projected year-2 tax
- $1,548 · $129/mo
- Expected delta
- $0/yr ($0/mo · 0.0%)
ⓘ Screening estimate from a state-policy table — verify with the county assessor before closing.
Climate risk First Street
- Flood 8/10 Severe FEMA zone X (unshaded) · 99% chance over 30 yrs
- Wildfire 3/10 Moderate
- Heat 3/10 Moderate 7 d/yr ≥102°F today · 15 d/yr by 30 yrs out
- Wind 2/10 Low
- Air quality 2/10 Low 1 unhealthy d/yr today · 2 by 30 yrs out
Nearby sold comps map
Loading sold comps map…
Walkable amenities ~0.75 mi
Loading nearby amenities…
Taxation est. · year 1
- Rental income
- $16,195
- − Mortgage interest
- −$3,921
- − Property taxes
- −$1,548
- − Insurance
- −$1,016
- − Repairs & maintenance
- −$1,296
- − Management
- −$1,296
- − Depreciation
- −$2,036
- Taxable income
- $5,082
- Est. tax owed @ 24.0%
- −$1,220
- After-tax cash flow
- $4,605/yr
For passive investors: Depreciation is non-cash, so a rental often shows a tax loss while cash-flowing — sheltering income. Rental losses are passive: they offset passive income freely, and up to $25,000/yr can offset ordinary (W-2) income if you actively participate and your MAGI is under $100k (phasing out to $0 by $150k); unused losses carry forward. On sale, claimed depreciation is recaptured at up to 25%, and gains may owe capital-gains tax (a 1031 exchange can defer both). Figures are a year-1 estimate at your 24.0% rate — not tax advice; consult a CPA.
Schools (NCES district)
- District
- Dubuque Community School District
- NCES district ID
- 1909480
- Math proficiency
- 63% ▼ -7.00%
- Reading proficiency
- 65% ▼ -1.00%
- Median HH income
- $51,237
- Composite
- 54.51/100
- National rank
- #1345
- State rank
- #205 of 289 in IA
Livability — Dubuque
- Score
- 89/100
- State rank
- #7
- US rank
- #119
Category grades
Schools grade is shown separately in the Schools card above.
Census & demographics
- Census place
- Dubuque, IA
- County
- Dubuque County · 60,106 people
- City population
- 60,106
- Metro
- Dubuque, IA
- Population (ZIP)
- 43,101
- Household income
- $61,643
- Rent vs Own
- Severe rent burden
- 1940.0
Population outlook (Dubuque County) Hauer SSP2
- Today (2025)
- 103,359 people
- By 2030
- 106,472 · +3.0%
- By 2040
- 112,043 · +8.4%
- By 2050
- 116,553 · +12.8%
- By 2075
- 128,014 · +23.9%
- By 2100
- 132,892 · +28.6%
Race, ethnicity, and origin ACS 2023
- Neighborhood character
- Predominantly White (84%)
- Race & ethnicity
- White 84% Two or more races 6% Black 5% Hispanic / Latino 4% Asian 1% Pacific Islander 1%
- Common ancestry
- Portuguese 3% Italian 2% Lithuanian 2%
- Foreign-born
- 4% · Canada, China
- Languages at home
- 95% English-only · Spanish 3% Tagalog/Filipino 1% Other Asian/Pacific 1%
Political lean MEDSL · Dubuque
- 2024 margin
- Lean R (+8.6) · D 45.1% · R 53.7% · Other 1.2%
- 2008→2024 swing
- -29.4pp toward R · 2008: 20.8pp · 2024: -8.6pp
- All cycles
- 2024: R+8.6 2020: R+2.9 2016: R+1.2 2012: D+14.5 2008: D+20.8
Not yet ingested
- Civics
- —
Market trends
- HPI YoY
- ▼ -156.36%
- Current HPI
- 173.5536
- Rent YoY
- ▲ 5.63%
- Metro
- Dubuque, IA
- State GDP YoY
- ▲ 2.48%
- F500 in state
- 4
Industry mix (Fortune 500 HQ in IA)
| Industry | F500 HQs | Revenue |
|---|---|---|
| Financial Services | 1 | $16B |
|
||
| Retail / Convenience | 1 | $15B |
|
||
Price history
2 events — show timeline
- 2026-05-21 Pending — ECIMLS
- 2026-05-20 Listed $70,000 ECIMLS
Property tax history
+1.3%/yrLatest (2025): $1,548 · -2.9% YoY. Source: county tax records.
Cash-flow waterfall
monthlySold comps — $/sqft
last 12 mo · ≤1 miLoading sold comps…