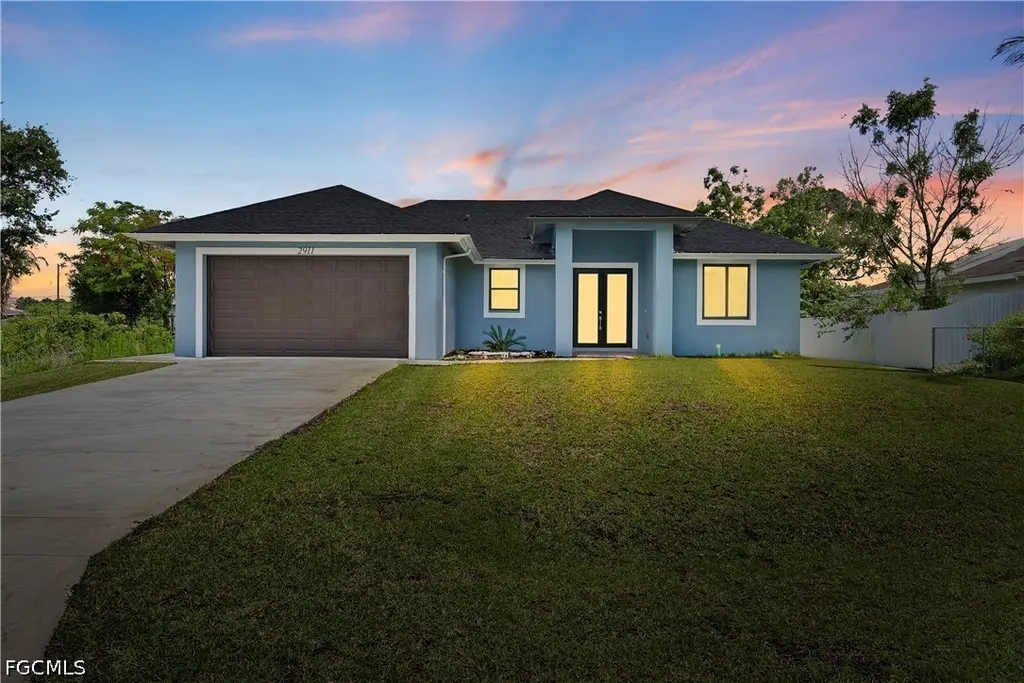
2911 10th St SW · Lehigh Acres, FL
Flood risk 3/10 · Minor
- FEMA flood zone
- X (unshaded)
- Chance of flooding over 30 yrs
- 0.2%
- Est. flood insurance / yr
- $507 – $1,088
Fire risk 1/10 · Minimal
- Est. fire insurance / yr
- $947 – $1,759
Heat risk 9/10 · Severe
- Hot days now (above 107°F)
- 6 days/yr
- Hot days in 30 yrs
- 25 days/yr
Wind risk 10/10 · Severe
- Chance of severe wind over 30 yrs
- 99.0%
Air-quality risk 2/10 · Minimal
- Unhealthy air days now
- 1 days/yr
- Unhealthy air days in 30 yrs
- 1 days/yr
Risk factors via First Street. Map © Google.
Why this score? — see what drove the D+ grade
The composite is a weighted blend of 9 inputs, each scored 0–100. Each bar is that input's sub-score; the figure is the points it added to the 100-point composite (weight × sub-score).
- ARV discount +12.8/15.0
- Appreciation +10.0/10.0
- Cash flow +7.8/30.0
- Schools +4.1/10.0
- Livability +3.0/5.0
- Condition / age +2.5/5.0
- 1% rule +2.1/10.0
- Rent growth +2.1/5.0
- DSCR +1.9/10.0
$299,900
🖨 Deal sheet (PDF) 📄 Offer letter ✓ Due diligence
Listing remarks MLS
1/4 acre Vacant Lot. Adjacent lot is for sale - inquire with your Realtor for details. .. Quite suburban/rural neighborhood. Very close to recreational areas - Great Lot in a Great Location!
Key facts
- Open-concept layout
- Long center island
- 0.25 acre lot
Tags
Property features AI
Finance
- Financial info: Pets allowed
- HOA & community: Non-gated community; No association fee
Exterior
- Parking: Attached 2-car garage
- Security: Security / high-impact doors
- Utilities: Well water; Septic tank; Cable not available
- Home design: Single-story; Entry level 1; North-facing entry; New construction
- Construction: Block, concrete and stucco construction; Shingle roof; New construction
- Exterior features: Security / high-impact doors; Rectangular lot; South exposure; Has view
Interior
- Kitchen: Dishwasher; Microwave; Range; Refrigerator
- Flooring: Tile
- Bathrooms: 2 full bathrooms
- Heating & cooling: Central heating (electric); Central air conditioning (electric)
- Interior features: Impact glass and display windows; Dual sinks; Kitchen island; Separate shower (shower only); Unfurnished
Neighborhood map
What this means for you Summary
Snapshot
- This is a 3-bed/2.0-bath single-family listed at $300k.
Deal economics
- At list price, monthly cash flow is $-331 ($-4k/yr) — negative.
- To cash-flow at today's rent, offer at most $241k (19.5% below list).
- To meet the 1% rule (rent ≥ 1% of price), the offer needs to be $213k (29.0% below list).
- Recommended offer: $213k (29.0% below list) — sets the bar for 1% rule.
Location & tenants
- Location reads 59/100 on livability (#826 in FL) — a working-class tenant base; expect higher turnover. Strengths: cost of living A+, housing A+; Watch: crime C-, employment D+, amenities F.
- Lee (suburban): math 47% / reading 50% proficiency, ranked #42 of 73 in FL (top 58%) — families likely to look elsewhere, expect single-tenant / working-renter base with shorter leases.
- Zoned schools: Veterans Park Academy For The Arts (math 41% / reading 45%, grade F, #1,366 of 2,144 statewide, top 64%, 2,133 students, 36% FRL); Oak Hammock Middle School (math 43% / reading 41%, grade D-, #340 of 571 statewide, top 61%, 1,563 students, 56% FRL); Lehigh Senior High School (math 23% / reading 45%, grade F, #394 of 667 statewide, top 60%, 2,476 students, 57% FRL).
- Market conditions: Rents soft (-1.5%/yr); 788 active listings in the ZIP; 40 comparable units currently listed for rent nearby; rentals at typical pace (median 24d on market — plan ~3-4 weeks tenant-placement turnaround); 15,411 units permitted in Lee County in 2024 (4,686 in 5+ unit buildings).
- This rent runs 35% of the median local income ($73k/yr) — at the standard rent-burdened threshold; future hikes will face affordability resistance.
Forward outlook
- In year one you build about $32k of equity ($2k loan paydown + $30k appreciation (10.0% local appreciation)).
- Lee County population projected at +44% by 2050 — long-run rental-demand tailwind backs the buy-and-hold thesis.
- By year 2, paydown + projected appreciation supports a ~$52k cash-out refi (75% LTV) — recoverable capital for the next deal without selling this one.
Negotiation context
- Only 4 days on market — expect competitive offers; lowballing is unlikely to land.
- 5 sale attempts since 11y ago with the ask held roughly flat each time — persistent listings suggest the price (not the market) is what's stuck; bring a comps-based counter.
- Current owner paid $5k; list at $300k implies a 5898% gain — meaningful room to come down on a strong offer.
Risks & watch-outs
- Climate carrying-cost: severe wind risk, 99% chance of damaging wind over 30y; extreme-heat days projected 6→25/yr by 2055 (HVAC capex compounding) — expect insurance premiums to compound above CPI over the hold.
Questions for the listing agent
- What do current leases actually rent for vs. the listed asking? Can we see a recent rent roll and the last 12 months of T-12 income?
- Is there a deadline driving the sale (1031 exchange, divorce, estate, relocation)? That informs how much negotiation room exists.
- Schools are D-rated, which usually means shorter tenancies and higher turnover. Who's the typical renter profile here, and what's been the actual vacancy rate?
- The area grade is low — what's the realistic commute time and amenity access for the typical tenant pool here? Any planned neighborhood developments (good or bad) we should know about?
- What's the average days-on-market for RENTAL listings here right now (not sales)? A rising rental-DOM trend means longer vacancies and softer asking-rent achievability than the comps imply.
- What's the recent tenant-quality profile in this submarket — average credit score on applications, eviction rate, late-payment / NSF rate, and stable-employment percentage? A property-management company in the area should have these aggregated.
- How much new for-sale + rental construction is in the pipeline within 1–3 miles? Heavy new supply typically softens prices + rents 12–24 months out; constrained supply supports both.
Investment metrics
- 1% rule
- 0.71% ✗
- Cap rate
- 4.97%
- Cash-on-cash
- -4.73%
- DSCR
- 0.79
- GRM
- 11.7
CMA / ARV
- ARV (on-the-fly)
- $340,119
- Comps found
- 12
Show comp detail 12 sales within ~0.75 mi
| Address | Dist | Beds/Ba | Sqft | Sold | Price | $/sf | Match |
|---|---|---|---|---|---|---|---|
| 2906 18th St SW | 0.49mi | 3/2.0 | 1,536 (-0%) | 4mo | $340,000 | $221 | 74 |
| 3206 14th St SW | 0.59mi | 3/2.0 | 1,554 (+1%) | 1mo | $349,900 | $225 | 70 |
| 2919 9th St SW | 0.08mi | 3/2.0 | 1,314 (-15%) | 2mo | $290,000 | $221 | 70 |
| 3000 3rd St SW | 0.47mi | 3/2.0 | 1,630 (+6%) | 1mo | $309,998 | $190 | 67 |
| 2804 1st St W | 0.73mi | 3/2.0 | 1,487 (-3%) | 1mo | $264,097 | $178 | 60 |
| 3215 13th St SW | 0.64mi | 3/2.0 | 1,392 (-10%) | 3mo | $249,900 | $180 | 51 |
| 2721 1st St W | 0.70mi | 3/2.0 | 1,630 (+6%) | 8mo | $322,998 | $198 | 50 |
| 3311 5th St SW | 0.73mi | 3/2.0 | 1,452 (-6%) | 7mo | $339,900 | $234 | 50 |
| 2917 1st St SW | 0.55mi | 3/2.0 | 1,314 (-15%) | 1mo | $300,000 | $228 | 49 |
| 3218 4th St SW | 0.69mi | 4/3.0 (+1) | 1,585 (+3%) | 7mo | $360,000 | $227 | 48 |
| 2916 21st St SW | 0.66mi | 4/2.0 (+1) | 1,426 (-7%) | 7mo | $298,990 | $210 | 46 |
| 2618 4th St SW | 0.67mi | 4/2.0 (+1) | 1,715 (+11%) | 7mo | $375,000 | $219 | 38 |
Match score weights: distance 35% · size 25% · config 20% · recency 20%. Top-matched comps best support the ARV.
Projected returns pro-forma
10.0% appreciation · 0.0% rent growth · sell at horizon
- IRR
- 20.1%
- Equity multiple
- 2.62×
- Total profit
- $135,995
- Equity at exit
- $270,174
- IRR
- 17.8%
- Equity multiple
- 5.83×
- Total profit
- $405,881
- Equity at exit
- $582,640
Cash invested: $83,972 (down + closing). Projections, not guarantees.
Landlord ↔ Tenant lean methodology
- Overall (STATE)
- 87 Strongly Landlord-Friendly
- State Florida
- 87 Strongly Landlord-Friendly · R+3
- County
- — inherits STATE
- City
- — inherits STATE
ZIP-level market 33976
- Home prices YoY
- 6.8%
- Rents YoY
- -1.5%
- Active inventory
- 788
- Price-to-rent
- 11.7×
Monthly cashflow live
- Estimated rent
- $2,131 high interval (Pro) →
- Mortgage (P&I)
- −$1,573
- Tax from tax record
- −$317 /mo · $3,800/yr
- Insurance
- −$125
- HOA
- −$0
- Vacancy / Maint / Mgmt
- −$447
- Net cashflow
- $-331
Break-even live
Sensitivity live
| Price | -10% $-161 | -5% $-246 | +0% $-331 | +5% $-416 | +10% $-501 |
|---|---|---|---|---|---|
| Rent | -10% $-499 | -5% $-415 | +0% $-331 | +5% $-247 | +10% $-163 |
| Rate | -1.0pp $-180 | -0.5pp $-255 | base $-331 | +0.5pp $-409 | +1.0pp $-488 |
UW: 25.0% down · 7.5% · 30yr · 1.5% tax · 5.0% vac · 8.0% maint · 8.0% mgmt
Financing live
Cash to close
- Down payment
- $74,975
- Closing costs
- $8,997
- Reserves months
- —
- Total cash needed
- —
Loan-product check · same deal, 3 products live
Conventional
25% down · 7.5% · 30yr
- Down + closing
- —
- Monthly P&I
- —
- Monthly cashflow
- —
- DSCR
- —
- Eligible?
- —
Personal DTI + credit; lowest rate.
DSCR
20% down · 8.5% · 30yr
- Down + closing
- —
- Monthly P&I
- —
- Monthly cashflow
- —
- DSCR
- —
- Eligible?
- —
No personal income docs; deal must DSCR.
Hard money
10% down · 12.0% · 12mo
- Down + closing
- —
- Monthly P&I
- —
- Monthly cashflow
- —
- DSCR
- —
- Eligible?
- —
Short-term bridge; refi at stabilization.
Rent comps 40 comps
| Address | Beds | Baths | Sqft | Rent | $/sqft | DOM | Units | Dist |
|---|---|---|---|---|---|---|---|---|
| 2916 7th St SW Lehigh Acres, FL | 3.0 | 2.0 | 1357 | $1,900 | $1.40 | 26d | 1 | 0.21mi |
| 2906 14th St SW Lehigh Acres, FL | 3.0 | 2.0 | 1563 | $2,450 | $1.57 | 26d | 1 | 0.22mi |
| 3103 11th St SW Lehigh Acres, FL | 3.0 | 2.0 | 1212 | $1,800 | $1.49 | 26d | 1 | 0.30mi |
| 2909 15th St SW Lehigh Acres, FL | 3.0 | 2.0 | 1291 | $1,800 | $1.39 | 23d | 1 | 0.31mi |
| 2812 4th St SW Lehigh Acres, FL | 3.0 | 2.0 | 1751 | $1,856 | $1.06 | 26d | 1 | 0.44mi |
| 1507 Paula Ave S Lehigh Acres, FL | 3.0 | 2.0 | 1547 | $2,000 | $1.29 | 21d | 1 | 0.56mi |
| 3315 7th St SW Lehigh Acres, FL | 3.0 | 2.0 | 1212 | $1,950 | $1.61 | 26d | 1 | 0.70mi |
| 2805 20th St SW Lehigh Acres, FL | 3.0 | 2.0 | 1151 | $1,699 | $1.48 | 5d | 1 | 0.71mi |
| 2701 20th St SW Lehigh Acres, FL | 3.0 | 2.0 | 2019 | $1,900 | $0.94 | 21d | 1 | 0.78mi |
| 3202 21st St SW Lehigh Acres, FL | 3.0 | 2.0 | 1100 | $1,920 | $1.75 | 5d | 1 | 0.79mi |
| 3008 23rd St SW Lehigh Acres, FL | 3.0 | 2.0 | 1640 | $2,350 | $1.43 | 26d | 1 | 0.80mi |
| 3209 21st St SW Lehigh Acres, FL | 3.0 | 2.0 | 1418 | $1,699 | $1.20 | 5d | 1 | 0.84mi |
| 3402 13th St SW Lehigh Acres, FL | 3.0 | 2.0 | 1117 | $1,940 | $1.74 | 5d | 1 | 0.85mi |
| 2914 24th St SW Lehigh Acres, FL | 3.0 | 2.0 | 1537 | $2,250 | $1.46 | 26d | 1 | 0.86mi |
| 3417 7th St SW Lehigh Acres, FL | 4.0 | 2.0 | 1833 | $1,850 | $1.01 | 12d | 1 | 0.87mi |
| 3408 10th St SW Lehigh Acres, FL | 4.0 | 2.0 | 1385 | $1,850 | $1.34 | 23d | 1 | 0.88mi |
| 3408 10th St SW Lehigh Acres, FL | 4.0 | 2.0 | 1920 | $1,750 | $0.91 | 16d | 1 | 0.88mi |
| 3008 25th St SW Lehigh Acres, FL | 4.0 | 2.0 | 1565 | $1,711 | $1.09 | 23d | 1 | 0.93mi |
| 2811 25th St SW Unit NA Lehigh Acres, FL | 3.0 | 2.0 | 1430 | $1,990 | $1.39 | 26d | 1 | 0.96mi |
| 3201 23rd St SW Lehigh Acres, FL | 3.0 | 2.0 | 1324 | $1,845 | $1.39 | 23d | 1 | 0.97mi |
| 3303 8th St SW Lehigh Acres, FL | 3.0 | 2.0 | 1400 | $2,250 | $1.61 | 5d | 1 | 1.00mi |
| 2602 24th St SW Lehigh Acres, FL | 3.0 | 2.0 | 1358 | $1,800 | $1.33 | 5d | 1 | 1.02mi |
| 3203 24th St SW Lehigh Acres, FL | 3.0 | 2.0 | 1498 | $2,300 | $1.54 | 23d | 1 | 1.03mi |
| 3508 3rd St SW Lehigh Acres, FL | 3.0 | 2.0 | 1147 | $1,699 | $1.48 | 5d | 1 | 1.04mi |
| 209 Punta Alta Ct Lehigh Acres, FL | 4.0 | 2.0 | 1860 | $1,950 | $1.05 | 21d | 1 | 1.05mi |
| 1511 Terry Ave S Lehigh Acres, FL | 3.0 | 2.0 | 1579 | $1,996 | $1.26 | 26d | 1 | 1.06mi |
| 2709 6th St W Lehigh Acres, FL | 4.0 | 3.0 | 1915 | $2,400 | $1.25 | 23d | 1 | 1.09mi |
| 2709 6th St W Lehigh Acres, FL | 4.0 | 3.0 | 1915 | $2,400 | $1.25 | 21d | 1 | 1.09mi |
| 2708 27th St SW Lehigh Acres, FL | 4.0 | 2.0 | 1698 | $2,280 | $1.34 | 5d | 1 | 1.09mi |
| 2902 7th St W Lehigh Acres, FL | 3.0 | 2.0 | 1841 | $2,215 | $1.20 | 16d | 1 | 1.12mi |
| 2902 7th St W Lehigh Acres, FL | 3.0 | 2.0 | 1841 | $2,085 | $1.13 | 4d | 1 | 1.12mi |
| 3405 4th St W Lehigh Acres, FL | 3.0 | 2.0 | 1184 | $1,715 | $1.45 | 16d | 1 | 1.12mi |
| 2710 28th St SW Lehigh Acres, FL | 4.0 | 2.0 | 1742 | $2,450 | $1.41 | 26d | 1 | 1.15mi |
| 312 Grovewood Ave S Lehigh Acres, FL | 2.0 | 2.0 | 1325 | $1,800 | $1.36 | 26d | 1 | 1.15mi |
| 3109 8th St SW Lehigh Acres, FL | 3.0 | 2.0 | 1324 | $1,845 | $1.39 | 23d | 1 | 1.17mi |
| 20699 Hazelnut Ct Lehigh Acres, FL | 2.0 | 2.0 | 1564 | $2,351 | $1.50 | 26d | 1 | 1.18mi |
| 3615 6th St SW Lehigh Acres, FL | 3.0 | 2.0 | 1378 | $1,825 | $1.32 | 26d | 1 | 1.18mi |
| 111 Yellowtail Loop #3 Lehigh Acres, FL | 2.0 | 2.0 | 1100 | $1,750 | $1.59 | 26d | 1 | 1.20mi |
| 20673 Hazelnut Ct Lehigh Acres, FL | 2.0 | 2.0 | 1564 | $2,099 | $1.34 | 26d | 1 | 1.21mi |
| 3600 19th St SW Lehigh Acres, FL | 3.0 | 2.0 | 1114 | $1,746 | $1.57 | 5d | 1 | 1.22mi |
Listing history 3 events
-
2026-06-02statusdays on market $299,900 Pending 4 DOM
-
2026-06-01days on market $299,900 Active 3 DOM
-
2026-05-31days on market $299,900 Active 2 DOM
ⓘ Source: listings_history table (triggers on properties + properties_extension) + one-shot
backfill from property_details.listing_events for pre-trigger history.
Tax reassessment forecast FL · Resets to sale price
- Current annual tax
- $3,800 · $317/mo
- Projected year-2 tax
- $3,800 · $317/mo
- Expected delta
- $0/yr ($0/mo · 0.0%)
ⓘ Screening estimate from a state-policy table — verify with the county assessor before closing.
Climate risk First Street
- Flood 3/10 Moderate FEMA zone X (unshaded) · 20% chance over 30 yrs
- Wildfire 1/10 Low
- Heat 9/10 Extreme 6 d/yr ≥107°F today · 25 d/yr by 30 yrs out
- Wind 10/10 Extreme 99% chance of damaging wind over 30 yrs
- Air quality 2/10 Low 1 unhealthy d/yr today · 1 by 30 yrs out
Nearby sold comps map
Loading sold comps map…
Walkable amenities ~0.75 mi
Loading nearby amenities…
Taxation est. · year 1
- Rental income
- $25,567
- − Mortgage interest
- −$16,799
- − Property taxes
- −$3,800
- − Insurance
- −$1,500
- − Repairs & maintenance
- −$2,045
- − Management
- −$2,045
- − Depreciation
- −$8,724
- Taxable loss
- −$9,346
- Est. tax savings @ 24.0%
- +$2,243
- After-tax cash flow
- $-1,731/yr
For passive investors: Depreciation is non-cash, so a rental often shows a tax loss while cash-flowing — sheltering income. Rental losses are passive: they offset passive income freely, and up to $25,000/yr can offset ordinary (W-2) income if you actively participate and your MAGI is under $100k (phasing out to $0 by $150k); unused losses carry forward. On sale, claimed depreciation is recaptured at up to 25%, and gains may owe capital-gains tax (a 1031 exchange can defer both). Figures are a year-1 estimate at your 24.0% rate — not tax advice; consult a CPA.
Schools (NCES district)
- District
- Lee
- NCES district ID
- 1201080
- Math proficiency
- 47% ▼ -11.00%
- Reading proficiency
- 50% ▼ -4.00%
- Median HH income
- $49,518
- Composite
- 41.49/100
- National rank
- #3458
- State rank
- #42 of 73 in FL
Livability — Lehigh Acres
- Score
- 59/100
- State rank
- #826
- US rank
- #20055
Category grades
Schools grade is shown separately in the Schools card above.
Census & demographics
- Census place
- Lehigh Acres, FL
- County
- Lee County · 788,662 people
- City population
- 130,638
- Metro
- Cape Coral-Fort Myers, FL
- Population (ZIP)
- 20,277
- Household income
- $72,679
- Rent vs Own
- Severe rent burden
- 574.0
Population outlook (Lee County) Hauer SSP2
- Today (2025)
- 871,946 people
- By 2030
- 955,468 · +9.6%
- By 2040
- 1,113,587 · +27.7%
- By 2050
- 1,256,891 · +44.1%
- By 2075
- 1,560,270 · +78.9%
- By 2100
- 1,726,848 · +98.0%
Race, ethnicity, and origin ACS 2023
- Neighborhood character
- Diverse neighborhood (Simpson 0.65)
- Race & ethnicity
- Hispanic / Latino 50% Two or more races 30% White 24% Black 20% Asian 3%
- Hispanic origin (detail)
- Mexican 8% Puerto Rican 8% Cuban 18% Dominican 4%
- Common ancestry
- Hispanic 8% Slovak 1% Lithuanian 1%
- Foreign-born
- 35% · Canada, Jamaica, Vietnam
- Languages at home
- 46% English-only · Spanish 43% French/Haitian/Cajun 8% Vietnamese 1%
Political lean MEDSL · Lee
- 2024 margin
- Strong R (+28.4) · D 35.5% · R 63.9%
- 2008→2024 swing
- -18.0pp toward R · 2008: -10.4pp · 2024: -28.4pp
- All cycles
- 2024: R+28.4 2020: R+19.2 2016: R+20.4 2012: R+16.6 2008: R+10.4
Not yet ingested
- Civics
- —
Market trends
- HPI YoY
- ▲ 21.77%
- Current HPI
- 340.4255
- Rent YoY
- ▼ -1.54%
- Metro
- Cape Coral-Fort Myers, FL
- State GDP YoY
- ▲ 3.28%
- F500 in state
- 36
Industry mix (Fortune 500 HQ in FL)
| Industry | F500 HQs | Revenue |
|---|---|---|
| Industrial Technology | 2 | $29B |
|
||
| Insurance | 2 | $17B |
|
||
| Retail | 1 | $60B |
|
||
| Technology Distribution | 1 | $58B |
|
||
| Homebuilding | 1 | $35B |
|
||
| Technology Manufacturing | 1 | $35B |
|
||
Price history
+4698.4% since first listed13 events — show timeline
- 2026-05-29 Listed $299,900 FORTMLS
- 2026-01-29 Listing Removed — FORTMLS
- 2025-07-14 Price Changed $350,000 FORTMLS
- 2025-03-13 Price Changed $390,000 FORTMLS
- 2025-01-05 Listed $415,000 FORTMLS
- 2018-05-09 Sold (MLS) $5,000 FORTMLS
- 2018-04-18 Pending — FORTMLS
- 2018-03-15 Listed $5,000 FORTMLS
- 2018-02-24 Listing Removed — FORTMLS
- 2017-06-12 Price Changed $5,000 FORTMLS
- 2017-03-08 Listed $6,000 FORTMLS
- 2016-06-01 Listing Removed — FORTMLS
- 2015-01-07 Listed $6,250 FORTMLS
Property tax history
+43.8%/yrLatest (2025): $3,800 · +859.8% YoY. Source: county tax records.
Cash-flow waterfall
monthlySold comps — $/sqft
last 12 mo · ≤1 miLoading sold comps…