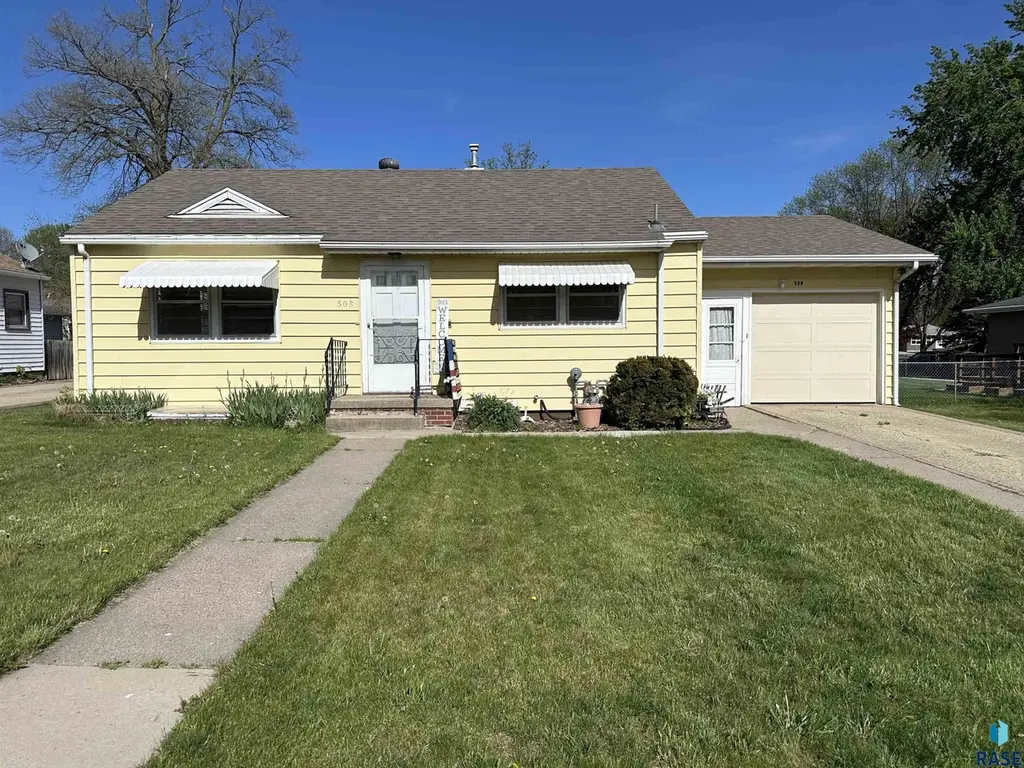
508 N Summit Ave Ave · Madison, SD
Flood risk 1/10 · Minimal
- FEMA flood zone
- X (unshaded)
- Chance of flooding over 30 yrs
- 0.0%
- Est. flood insurance / yr
- $473 – $860
Fire risk 1/10 · Minimal
- Est. fire insurance / yr
- $1,342 – $2,492
Heat risk 2/10 · Minimal
- Hot days now (above 97°F)
- 7 days/yr
- Hot days in 30 yrs
- 14 days/yr
Wind risk 2/10 · Minimal
- Chance of severe wind over 30 yrs
- —
Air-quality risk 2/10 · Minimal
- Unhealthy air days now
- 1 days/yr
- Unhealthy air days in 30 yrs
- 1 days/yr
Risk factors via First Street. Map © Google.
Why this score? — see what drove the D+ grade
The composite is a weighted blend of 9 inputs, each scored 0–100. Each bar is that input's sub-score; the figure is the points it added to the 100-point composite (weight × sub-score).
- ARV discount +15.0/15.0
- Cash flow +11.6/30.0
- Schools +4.1/10.0
- Livability +3.8/5.0
- DSCR +3.4/10.0
- 1% rule +2.5/10.0
- Rent growth +2.5/5.0
- Condition / age +2.5/5.0
- Appreciation +0.0/10.0
$189,900
🖨 Deal sheet 📄 Offer letter ✓ Due diligence
Listing remarks MLS
Super clean move in ready well maintained home. On the outside this home has new shingles, vinyl siding an oversized attached garage as well as a detached garage and a nice yard with alley access. On the interior the home has a nice flow with hardwood floors from the dining and living rooms into the two main level bedrooms. The kitchen adds charm with functionality and has two large viewing widows for nice light! In the lower level there is a finisher room that could be a family room, hobby room, den or guest quarters. Overall this home has a lot to offer and is worth checking out.
Key facts
- Two closets
- Abundant cabinetry
- 7,072 sq ft lot
Tags
Property features AI
Finance
- Financial info: Annual tax amount available
Exterior
- Parking: Attached and detached garage spaces (2 total); Oversized garage; Concrete parking; Garage dimensions: 14x24 and 14x20
- Utilities: Public water; Public sewer
- Home design: Single-family ranch-style home; Above-grade finished area: 768; Below-grade finished area: 242; Below-grade unfinished area: 526; Land is owned
- Construction: Vinyl siding; Poured foundation; Composition roof; Additional buildings on the property
- Exterior features: Deck; Privacy fencing; City lot
Interior
- Kitchen: Electric range; Refrigerator; Kitchen located on the main level (approx. 13 x 8)
- Bedrooms: Main-level master bedroom (13 x 14) with hardwood floor; Main-level second bedroom (11 x 11) with hardwood floor; Basement bedroom (11 x 22)
- Flooring: Hardwood; Wood; Laminate
- Bathrooms: 1 full bathroom; 1 half bathroom
- Heating & cooling: Natural gas heating; Window air conditioning units
- Interior features: Full basement; 7 total rooms; Hardwood floors in living, dining and master bedroom; Wood and laminate flooring
- Laundry & utility: Electric water heater
Neighborhood map
What this means for you Summary
Snapshot
- This is a 2-bed/1.0-bath single-family listed at $190k.
Deal economics
- At list price, monthly cash flow is $-59 ($-702/yr) — negative.
- To cash-flow at today's rent, offer at most $180k (5.4% below list).
- To meet the 1% rule (rent ≥ 1% of price), the offer needs to be $142k (25.0% below list).
- Recommended offer: $142k (25.0% below list) — sets the bar for 1% rule.
- Cap rate 5.9% vs local median 2.8% in Madison — top-decile yield for the area; either an underpriced asset or a hidden risk that comps aren't pricing in. Stress-test before assuming the spread holds.
Location & tenants
- Location reads 75/100 on livability (#26 in SD, #3,922 nationally) — a middle-class / working-renter tenant base. Strengths: crime A+, cost of living A+, housing A+; Watch: amenities F, commute F, health & safety F.
- Madison Central School District 39-2 (town): math 41% / reading 55% proficiency, ranked #36 of 59 in SD (top 61%) — families likely to look elsewhere, expect single-tenant / working-renter base with shorter leases.
- Market conditions: 130 active listings in the ZIP; 4 comparable units currently listed for rent nearby; rentals lingering (median 44d on market — plan ~5-8 weeks vacancy on turnover, expect pricing pressure); 100% of comp listings sitting > 30 days — soft ceiling on asking rent; 35 units permitted in Lake County in 2024 (0 in 5+ unit buildings).
Forward outlook
- Local home prices are declining (-3.0%/yr); year-one equity from $1k of loan paydown is wiped out by about $6k of value loss. Plan a longer hold.
- Lake County population projected at +32% by 2050 — long-run rental-demand tailwind backs the buy-and-hold thesis.
Negotiation context
- Only 10 days on market — expect competitive offers; lowballing is unlikely to land.
- 2 sale attempts since 11y ago with the ask held roughly flat each time — persistent listings suggest the price (not the market) is what's stuck; bring a comps-based counter.
Risks & watch-outs
- Watch-outs: built in 1950 — expect roof / HVAC / electrical / plumbing capex.
Questions for the listing agent
- What do current leases actually rent for vs. the listed asking? Can we see a recent rent roll and the last 12 months of T-12 income?
- Built in 1950 — when were the roof, HVAC, electrical panel, plumbing, and water heater last replaced?
- Is there a deadline driving the sale (1031 exchange, divorce, estate, relocation)? That informs how much negotiation room exists.
- Schools are B-rated — typically a magnet for longer-tenancy family renters. What's the average tenant stay here, and is there a school-zone premium baked into asking?
- The area grade is low — what's the realistic commute time and amenity access for the typical tenant pool here? Any planned neighborhood developments (good or bad) we should know about?
- What's the average days-on-market for RENTAL listings here right now (not sales)? A rising rental-DOM trend means longer vacancies and softer asking-rent achievability than the comps imply.
- What's the recent tenant-quality profile in this submarket — average credit score on applications, eviction rate, late-payment / NSF rate, and stable-employment percentage? A property-management company in the area should have these aggregated.
- How much new for-sale + rental construction is in the pipeline within 1–3 miles? Heavy new supply typically softens prices + rents 12–24 months out; constrained supply supports both.
Investment metrics
- 1% rule
- 0.75% ✗
- Cap rate
- 5.92%
- Cash-on-cash
- -1.32%
- DSCR
- 0.94
- GRM
- 11.1
CMA / ARV
- ARV (on-the-fly)
- $236,550
- Comps found
- 12
Show comp detail 12 sales within ~0.75 mi
| Address | Dist | Beds/Ba | Sqft | Sold | Price | $/sf | Match |
|---|---|---|---|---|---|---|---|
| 607 NE 3rd St | 0.12mi | 2/1.0 | 1,348 (+8%) | 11mo | $145,000 | $108 | 71 |
| 617 NE 1st St | 0.22mi | 3/2.0 (+1) | 1,240 (-0%) | 12mo | $150,000 | $121 | 70 |
| 515 Division Ave | 0.33mi | 2/2.0 | 1,340 (+8%) | 11mo | $254,000 | $190 | 59 |
| 1117 Cyber Ct Ct | 0.63mi | 3/2.0 (+1) | 1,276 (+2%) | 4mo | $423,800 | $332 | 54 |
| 936 NE 6th St | 0.33mi | 3/1.5 (+1) | 1,115 (-10%) | 11mo | $224,900 | $202 | 51 |
| 415 W Center St W | 0.69mi | 2/1.0 | 1,308 (+5%) | 11mo | $160,000 | $122 | 50 |
| 427 N Division Ave | 0.33mi | 3/1.0 (+1) | 1,092 (-12%) | 15mo | $245,000 | $224 | 46 |
| 520 NW 1st St | 0.75mi | 3/1.0 (+1) | 1,276 (+2%) | 12mo | $83,000 | $65 | 46 |
| 412 S Lincoln Ave Ave | 0.56mi | 3/3.0 (+1) | 1,352 (+9%) | 6mo | $245,000 | $181 | 42 |
| 918 N Washington Ave | 0.37mi | 3/2.0 (+1) | 1,430 (+15%) | 10mo | $236,000 | $165 | 40 |
| 1167 Cyber Ct | 0.68mi | 3/2.0 (+1) | 1,270 (+2%) | 22mo | $417,800 | $329 | 38 |
| 1023 N Heatherwood Ave | 0.73mi | 3/2.0 (+1) | 1,170 (-6%) | 21mo | $420,000 | $359 | 29 |
Match score weights: distance 35% · size 25% · config 20% · recency 20%. Top-matched comps best support the ARV.
Projected returns pro-forma
-3.0% appreciation · 3.0% rent growth · sell at horizon
- IRR
- -18.5%
- Equity multiple
- 0.35×
- Total profit
- $-34,556
- Equity at exit
- $28,315
- IRR
- -11.0%
- Equity multiple
- 0.34×
- Total profit
- $-35,123
- Equity at exit
- $16,419
Cash invested: $53,172 (down + closing). Projections, not guarantees.
Landlord ↔ Tenant lean methodology
- Overall (STATE)
- 83 Strongly Landlord-Friendly
- State South Dakota
- 83 Strongly Landlord-Friendly · R+16
- County
- — inherits STATE
- City
- — inherits STATE
ZIP-level market 57042
- Active inventory
- 130
- Price-to-rent
- 11.1×
Monthly cashflow live
- Estimated rent
- $1,424 medium interval (Pro) →
- Mortgage (P&I)
- −$996
- Tax from tax record
- −$109 /mo · $1,305/yr
- Insurance
- −$79
- HOA
- −$0
- Vacancy / Maint / Mgmt
- −$299
- Net cashflow
- $-59
Break-even live
UW: 25.0% down · 7.5% · 30yr · 1.5% tax · 5.0% vac · 8.0% maint · 8.0% mgmt
Financing live
Cash to close
- Down payment
- $47,475
- Closing costs
- $5,697
- Reserves months
- —
- Total cash needed
- —
Loan-product check · same deal, 3 products live
Conventional
25% down · 7.5% · 30yr
- Down + closing
- —
- Monthly P&I
- —
- Monthly cashflow
- —
- DSCR
- —
- Eligible?
- —
Personal DTI + credit; lowest rate.
DSCR
20% down · 8.5% · 30yr
- Down + closing
- —
- Monthly P&I
- —
- Monthly cashflow
- —
- DSCR
- —
- Eligible?
- —
No personal income docs; deal must DSCR.
Hard money
10% down · 12.0% · 12mo
- Down + closing
- —
- Monthly P&I
- —
- Monthly cashflow
- —
- DSCR
- —
- Eligible?
- —
Short-term bridge; refi at stabilization.
Rent comps 4 comps
| Address | Beds | Baths | Sqft | Rent | $/sqft | DOM | Units | Dist |
|---|---|---|---|---|---|---|---|---|
| 418 8th St SW Madison, SD | 1.0–2.0 | 1.0–2.5 | 1012 | $1,590 | $1.57 | 44d | 1 | 1.02mi |
| 1034 Washington Ave S Madison, SD | 2.0 | 1.0 | 627 | $1,350 | $2.15 | 44d | 1 | 1.04mi |
| 311 8th St SW Madison, SD | 1.0 | 1.0 | 780 | $1,040 | $1.33 | 44d | 1 | 1.07mi |
| 415 SW 8th St Madison, SD | 1.0–2.0 | 1.0–2.0 | 1057 | $1,590 | $1.50 | 44d | 1 | 1.09mi |
Listing history 2 events
-
2026-05-13$189,900 Active
-
2015-10-30$85,000 589-char remark
Show marketing remark (589 chars)
Super clean move in ready well maintained home. On the outside this home has new shingles, vinyl siding an oversized attached garage as well as a detached garage and a nice yard with alley access. On the interior the home has a nice flow with hardwood floors from the dining and living rooms into the two main level bedrooms. The kitchen adds charm with functionality and has two large viewing widows for nice light! In the lower level there is a finisher room that could be a family room, hobby room, den or guest quarters. Overall this home has a lot to offer and is worth checking out.
ⓘ Source: listings_history table (triggers on properties + properties_extension) + one-shot
backfill from property_details.listing_events for pre-trigger history.
Tax reassessment forecast SD · Resets to sale price
- Current annual tax
- $1,305 · $109/mo
- Projected year-2 tax
- $2,488 · $207/mo
- Expected delta
- +$1,183/yr (+$99/mo · 90.6%)
ⓘ Screening estimate from a state-policy table — verify with the county assessor before closing.
Climate risk First Street
- Flood 1/10 Low FEMA zone X (unshaded) · 0% chance over 30 yrs
- Wildfire 1/10 Low
- Heat 2/10 Low 7 d/yr ≥97°F today · 14 d/yr by 30 yrs out
- Wind 2/10 Low
- Air quality 2/10 Low 1 unhealthy d/yr today · 1 by 30 yrs out
Nearby sold comps map
Loading sold comps map…
Walkable amenities ~0.75 mi
Loading nearby amenities…
Taxation est. · year 1
- Rental income
- $17,092
- − Mortgage interest
- −$10,637
- − Property taxes
- −$1,305
- − Insurance
- −$950
- − Repairs & maintenance
- −$1,367
- − Management
- −$1,367
- − Depreciation
- −$5,524
- Taxable loss
- −$4,059
- Est. tax savings @ 24.0%
- +$974
- After-tax cash flow
- $272/yr
For passive investors: Depreciation is non-cash, so a rental often shows a tax loss while cash-flowing — sheltering income. Rental losses are passive: they offset passive income freely, and up to $25,000/yr can offset ordinary (W-2) income if you actively participate and your MAGI is under $100k (phasing out to $0 by $150k); unused losses carry forward. On sale, claimed depreciation is recaptured at up to 25%, and gains may owe capital-gains tax (a 1031 exchange can defer both). Figures are a year-1 estimate at your 24.0% rate — not tax advice; consult a CPA.
Schools (NCES district)
- District
- Madison Central School District 39-2
- NCES district ID
- 4639600
- Math proficiency
- 41% ▼ -8.00%
- Reading proficiency
- 55% ▼ -3.00%
- Median HH income
- $47,304
- Composite
- 40.82/100
- National rank
- #3635
- State rank
- #36 of 59 in SD
Livability — Madison
- Score
- 75/100
- State rank
- #26
- US rank
- #3922
Category grades
Schools grade is shown separately in the Schools card above.
Census & demographics
- Census place
- Madison, SD
- Population (ZIP)
- 7,900
Population outlook (Lake County) Hauer SSP2
- Today (2025)
- 15,062 people
- By 2030
- 16,261 · +8.0%
- By 2040
- 18,290 · +21.4%
- By 2050
- 19,881 · +32.0%
- By 2075
- 23,907 · +58.7%
- By 2100
- 29,664 · +96.9%
Race, ethnicity, and origin ACS 2023
- Neighborhood character
- Predominantly White (92%)
- Race & ethnicity
- White 92% Hispanic / Latino 4% Two or more races 2%
- Common ancestry
- Portuguese 20% Iranian 3% Scottish 2%
- Foreign-born
- 1% · China
- Languages at home
- 98% English-only · German/W. Germanic 1% Spanish 1%
Political lean MEDSL · Lake
- 2024 margin
- Solid R (+31.2) · D 33.5% · R 64.7% · Other 1.9%
- 2008→2024 swing
- -31.8pp toward R · 2008: 0.7pp · 2024: -31.2pp
- All cycles
- 2024: R+31.2 2020: R+27.5 2016: R+25.4 2012: R+11.1 2008: D+0.7
Not yet ingested
- Civics
- —
Market trends
- HPI YoY
- ▼ -111.13%
- Current HPI
- 200.0944
- Rent YoY
- —
- Metro
- —
- State GDP YoY
- ▲ 0.70%
- F500 in state
- 2
Industry mix (Fortune 500 HQ in SD)
| Industry | F500 HQs | Revenue |
|---|---|---|
| Utilities | 1 | $1B |
|
||
Price history
+123.4% since first listed2 events — show timeline
- 2026-05-13 Listed $189,900 REALTOR® Association of the Sioux Empire
- 2015-10-30 Listed $85,000 REALTOR® Association of the Sioux Empire
Property tax history
+2.8%/yrLatest (2025): $1,305 · +4.5% YoY. Source: county tax records.
Cash-flow waterfall
monthlySold comps — $/sqft
last 12 mo · ≤1 miLoading sold comps…