8396 Solfrid Way · Elk Grove, CA
Flood risk No data
- FEMA flood zone
- —
- Chance of flooding over 30 yrs
- —
- Est. flood insurance / yr
- —
Fire risk No data
- Est. fire insurance / yr
- —
Heat risk No data
- Hot days now (above threshold)
- —
- Hot days in 30 yrs
- —
Wind risk No data
- Chance of severe wind over 30 yrs
- —
Air-quality risk No data
- Unhealthy air days now
- —
- Unhealthy air days in 30 yrs
- —
Risk factors via First Street. Map © Google.
Why this score? — see what drove the D grade
The composite is a weighted blend of 9 inputs, each scored 0–100. Each bar is that input's sub-score; the figure is the points it added to the 100-point composite (weight × sub-score).
- ARV discount +11.4/15.0
- Appreciation +10.0/10.0
- Cash flow +5.3/30.0
- Schools +4.1/10.0
- Rent growth +3.6/5.0
- Livability +3.6/5.0
- Condition / age +2.5/5.0
- 1% rule +0.8/10.0
- DSCR +0.0/10.0
$557,388
🖨 Deal sheet 📄 Offer letter ✓ Due diligence
Listing remarks MLS
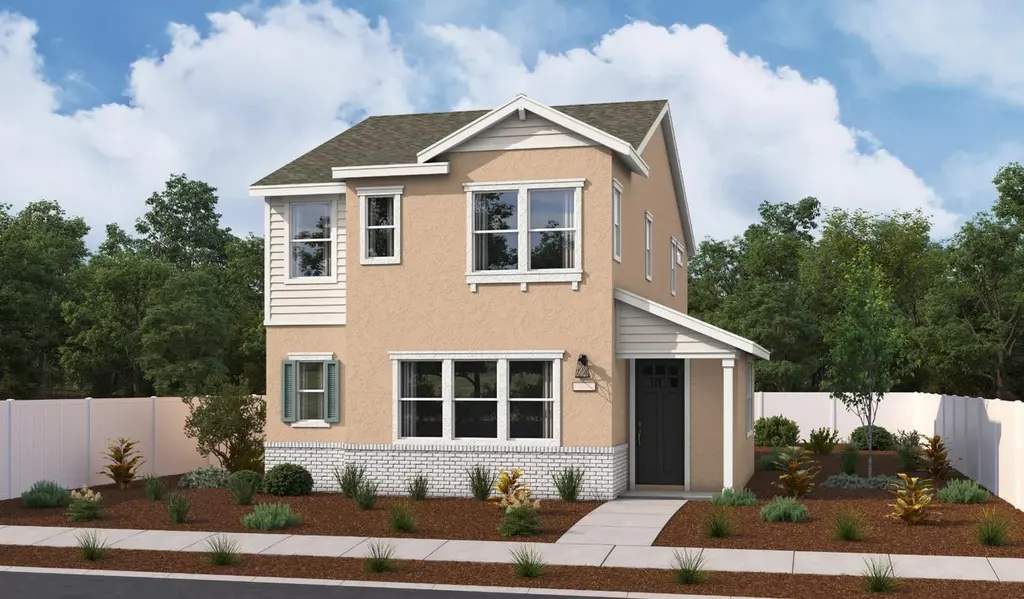
The main floor of the inspired Morello plan boasts a generous great room, an open dining area, and a well-appointed kitchen offering a walk-in pantry and a center island. You'll also appreciate a convenient powder room and a mudroom. Upstairs, discover a laundry, two secondary bedrooms with a shared bath, and a lavish primary suite showcasing a generous walk-in closet and a private bath. Designer-curated fixtures and finishes round out this plan
Key facts
- Open dining area
- Great room
- Center island
Tags
Neighborhood map
What this means for you Summary
Snapshot
- This is a 3-bed/2.5-bath land listed at $557k.
Deal economics
- At list price, monthly cash flow is $-1k ($-15k/yr) — negative.
- To cash-flow at today's rent, offer at most $340k (39.0% below list).
- To meet the 1% rule (rent ≥ 1% of price), the offer needs to be $324k (41.8% below list).
- Recommended offer: $324k (41.8% below list) — sets the bar for 1% rule.
- Cap rate 3.6% vs local median 2.8% in Elk Grove — meaningfully above typical; check what's discounted (condition, days-on-market, listing class) to confirm the premium yield is real.
Location & tenants
- Location reads 71/100 on livability (#212 in CA) — a middle-class / working-renter tenant base. Strengths: employment A+, housing A+, crime B+; Watch: commute F, cost of living F.
- Elk Grove Unified (suburban): math 40% / reading 51% proficiency, ranked #165 of 517 in CA (top 32%) — families likely to look elsewhere, expect single-tenant / working-renter base with shorter leases.
- Market conditions: Rents rising fast (+4.5%/yr); 295 active listings in the ZIP; 29 comparable units currently listed for rent nearby; rentals at typical pace (median 20d on market — plan ~3-4 weeks tenant-placement turnaround); high-income renter base; 6,825 units permitted in Sacramento County in 2024 (1,752 in 5+ unit buildings).
Forward outlook
- In year one you build about $60k of equity ($4k loan paydown + $56k appreciation (10.0% local appreciation)).
- Sacramento County population projected at +17% by 2050 — long-run rental-demand tailwind backs the buy-and-hold thesis.
- By year 2, paydown + projected appreciation supports a ~$96k cash-out refi (75% LTV) — recoverable capital for the next deal without selling this one.
Negotiation context
- It's been on market 45 days — a 3% lower offer ($541k) is reasonable based on typical stale-listing flexibility.
Questions for the listing agent
- What do current leases actually rent for vs. the listed asking? Can we see a recent rent roll and the last 12 months of T-12 income?
- It's been on market 45 days. Have you received any prior offers? Is the seller open to a 42% concession, seller financing, or rate buy-down credit?
- What does the HOA fee cover, when was the last increase, and are there any pending special assessments or reserve-fund shortfalls?
- Is there a deadline driving the sale (1031 exchange, divorce, estate, relocation)? That informs how much negotiation room exists.
- Schools are B-rated — typically a magnet for longer-tenancy family renters. What's the average tenant stay here, and is there a school-zone premium baked into asking?
- The area grade is low — what's the realistic commute time and amenity access for the typical tenant pool here? Any planned neighborhood developments (good or bad) we should know about?
- What's the average days-on-market for RENTAL listings here right now (not sales)? A rising rental-DOM trend means longer vacancies and softer asking-rent achievability than the comps imply.
- What's the recent tenant-quality profile in this submarket — average credit score on applications, eviction rate, late-payment / NSF rate, and stable-employment percentage? A property-management company in the area should have these aggregated.
- How much new for-sale + rental construction is in the pipeline within 1–3 miles? Heavy new supply typically softens prices + rents 12–24 months out; constrained supply supports both.
Investment metrics
- 1% rule
- 0.58% ✗
- Cap rate
- 3.65%
- Cash-on-cash
- -9.45%
- DSCR
- 0.58
- GRM
- 14.3
CMA / ARV
- ARV (median comp)
- $609,778
- List price
- $557,388
- Delta
- -8.59%
- Verdict
- FAIR
- Comps
- 20 within 1.0 mi
Projected returns pro-forma
10.0% appreciation · 4.54% rent growth · sell at horizon
- IRR
- 18.0%
- Equity multiple
- 2.48×
- Total profit
- $230,368
- Equity at exit
- $502,139
- IRR
- 17.1%
- Equity multiple
- 5.81×
- Total profit
- $751,031
- Equity at exit
- $1,082,882
Cash invested: $156,069 (down + closing). Projections, not guarantees.
Landlord ↔ Tenant lean methodology
- Overall (STATE)
- 18 Strongly Tenant-Friendly
- State California
- 18 Strongly Tenant-Friendly · D+13
- County
- — inherits STATE
- City
- — inherits STATE
ZIP-level market 95757
- Home prices YoY
- 13.5%
- Rents YoY
- 4.5%
- Active inventory
- 295
- Price-to-rent
- 14.3×
Monthly cashflow live
- Estimated rent
- $3,244 high interval (Pro) →
- Mortgage (P&I)
- −$2,923
- Tax from tax record
- −$512 /mo · $6,143/yr
- Insurance
- −$232
- HOA
- −$125
- Vacancy / Maint / Mgmt
- −$681
- Net cashflow
- $-1,230
Break-even live
UW: 25.0% down · 7.5% · 30yr · 1.5% tax · 5.0% vac · 8.0% maint · 8.0% mgmt
Financing live
Cash to close
- Down payment
- $139,347
- Closing costs
- $16,722
- Reserves months
- —
- Total cash needed
- —
Loan-product check · same deal, 3 products live
Conventional
25% down · 7.5% · 30yr
- Down + closing
- —
- Monthly P&I
- —
- Monthly cashflow
- —
- DSCR
- —
- Eligible?
- —
Personal DTI + credit; lowest rate.
DSCR
20% down · 8.5% · 30yr
- Down + closing
- —
- Monthly P&I
- —
- Monthly cashflow
- —
- DSCR
- —
- Eligible?
- —
No personal income docs; deal must DSCR.
Hard money
10% down · 12.0% · 12mo
- Down + closing
- —
- Monthly P&I
- —
- Monthly cashflow
- —
- DSCR
- —
- Eligible?
- —
Short-term bridge; refi at stabilization.
Rent comps 29 comps
| Address | Beds | Baths | Sqft | Rent | $/sqft | DOM | Units | Dist |
|---|---|---|---|---|---|---|---|---|
| 8376 Solfrid Way Elk Grove, CA | 4.0 | 3.0 | 2070 | $3,200 | $1.55 | 17d | 1 | 0.05mi |
| 8357 Eleodoro Way Elk Grove, CA | 3.0 | 2.5 | 1730 | $3,245 | $1.88 | 2d | 1 | 0.08mi |
| 8357 Luan Way Elk Grove, CA | 3.0 | 2.0 | 1967 | $2,895 | $1.47 | 19d | 1 | 0.28mi |
| 8403 Sinesky Way Elk Grove, CA | 3.0 | 2.0 | 1579 | $2,995 | $1.90 | 10d | 1 | 0.44mi |
| 10365 Bayson Way Elk Grove, CA | 4.0 | 3.0 | 2018 | $3,300 | $1.64 | 20d | 1 | 0.45mi |
| 10365 Bayson Way Elk Grove, CA | 4.0 | 3.0 | 2018 | $3,300 | $1.64 | 21d | 1 | 0.45mi |
| 10114 Elise Way Elk Grove, CA | 4.0 | 3.0 | 2214 | $2,995 | $1.35 | 7d | 1 | 0.51mi |
| 10110 Elise Way Elk Grove, CA | 3.0 | 2.5 | 1628 | $3,300 | $2.03 | 7d | 1 | 0.52mi |
| 8471 Anker Way Elk Grove, CA | 4.0 | 2.5 | 2107 | $3,200 | $1.52 | 23d | 1 | 0.55mi |
| 8008 Poppy Ridge Rd Elk Grove, CA | 4.0 | 3.0 | 2073 | $3,375 | $1.63 | 23d | 1 | 1.03mi |
| 10568 Trill Way Elk Grove, CA | 3.0 | 2.5 | 1815 | $2,900 | $1.60 | 1d | 1 | 1.07mi |
| 10568 Trill Way Elk Grove, CA | 3.0 | 2.5 | 1815 | $2,900 | $1.60 | 2d | 1 | 1.07mi |
| 10371 Bruceville Rd Elk Grove, CA | 2.0 | 3.0 | 1152 | $2,700 | $2.34 | 17d | 1 | 1.26mi |
| 10371 Bruceville Rd Elk Grove, CA | 2.0 | 3.0 | 1152 | $2,700 | $2.34 | 43d | 1 | 1.26mi |
| 10573 Vina Ct Elk Grove, CA | 3.0 | 2.5 | 1449 | $3,299 | $2.28 | 43d | 1 | 1.30mi |
| 10571 Vina Ct Elk Grove, CA | 3.0 | 2.5 | 1322 | $3,149 | $2.38 | 10d | 1 | 1.30mi |
| 10583 Amigos Ct Elk Grove, CA | 3.0 | 2.5 | 1322 | $3,149 | $2.38 | 23d | 1 | 1.31mi |
| 10565 Vina Ct Elk Grove, CA | 3.0 | 2.5 | 1322 | $3,149 | $2.38 | 10d | 1 | 1.31mi |
| 10563 Vina Ct Elk Grove, CA | 3.0 | 2.5 | 1449 | $3,299 | $2.28 | 43d | 1 | 1.31mi |
| 10564 Vina Ct Elk Grove, CA | 3.0 | 2.5 | 1322 | $3,149 | $2.38 | 23d | 1 | 1.31mi |
| 10595 Gato Ct Elk Grove, CA | 3.0 | 2.5 | 1322 | $3,149 | $2.38 | 43d | 1 | 1.31mi |
| 10577 Amigos Ct Elk Grove, CA | 3.0 | 2.5 | 1322 | $3,149 | $2.38 | 43d | 1 | 1.32mi |
| 10516 Paseo Garcia Ct Elk Grove, CA | 3.0 | 2.5 | 1492 | $3,399 | $2.28 | 4d | 1 | 1.32mi |
| 10589 Gato Ct Elk Grove, CA | 3.0 | 2.5 | 1322 | $3,119 | $2.36 | 23d | 1 | 1.32mi |
| 10508 Paseo Garcia Ct Elk Grove, CA | 3.0 | 2.5 | 1492 | $3,389 | $2.27 | 20d | 1 | 1.33mi |
| 10439 Barrena Loop Elk Grove, CA | 2.0–3.0 | 2.5 | 1252 | $3,149 | $2.52 | 1d | 1 | 1.33mi |
| 10191 Gatemont Cir Elk Grove, CA | 3.0 | 2.5 | 1800 | $2,800 | $1.56 | 23d | 1 | 1.35mi |
| 7216 Tavira Ct Elk Grove, CA | 3.0 | 2.0 | 1513 | $2,600 | $1.72 | 43d | 1 | 1.39mi |
| 10087 Emerald Grove Dr Elk Grove, CA | 3.0 | 2.0 | 1354 | $2,575 | $1.90 | 43d | 1 | 1.42mi |
HOA detail
- Monthly dues
- $125 · $1,500/yr
Listing history 2 events
-
2026-05-15status Pending 453-char remark
Show marketing remark (453 chars)
The main floor of the inspired Morello plan boasts a generous great room, an open dining area, and a well-appointed kitchen offering a walk-in pantry and a center island. You'll also appreciate a convenient powder room and a mudroom. Upstairs, discover a laundry, two secondary bedrooms with a shared bath, and a lavish primary suite showcasing a generous walk-in closet and a private bath. Designer-curated fixtures and finishes round out this plan
-
2026-03-31$557,388 Active 453-char remark
Show marketing remark (453 chars)
The main floor of the inspired Morello plan boasts a generous great room, an open dining area, and a well-appointed kitchen offering a walk-in pantry and a center island. You'll also appreciate a convenient powder room and a mudroom. Upstairs, discover a laundry, two secondary bedrooms with a shared bath, and a lavish primary suite showcasing a generous walk-in closet and a private bath. Designer-curated fixtures and finishes round out this plan
ⓘ Source: listings_history table (triggers on properties + properties_extension) + one-shot
backfill from property_details.listing_events for pre-trigger history.
Tax reassessment forecast CA · Resets to sale price
- Current annual tax
- $6,143 · $512/mo
- Projected year-2 tax
- $6,143 · $512/mo
- Expected delta
- $0/yr ($0/mo · 0.0%)
ⓘ Screening estimate from a state-policy table — verify with the county assessor before closing.
Nearby sold comps map
Loading sold comps map…
Walkable amenities ~0.75 mi
Loading nearby amenities…
Taxation est. · year 1
- Rental income
- $38,925
- − Mortgage interest
- −$31,222
- − Property taxes
- −$6,143
- − Insurance
- −$2,787
- − Repairs & maintenance
- −$3,114
- − Management
- −$3,114
- − HOA
- −$1,500
- − Depreciation
- −$16,215
- Taxable loss
- −$25,171
- Est. tax savings @ 24.0%
- +$6,041
- After-tax cash flow
- $-8,715/yr
For passive investors: Depreciation is non-cash, so a rental often shows a tax loss while cash-flowing — sheltering income. Rental losses are passive: they offset passive income freely, and up to $25,000/yr can offset ordinary (W-2) income if you actively participate and your MAGI is under $100k (phasing out to $0 by $150k); unused losses carry forward. On sale, claimed depreciation is recaptured at up to 25%, and gains may owe capital-gains tax (a 1031 exchange can defer both). Figures are a year-1 estimate at your 24.0% rate — not tax advice; consult a CPA.
Schools (NCES district)
- District
- Elk Grove Unified
- NCES district ID
- 0612330
- Math proficiency
- 40% ▼ -5.00%
- Reading proficiency
- 51% ▼ -5.00%
- Median HH income
- $67,860
- Composite
- 40.72/100
- National rank
- #3658
- State rank
- #165 of 517 in CA
Livability — Elk Grove
- Score
- 71/100
- State rank
- #212
- US rank
- #6681
Category grades
Schools grade is shown separately in the Schools card above.
Census & demographics
- Census place
- Elk Grove, CA
- County
- Sacramento County · 1,539,646 people
- City population
- 190,119
- Metro
- Sacramento-Roseville-Folsom, CA
- Population (ZIP)
- 56,764
- Household income
- $138,198
- Rent vs Own
- Severe rent burden
- 1121.0
Population outlook (Sacramento County) Hauer SSP2
- Today (2025)
- 1,660,763 people
- By 2030
- 1,732,990 · +4.3%
- By 2040
- 1,855,755 · +11.7%
- By 2050
- 1,941,335 · +16.9%
- By 2075
- 2,046,162 · +23.2%
- By 2100
- 1,961,444 · +18.1%
Race, ethnicity, and origin ACS 2023
- Neighborhood character
- Highly diverse neighborhood (Simpson 0.75)
- Race & ethnicity
- Asian 40% White 21% Hispanic / Latino 18% Two or more races 14% Black 11% Pacific Islander 1%
- Hispanic origin (detail)
- Mexican 14%
- Common ancestry
- Russian 1% Italian 1% Portuguese 1%
- Foreign-born
- 28% · China, Canada, Vietnam
- Languages at home
- 62% English-only · Spanish 8% Other Indo-European 7% Chinese 7%
Political lean MEDSL · Sacramento
- 2024 margin
- D (+19.7) · D 58.1% · R 38.4% · Other 3.5%
- 2008→2024 swing
- +0.7pp no change · 2008: 19.0pp · 2024: 19.7pp
- All cycles
- 2024: D+19.7 2020: D+25.3 2016: D+23.7 2012: D+16.3 2008: D+19.0
Not yet ingested
- Civics
- —
Market trends
- HPI YoY
- ▲ 39.15%
- Current HPI
- 328.5885
- Rent YoY
- ▲ 4.54%
- Metro
- Sacramento-Roseville-Folsom, CA
- State GDP YoY
- ▲ 3.21%
- F500 in state
- 116
Industry mix (Fortune 500 HQ in CA)
| Industry | F500 HQs | Revenue |
|---|---|---|
| Technology | 27 | $1,492B |
|
||
| Financial Services | 3 | $174B |
|
||
| Retail | 3 | $44B |
|
||
| Insurance | 3 | $26B |
|
||
| Media / Entertainment | 2 | $115B |
|
||
| Pharmaceuticals / Biotech | 2 | $62B |
|
||
Price history
2 events — show timeline
- 2026-05-15 Pending — BAREIS
- 2026-03-31 Listed $557,388 BAREIS
Property tax history
+28.6%/yrLatest (2025): $6,143 · +28.6% YoY. Source: county tax records.
Cash-flow waterfall
monthlySold comps — $/sqft
last 12 mo · ≤1 miLoading sold comps…