 🏗️ New Construction
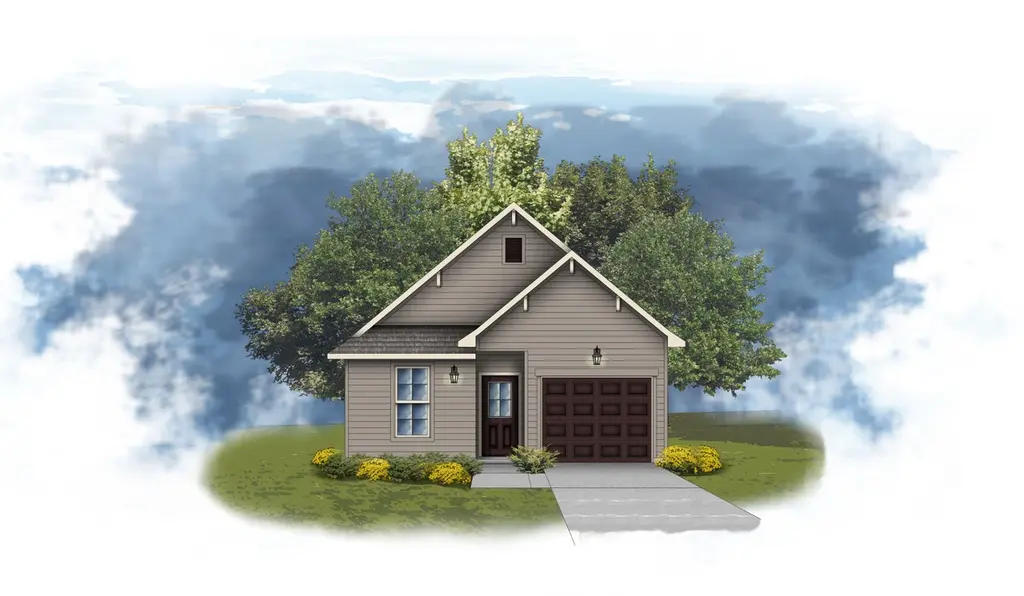
Stags II H Plan · Walker, LA
Flood risk No data
- FEMA flood zone
- —
- Chance of flooding over 30 yrs
- —
- Est. flood insurance / yr
- —
Fire risk No data
- Est. fire insurance / yr
- —
Heat risk No data
- Hot days now (above threshold)
- —
- Hot days in 30 yrs
- —
Wind risk No data
- Chance of severe wind over 30 yrs
- —
Air-quality risk No data
- Unhealthy air days now
- —
- Unhealthy air days in 30 yrs
- —
Risk factors via First Street. Map © Google.
Why this score? — see what drove the D grade
The composite is a weighted blend of 9 inputs, each scored 0–100. Each bar is that input's sub-score; the figure is the points it added to the 100-point composite (weight × sub-score).
- Cash flow +14.2/30.0
- ARV discount +7.5/15.0
- DSCR +4.3/10.0
- 1% rule +4.0/10.0
- Schools +4.0/10.0
- Livability +3.8/5.0
- Rent growth +3.5/5.0
- Condition / age +1.0/5.0
- Appreciation +0.0/10.0
$206,990
🖨 Deal sheet 📄 Offer letter ✓ Due diligence
Listing remarks MLS
Welcome to the Stags II H floor plan by DSLD Homes, designed for those who appreciate spacious living and energy efficiency. With 1,225 square feet of living area, with 3 bedrooms and 2 bathrooms this home provides the ideal layout for families seeking both comfort and style. The open floor plan connects the living, dining, and kitchen areas, creating a bright, airy atmosphere perfect for entertaining or family time. The home's siding exterior offer lasting curb appeal, while the covered rear patio creates an inviting outdoor space for relaxation or outdoor activities. The master suite is a luxurious retreat with a double vanity. . The spacious walk-in master closet offers ample storage space for your wardrobe and accessories. Additional features include a boot bench in the utility room, one-car garage with extra storage, and a floor plan designed for modern living that enhances both convenience and efficiency. With its energy-efficient design, the Stags II H offers lower utility costs while providing a high-quality, comfortable living environment for years to come.
Key facts
- Garage
- Listed 113 days
Neighborhood map
What this means for you Summary
Snapshot
- This is a 3-bed/2.0-bath single-family listed at $207k. Condition is rated poor.
Deal economics
- At list price, monthly cash flow is $34 ($404/yr) — positive.
- The deal already cash-flows at list — no discount required.
- To meet the 1% rule (rent ≥ 1% of price), the offer needs to be $182k (12.3% below list).
- Recommended offer: $182k (12.3% below list) — sets the bar for 1% rule.
- Cap rate 6.5% vs local median 4.8% in Walker — top-decile yield for the area; either an underpriced asset or a hidden risk that comps aren't pricing in. Stress-test before assuming the spread holds.
Location & tenants
- Location reads 75/100 on livability (#19 in LA, #3,999 nationally) — a middle-class / working-renter tenant base. Strengths: cost of living A+, housing A+, health & safety A+; Watch: crime F, amenities D-, commute F.
- Livingston Parish (suburban): math 40% / reading 52% proficiency, ranked #13 of 98 in LA (top 13%) — families likely to look elsewhere, expect single-tenant / working-renter base with shorter leases.
- Market conditions: Rents rising (+3.8%/yr); 976 active listings in the ZIP; 4 comparable units currently listed for rent nearby; rentals lingering (median 44d on market — plan ~5-8 weeks vacancy on turnover, expect pricing pressure); 50% of comp listings sitting > 30 days — soft ceiling on asking rent; solid renter incomes; 794 units permitted in Livingston Parish in 2024 (99 in 5+ unit buildings).
Forward outlook
- Local home prices are declining (-3.0%/yr); year-one equity from $1k of loan paydown is wiped out by about $6k of value loss. Plan a longer hold.
- Livingston County population projected at +27% by 2050 — long-run rental-demand tailwind backs the buy-and-hold thesis.
Negotiation context
- It's been on market 113 days — a 9% lower offer ($188k) is reasonable based on typical stale-listing flexibility.
Questions for the listing agent
- It's been on market 113 days. Have you received any prior offers? Is the seller open to a 12% concession, seller financing, or rate buy-down credit?
- Have any recent inspections been done? Can we get a copy of the seller's disclosures and any deferred-maintenance estimates?
- Why hasn't it sold? Are there any deal-killer items the seller is aware of (foundation, flood, title, zoning, code violations)?
- Is there a deadline driving the sale (1031 exchange, divorce, estate, relocation)? That informs how much negotiation room exists.
- Schools are A-rated — typically a magnet for longer-tenancy family renters. What's the average tenant stay here, and is there a school-zone premium baked into asking?
- Crime grade is F in this area — have there been break-ins, vandalism, or insurance claims at this property in the last 3 years? What carrier currently insures it and at what premium?
- The area grade is low — what's the realistic commute time and amenity access for the typical tenant pool here? Any planned neighborhood developments (good or bad) we should know about?
- What's the average days-on-market for RENTAL listings here right now (not sales)? A rising rental-DOM trend means longer vacancies and softer asking-rent achievability than the comps imply.
- What's the recent tenant-quality profile in this submarket — average credit score on applications, eviction rate, late-payment / NSF rate, and stable-employment percentage? A property-management company in the area should have these aggregated.
- How much new for-sale + rental construction is in the pipeline within 1–3 miles? Heavy new supply typically softens prices + rents 12–24 months out; constrained supply supports both.
Investment metrics
- 1% rule
- 0.90% ✗
- Cap rate
- 6.49%
- Cash-on-cash
- 0.71%
- DSCR
- 1.03
- GRM
- 9.3
CMA / ARV
- ARV (median comp)
- $202,741
- List price
- $206,990
- Delta
- 2.10%
- Verdict
- FAIR
- Comps
- 20 within 1.0 mi
Show comp detail 12 sales within ~0.75 mi
| Address | Dist | Beds/Ba | Sqft | Sold | Price | $/sf | Match |
|---|---|---|---|---|---|---|---|
| 23497 Springhill Dr | 0.08mi | 3/2.0 | 1,196 (-2%) | 22mo | $199,500 | $167 | 74 |
| 23481 Country Manor Ave | 0.03mi | 3/1.5 | 1,203 (-2%) | 23mo | $194,000 | $161 | 74 |
| 23550 Country Manor Ave | 0.19mi | 3/2.0 | 1,189 (-3%) | 18mo | $195,000 | $164 | 71 |
| 23544 Wellington Ave | 0.22mi | 3/1.5 | 1,133 (-8%) | 9mo | $185,000 | $163 | 68 |
| 23562 Country Manor Ave | 0.21mi | 3/2.0 | 1,165 (-5%) | 19mo | $165,000 | $142 | 66 |
| 23482 Country Manor Ave | 0.06mi | 4/2.0 (+1) | 1,398 (+14%) | 13mo | $199,500 | $143 | 58 |
| 23522 Country Manor Ave | 0.13mi | 4/2.0 (+1) | 1,398 (+14%) | 10mo | $199,900 | $143 | 57 |
| 11553 Mary Lee Dr | 0.72mi | 3/2.0 | 1,314 (+7%) | 3mo | $214,900 | $164 | 52 |
| 23800 Stonegate Dr | 0.65mi | 3/2.0 | 1,165 (-5%) | 18mo | $207,000 | $178 | 46 |
| 24578 Rolling Mdw | 0.72mi | 3/2.0 | 1,402 (+14%) | 10mo | $212,000 | $151 | 34 |
| 11536 Mary Lee Dr | 0.74mi | 3/2.0 | 1,370 (+12%) | 18mo | $214,900 | $157 | 31 |
| 11533 Mary Lee Dr | 0.71mi | 3/2.0 | 1,398 (+14%) | 20mo | $200,000 | $143 | 27 |
Match score weights: distance 35% · size 25% · config 20% · recency 20%. Top-matched comps best support the ARV.
Projected returns pro-forma
-3.0% appreciation · 3.83% rent growth · sell at horizon
- IRR
- -14.2%
- Equity multiple
- 0.49×
- Total profit
- $-29,151
- Equity at exit
- $30,229
- IRR
- -4.1%
- Equity multiple
- 0.72×
- Total profit
- $-16,128
- Equity at exit
- $17,529
Cash invested: $56,767 (down + closing). Projections, not guarantees.
Landlord ↔ Tenant lean methodology
- Overall (STATE)
- 90 Strongly Landlord-Friendly
- State Louisiana
- 90 Strongly Landlord-Friendly · R+12
- County
- — inherits STATE
- City
- — inherits STATE
ZIP-level market 70726
- Rents YoY
- 3.8%
- Active inventory
- 976
- Price-to-rent
- 9.5×
Monthly cashflow live
- Estimated rent
- $1,816 medium interval (Pro) →
- Mortgage (P&I)
- −$1,063
- Tax est. 1.5%
- −$253 /mo · $3,041/yr
- Insurance
- −$84
- HOA
- −$0
- Vacancy / Maint / Mgmt
- −$381
- Net cashflow
- $34
Break-even live
UW: 25.0% down · 7.5% · 30yr · 1.5% tax · 5.0% vac · 8.0% maint · 8.0% mgmt
Financing live
Cash to close
- Down payment
- $50,685
- Closing costs
- $6,082
- Reserves months
- —
- Total cash needed
- —
Loan-product check · same deal, 3 products live
Conventional
25% down · 7.5% · 30yr
- Down + closing
- —
- Monthly P&I
- —
- Monthly cashflow
- —
- DSCR
- —
- Eligible?
- —
Personal DTI + credit; lowest rate.
DSCR
20% down · 8.5% · 30yr
- Down + closing
- —
- Monthly P&I
- —
- Monthly cashflow
- —
- DSCR
- —
- Eligible?
- —
No personal income docs; deal must DSCR.
Hard money
10% down · 12.0% · 12mo
- Down + closing
- —
- Monthly P&I
- —
- Monthly cashflow
- —
- DSCR
- —
- Eligible?
- —
Short-term bridge; refi at stabilization.
Rent comps 4 comps
| Address | Beds | Baths | Sqft | Rent | $/sqft | DOM | Units | Dist |
|---|---|---|---|---|---|---|---|---|
| 24585 Fair Weather Dr Denham Springs, LA | 3.0 | 2.0 | 1451 | $1,850 | $1.27 | 43d | 1 | 0.74mi |
| 11402 Ashwood Ct Denham Springs, LA | 3.0 | 2.0 | 1331 | $1,750 | $1.31 | 21d | 1 | 1.16mi |
| 25699 Raines Ave Dennis Mills, LA | 3.0 | 2.0 | 1463 | $1,850 | $1.26 | 43d | 1 | 1.19mi |
| 25699 Raines Ave Dennis Mills, LA | 3.0 | 2.0 | 1463 | $1,850 | $1.26 | 14d | 1 | 1.19mi |
Listing history 15 events
-
2026-06-18days on market $206,990 Active 113 DOM
-
2026-06-17days on market $206,990 Active 112 DOM
-
2026-06-16days on market $206,990 Active 111 DOM
-
2026-06-15days on market $206,990 Active 110 DOM
-
2026-06-14days on market $206,990 Active 108 DOM
-
2026-06-13days on market $206,990 Active 107 DOM
-
2026-06-10days on market $206,990 Active 105 DOM
-
2026-06-08days on market $206,990 Active 103 DOM
-
2026-06-07days on market $206,990 Active 102 DOM
-
2026-06-03days on market $206,990 Active 98 DOM
-
2026-06-02days on market $206,990 Active 97 DOM
-
2026-06-01days on market $206,990 Active 96 DOM
-
2026-05-31days on market $206,990 Active 95 DOM
-
2026-05-31days on market $206,990 Active 94 DOM
-
2026-02-25$206,990 Active 1082-char remark
Show marketing remark (1082 chars)
Welcome to the Stags II H floor plan by DSLD Homes, designed for those who appreciate spacious living and energy efficiency. With 1,225 square feet of living area, with 3 bedrooms and 2 bathrooms this home provides the ideal layout for families seeking both comfort and style. The open floor plan connects the living, dining, and kitchen areas, creating a bright, airy atmosphere perfect for entertaining or family time. The home's siding exterior offer lasting curb appeal, while the covered rear patio creates an inviting outdoor space for relaxation or outdoor activities. The master suite is a luxurious retreat with a double vanity. . The spacious walk-in master closet offers ample storage space for your wardrobe and accessories. Additional features include a boot bench in the utility room, one-car garage with extra storage, and a floor plan designed for modern living that enhances both convenience and efficiency. With its energy-efficient design, the Stags II H offers lower utility costs while providing a high-quality, comfortable living environment for years to come.
ⓘ Source: listings_history table (triggers on properties + properties_extension) + one-shot
backfill from property_details.listing_events for pre-trigger history.
Nearby sold comps map
Loading sold comps map…
Walkable amenities ~0.75 mi
Loading nearby amenities…
Taxation est. · year 1
- Rental income
- $21,794
- − Mortgage interest
- −$11,357
- − Property taxes
- −$3,041
- − Insurance
- −$1,014
- − Repairs & maintenance
- −$1,744
- − Management
- −$1,744
- − Depreciation
- −$5,898
- Taxable loss
- −$3,002
- Est. tax savings @ 24.0%
- +$721
- After-tax cash flow
- $1,125/yr
For passive investors: Depreciation is non-cash, so a rental often shows a tax loss while cash-flowing — sheltering income. Rental losses are passive: they offset passive income freely, and up to $25,000/yr can offset ordinary (W-2) income if you actively participate and your MAGI is under $100k (phasing out to $0 by $150k); unused losses carry forward. On sale, claimed depreciation is recaptured at up to 25%, and gains may owe capital-gains tax (a 1031 exchange can defer both). Figures are a year-1 estimate at your 24.0% rate — not tax advice; consult a CPA.
Condition & rehab AI · 1 photo
This home requires extensive repairs and maintenance, including exterior siding, roof, and interior walls. Significant updates are needed to improve its condition and resale value.
Repairs flagged
- Major exterior siding — Significant wear and possible damage
- Major roof — Aged appearance
- Major interior walls/paint — No visible interior, but the foundation appears stable
- Major bathrooms — No visible bathrooms
- Major kitchen — No visible kitchen
- Major systems — No visible systems
Value-add opportunities
- Resale repair and paint exterior — Enhances curb appeal
- Resale repair and paint interior walls — Improves interior appearance
- Resale repair roof — Fixes a major issue
Renovation cost estimate screening
| Repair item | Severity | Est. cost |
|---|---|---|
| exterior siding · Significant wear and possible damage | Major | $15,000–50,000 |
| roof · Aged appearance | Major | $15,000–50,000 |
| interior walls/paint · No visible interior, but the foundation appears stable | Major | $15,000–50,000 |
| bathrooms · No visible bathrooms | Major | $15,000–50,000 |
| kitchen · No visible kitchen | Major | $15,000–50,000 |
| systems · No visible systems | Major | $15,000–50,000 |
| Total estimated repair cost · 6 items | $90,000–300,000 |
Value-add ROI direction
- Resale repair and paint exterior — Enhances curb appeal ↑
- Resale repair and paint interior walls — Improves interior appearance ↑
- Resale repair roof — Fixes a major issue ↑
ⓘ Cost ranges are severity-bucket heuristics (US national rule-of-thumb). Get contractor quotes + a written scope before underwriting a rehab budget.
Schools (NCES district)
- District
- Livingston Parish
- NCES district ID
- 2201020
- Math proficiency
- 40% ▼ -38.00%
- Reading proficiency
- 52% ▼ -32.00%
- Median HH income
- $56,755
- Composite
- 40.07/100
- National rank
- #3811
- State rank
- #13 of 98 in LA
Livability — Walker
- Score
- 75/100
- State rank
- #19
- US rank
- #3999
Category grades
Schools grade is shown separately in the Schools card above.
Census & demographics
- County
- Livingston Parish · 87,496 people
- City population
- 23,921
- Metro
- Baton Rouge, LA
- Population (ZIP)
- 63,575
- Household income
- $78,621
- Rent vs Own
- Severe rent burden
- 1211.0
Population outlook (Livingston County) Hauer SSP2
- Today (2025)
- 158,511 people
- By 2030
- 168,241 · +6.1%
- By 2040
- 186,252 · +17.5%
- By 2050
- 201,516 · +27.1%
- By 2075
- 231,217 · +45.9%
- By 2100
- 241,697 · +52.5%
Race, ethnicity, and origin ACS 2023
- Neighborhood character
- Predominantly White (74%)
- Race & ethnicity
- White 74% Black 13% Hispanic / Latino 9% Two or more races 6%
- Hispanic origin (detail)
- Mexican 3%
- Common ancestry
- Lithuanian 9% Serbian 1% Italian 1%
- Foreign-born
- 6% · Canada
- Languages at home
- 91% English-only · Spanish 6% Other Indo-European 1%
Political lean MEDSL · Livingston
- 2024 margin
- Solid R (+68.5) · D 15.1% · R 83.6% · Other 1.3%
- 2008→2024 swing
- +3.4pp toward D · 2008: -71.9pp · 2024: -68.5pp
- All cycles
- 2024: R+68.5 2020: R+70.0 2016: R+72.5 2012: R+70.4 2008: R+71.9
Not yet ingested
- Civics
- —
Market trends
- HPI YoY
- ▼ -104.37%
- Current HPI
- 170.2207
- Rent YoY
- ▲ 3.83%
- Metro
- Baton Rouge, LA
- State GDP YoY
- ▲ 3.29%
- F500 in state
- 10
Industry mix (Fortune 500 HQ in LA)
| Industry | F500 HQs | Revenue |
|---|---|---|
| Telecommunications | 2 | $23B |
|
||
| Utilities | 1 | $12B |
|
||
| Wholesale / Distribution | 1 | $5B |
|
||
| Advertising | 1 | $2B |
|
||
Price history
1 event — show timeline
- 2026-02-25 Listed $206,990 Zillow
Cash-flow waterfall
monthlySold comps — $/sqft
last 12 mo · ≤1 miLoading sold comps…