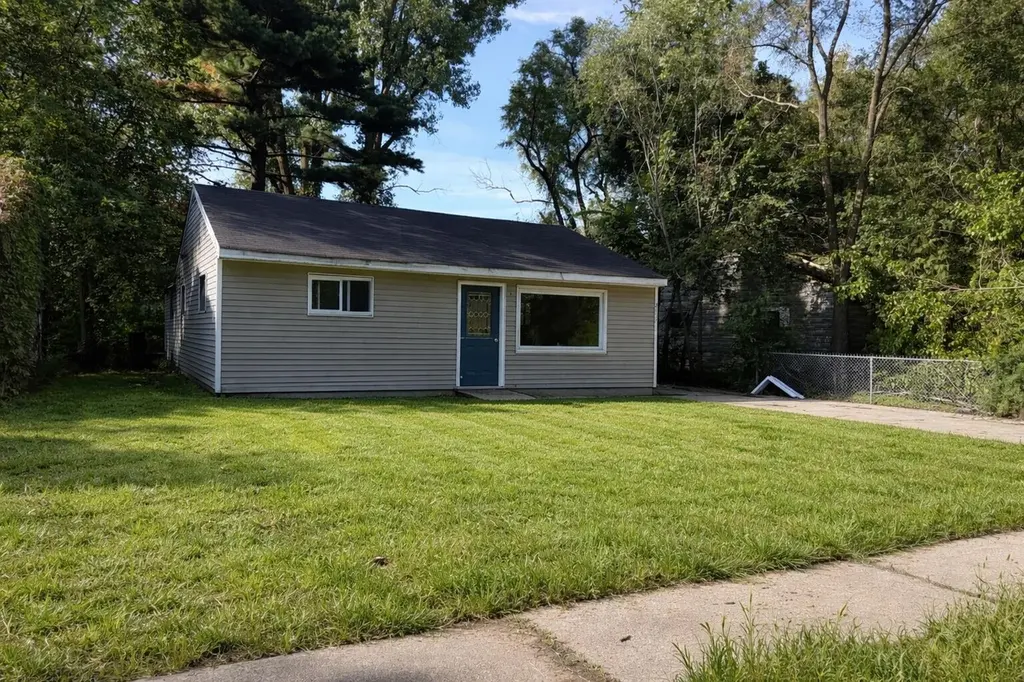
2157 E 20th Ave · Gary, IN
Flood risk 1/10 · Minimal
- FEMA flood zone
- X (unshaded)
- Chance of flooding over 30 yrs
- 0.0%
- Est. flood insurance / yr
- $507 – $1,088
Fire risk 3/10 · Minor
- Est. fire insurance / yr
- $717 – $1,331
Heat risk 2/10 · Minimal
- Hot days now (above 102°F)
- 6 days/yr
- Hot days in 30 yrs
- 13 days/yr
Wind risk 2/10 · Minimal
- Chance of severe wind over 30 yrs
- 0.0%
Air-quality risk 4/10 · Minor
- Unhealthy air days now
- 6 days/yr
- Unhealthy air days in 30 yrs
- 7 days/yr
Risk factors via First Street. Map © Google.
Why this score? — see what drove the B+ grade
The composite is a weighted blend of 9 inputs, each scored 0–100. Each bar is that input's sub-score; the figure is the points it added to the 100-point composite (weight × sub-score).
- Cash flow +30.0/30.0
- ARV discount +15.0/15.0
- 1% rule +10.0/10.0
- DSCR +10.0/10.0
- Appreciation +5.5/10.0
- Livability +3.7/5.0
- Rent growth +2.5/5.0
- Condition / age +2.5/5.0
- Schools +0.5/10.0
$49,700
🖨 Deal sheet 📄 Offer letter ✓ Due diligence
Listing remarks MLS
Investor's dream opportunity! This 3-bedroom, 1-bath ranch with a 2-car detached garage has been fully gutted down to the studs, offering a true blank canvas for your next project--whether you're planning a fix-and-flip, rental, or custom renovation. Electrical, plumbing, and utilities are all currently turned on, making it easier to begin your rehab right away. Some newer windows are already installed, giving you a valuable head start. Located on an up-and-coming block with multiple nearby investor remodels and just minutes from the Hard Rock Casino, this property offers strong potential for sweat equity and long-term value in a desirable single-level layout.
Key facts
- Newer windows
- Single-level layout
- 4,356 sq ft lot
Tags
Neighborhood map
What this means for you Summary
Snapshot
- This is a 1-bed/1.0-bath single-family listed at $50k.
Deal economics
- At list price, monthly cash flow is $519 ($6k/yr) — positive.
- The deal already cash-flows at list — no discount required.
- Meets the 1% rule at list price ($1k rent vs $50k).
- Recommended offer: $44k (12.0% below list) — sets the bar for market timing.
- Cap rate 18.8% vs local median 9.1% in Gary — top-decile yield for the area; either an underpriced asset or a hidden risk that comps aren't pricing in. Stress-test before assuming the spread holds.
Location & tenants
- Location reads 73/100 on livability (#105 in IN) — a middle-class / working-renter tenant base. Strengths: commute A+, cost of living A+, housing A+; Watch: schools F, crime F, employment F.
- Gary Community School Corporation (urban): math 3% / reading 11% proficiency, ranked #299 of 301 in IN (top 99%) — low school quality limits family demand, transient renter base, plan for 1-2y turnover; 80% free/reduced lunch — lower-income household profile, screen leases tightly.
- Market conditions: 121 active listings in the ZIP; 11 comparable units currently listed for rent nearby; rentals at typical pace (median 20d on market — plan ~3-4 weeks tenant-placement turnaround); lower-income renter base — watch delinquency; 1,642 units permitted in Lake County in 2024 (14 in 5+ unit buildings).
- This rent runs 44% of the median local income ($29k/yr) — at the standard rent-burdened threshold; future hikes will face affordability resistance.
Forward outlook
- In year one you build about $831 of equity ($344 loan paydown + $487 appreciation (1.0% local appreciation)).
- Lake County population projected to shrink 7% by 2050 — rents likely to lag national; underwrite the cash flow, not the appreciation.
- At projected returns (1.0% appreciation + 3.0% rent growth), your $14k cash investment doubles in ~2 years — after that, you're playing with house money.
Negotiation context
- It's been on market 289 days — a 12% lower offer ($44k) is reasonable based on typical stale-listing flexibility.
- 5 sale attempts since 20y ago; this cycle's ask is 5% above the opening price — seller raised mid-cycle; expect resistance to lowballs.
Risks & watch-outs
- Watch-outs: built in 1952 — expect roof / HVAC / electrical / plumbing capex.
Questions for the listing agent
- It's been on market 289 days. Have you received any prior offers? Is the seller open to a 12% concession, seller financing, or rate buy-down credit?
- Built in 1952 — when were the roof, HVAC, electrical panel, plumbing, and water heater last replaced?
- Why hasn't it sold? Are there any deal-killer items the seller is aware of (foundation, flood, title, zoning, code violations)?
- Is there a deadline driving the sale (1031 exchange, divorce, estate, relocation)? That informs how much negotiation room exists.
- Schools are F-rated, which usually means shorter tenancies and higher turnover. Who's the typical renter profile here, and what's been the actual vacancy rate?
- Crime grade is F in this area — have there been break-ins, vandalism, or insurance claims at this property in the last 3 years? What carrier currently insures it and at what premium?
- What's the average days-on-market for RENTAL listings here right now (not sales)? A rising rental-DOM trend means longer vacancies and softer asking-rent achievability than the comps imply.
- What's the recent tenant-quality profile in this submarket — average credit score on applications, eviction rate, late-payment / NSF rate, and stable-employment percentage? A property-management company in the area should have these aggregated.
- How much new for-sale + rental construction is in the pipeline within 1–3 miles? Heavy new supply typically softens prices + rents 12–24 months out; constrained supply supports both.
Investment metrics
- 1% rule
- 2.12% ✓
- Cap rate
- 18.83%
- Cash-on-cash
- 44.79%
- DSCR
- 2.99
- GRM
- 3.9
CMA / ARV
- ARV (median comp)
- $89,345
- List price
- $49,700
- Delta
- -44.37%
- Verdict
- UNDERPRICED
- Comps
- 20 within 1.0 mi
Projected returns pro-forma
0.98% appreciation · 3.0% rent growth · sell at horizon
- IRR
- 47.4%
- Equity multiple
- 3.44×
- Total profit
- $33,960
- Equity at exit
- $16,914
- IRR
- 49.1%
- Equity multiple
- 6.85×
- Total profit
- $81,435
- Equity at exit
- $22,437
Cash invested: $13,916 (down + closing). Projections, not guarantees.
Landlord ↔ Tenant lean methodology
- Overall (STATE)
- 90 Strongly Landlord-Friendly
- State Indiana
- 90 Strongly Landlord-Friendly · R+11
- County
- — inherits STATE
- City
- — inherits STATE
ZIP-level market 46407
- Home prices YoY
- 0.4%
- Active inventory
- 121
- Price-to-rent
- 3.9×
Monthly cashflow live
- Estimated rent
- $1,056 high interval (Pro) →
- Mortgage (P&I)
- −$261
- Tax from tax record
- −$33 /mo · $401/yr
- Insurance
- −$21
- HOA
- −$0
- Vacancy / Maint / Mgmt
- −$222
- Net cashflow
- $519
Break-even live
UW: 25.0% down · 7.5% · 30yr · 1.5% tax · 5.0% vac · 8.0% maint · 8.0% mgmt
Financing live
Cash to close
- Down payment
- $12,425
- Closing costs
- $1,491
- Reserves months
- —
- Total cash needed
- —
Loan-product check · same deal, 3 products live
Conventional
25% down · 7.5% · 30yr
- Down + closing
- —
- Monthly P&I
- —
- Monthly cashflow
- —
- DSCR
- —
- Eligible?
- —
Personal DTI + credit; lowest rate.
DSCR
20% down · 8.5% · 30yr
- Down + closing
- —
- Monthly P&I
- —
- Monthly cashflow
- —
- DSCR
- —
- Eligible?
- —
No personal income docs; deal must DSCR.
Hard money
10% down · 12.0% · 12mo
- Down + closing
- —
- Monthly P&I
- —
- Monthly cashflow
- —
- DSCR
- —
- Eligible?
- —
Short-term bridge; refi at stabilization.
Rent comps 11 comps
| Address | Beds | Baths | Sqft | Rent | $/sqft | DOM | Units | Dist |
|---|---|---|---|---|---|---|---|---|
| 1843 Illinois St Gary, IN | 2.0 | 1.0 | 725 | $1,200 | $1.66 | 17d | 1 | 0.35mi |
| 2355 Rhode Island St Gary, IN | 2.0 | 1.0 | 701 | $1,095 | $1.56 | 43d | 1 | 0.85mi |
| 2315 Industrial Blvd Gary, IN | 2.0 | 1.0 | 989 | $950 | $0.96 | 4d | 1 | 0.99mi |
| 2315 Industrial Blvd Gary, IN | 2.0 | 1.0 | 989 | $950 | $0.96 | 1d | 1 | 0.99mi |
| 2453 Prospect St Gary, IN | 2.0 | 1.0 | 704 | $1,095 | $1.56 | 1d | 1 | 1.00mi |
| 2061 Maryland St Gary, IN | 2.0 | 1.0 | 975 | $950 | $0.97 | 43d | 1 | 1.02mi |
| 2300 Maryland St Gary, IN | 2.0 | 1.0 | 900 | $1,000 | $1.11 | 19d | 1 | 1.09mi |
| 1329 Delaware St Gary, IN | 2.0 | 1.0 | 1100 | $1,100 | $1.00 | 43d | 1 | 1.22mi |
| 904 Idaho St Gary, IN | 2.0 | 1.0 | 1176 | $1,200 | $1.02 | 43d | 1 | 1.22mi |
| 1316 Delaware St Unit 2 Gary, IN | 2.0 | 1.0 | 700 | $950 | $1.36 | 21d | 1 | 1.26mi |
| 2022 Massachusetts St Gary, IN | 2.0 | 1.0 | 965 | $1,000 | $1.04 | 1d | 1 | 1.29mi |
Listing history 26 events
-
2026-06-18days on market $49,700 Active 289 DOM
-
2026-06-17remarks 686-char remark
-
2026-06-17price $49,700 Active 288 DOM
-
2026-06-17days on market $50,000 Active 288 DOM
-
2026-06-16days on market $50,000 Active 287 DOM
-
2026-06-15days on market $50,000 Active 286 DOM
-
2026-06-13days on market $50,000 Active 284 DOM
-
2026-06-13days on market $50,000 Active 283 DOM
-
2026-06-09days on market $50,000 Active 280 DOM
-
2026-06-08days on market $50,000 Active 279 DOM
-
2026-06-07days on market $50,000 Active 278 DOM
-
2026-06-04pricedays on market $50,000 Active 275 DOM
-
2026-06-03days on market $52,500 Active 274 DOM
-
2026-06-02days on market $52,500 Active 273 DOM
-
2026-06-01days on market $52,500 Active 272 DOM
-
2026-05-31days on market $52,500 Active 271 DOM
-
2026-02-19price $52,500 668-char remark
Show marketing remark (668 chars)
Investor's dream opportunity! This 3-bedroom, 1-bath ranch with a 2-car detached garage has been fully gutted down to the studs, offering a true blank canvas for your next project--whether you're planning a fix-and-flip, rental, or custom renovation. Electrical, plumbing, and utilities are all currently turned on, making it easier to begin your rehab right away. Some newer windows are already installed, giving you a valuable head start. Located on an up-and-coming block with multiple nearby investor remodels and just minutes from the Hard Rock Casino, this property offers strong potential for sweat equity and long-term value in a desirable single-level layout.
-
2026-01-13price $42,500 668-char remark
Show marketing remark (668 chars)
Investor's dream opportunity! This 3-bedroom, 1-bath ranch with a 2-car detached garage has been fully gutted down to the studs, offering a true blank canvas for your next project--whether you're planning a fix-and-flip, rental, or custom renovation. Electrical, plumbing, and utilities are all currently turned on, making it easier to begin your rehab right away. Some newer windows are already installed, giving you a valuable head start. Located on an up-and-coming block with multiple nearby investor remodels and just minutes from the Hard Rock Casino, this property offers strong potential for sweat equity and long-term value in a desirable single-level layout.
-
2025-09-02$47,500 Active 668-char remark
Show marketing remark (668 chars)
Investor's dream opportunity! This 3-bedroom, 1-bath ranch with a 2-car detached garage has been fully gutted down to the studs, offering a true blank canvas for your next project--whether you're planning a fix-and-flip, rental, or custom renovation. Electrical, plumbing, and utilities are all currently turned on, making it easier to begin your rehab right away. Some newer windows are already installed, giving you a valuable head start. Located on an up-and-coming block with multiple nearby investor remodels and just minutes from the Hard Rock Casino, this property offers strong potential for sweat equity and long-term value in a desirable single-level layout.
-
2010-05-21historical
-
2009-01-26$14,900
-
2007-02-14$12,900
-
2007-02-10historical
-
2007-01-29$17,650
-
2007-01-14historical
-
2006-10-17$19,900
ⓘ Source: listings_history table (triggers on properties + properties_extension) + one-shot
backfill from property_details.listing_events for pre-trigger history.
Tax reassessment forecast IN · Partial reset (capped growth)
- Current annual tax
- $401 · $33/mo
- Projected year-2 tax
- $412 · $34/mo
- Expected delta
- +$11/yr (+$1/mo · 2.6%)
ⓘ Screening estimate from a state-policy table — verify with the county assessor before closing.
Climate risk First Street
- Flood 1/10 Low FEMA zone X (unshaded) · 0% chance over 30 yrs
- Wildfire 3/10 Moderate
- Heat 2/10 Low 6 d/yr ≥102°F today · 13 d/yr by 30 yrs out
- Wind 2/10 Low 0% chance of damaging wind over 30 yrs
- Air quality 4/10 Moderate 6 unhealthy d/yr today · 7 by 30 yrs out
Nearby sold comps map
Loading sold comps map…
Walkable amenities ~0.75 mi
Loading nearby amenities…
Taxation est. · year 1
- Rental income
- $12,671
- − Mortgage interest
- −$2,784
- − Property taxes
- −$401
- − Insurance
- −$248
- − Repairs & maintenance
- −$1,014
- − Management
- −$1,014
- − Depreciation
- −$1,446
- Taxable income
- $5,764
- Est. tax owed @ 24.0%
- −$1,383
- After-tax cash flow
- $4,850/yr
For passive investors: Depreciation is non-cash, so a rental often shows a tax loss while cash-flowing — sheltering income. Rental losses are passive: they offset passive income freely, and up to $25,000/yr can offset ordinary (W-2) income if you actively participate and your MAGI is under $100k (phasing out to $0 by $150k); unused losses carry forward. On sale, claimed depreciation is recaptured at up to 25%, and gains may owe capital-gains tax (a 1031 exchange can defer both). Figures are a year-1 estimate at your 24.0% rate — not tax advice; consult a CPA.
Schools (NCES district)
- District
- Gary Community School Corporation
- NCES district ID
- 1803870
- Math proficiency
- 3% ▼ -10.00%
- Reading proficiency
- 11% ▼ -6.00%
- Median HH income
- $27,739
- Composite
- 4.98/100
- National rank
- #10039
- State rank
- #299 of 301 in IN
Livability — Gary
- Score
- 73/100
- State rank
- #105
- US rank
- #5592
Category grades
Schools grade is shown separately in the Schools card above.
Census & demographics
- Census place
- Gary, IN
- County
- Lake County · 422,878 people
- City population
- 63,701
- Metro
- Chicago-Naperville-Elgin, IL-IN-WI
- Population (ZIP)
- 8,577
- Household income
- $28,526
- Rent vs Own
- Severe rent burden
- 392.0
Population outlook (Lake County) Hauer SSP2
- Today (2025)
- 484,026 people
- By 2030
- 478,091 · -1.2%
- By 2040
- 462,974 · -4.3%
- By 2050
- 449,894 · -7.1%
- By 2075
- 436,169 · -9.9%
- By 2100
- 426,607 · -11.9%
Race, ethnicity, and origin ACS 2023
- Neighborhood character
- Predominantly Black (91%)
- Race & ethnicity
- Black 91% Hispanic / Latino 3% White 2% Two or more races 1%
- Common ancestry
- Romanian 1%
- Foreign-born
- 1% · Canada
- Languages at home
- 97% English-only · Spanish 1% Russian/Polish/Slavic 1% French/Haitian/Cajun 1%
Political lean MEDSL · Lake
- 2024 margin
- Lean D (+5.6) · D 52.1% · R 46.5% · Other 1.5%
- 2008→2024 swing
- -28.6pp toward R · 2008: 34.3pp · 2024: 5.6pp
- All cycles
- 2024: D+5.6 2020: D+15.1 2016: D+20.6 2012: D+31.0 2008: D+34.3
Not yet ingested
- Civics
- —
Market trends
- HPI YoY
- ▲ 0.98%
- Current HPI
- 253.2856
- Rent YoY
- —
- Metro
- Chicago-Naperville-Elgin, IL-IN-WI
- State GDP YoY
- ▲ 2.90%
- F500 in state
- 18
Industry mix (Fortune 500 HQ in IN)
| Industry | F500 HQs | Revenue |
|---|---|---|
| Industrial Machinery | 2 | $37B |
|
||
| Healthcare | 1 | $177B |
|
||
| Pharmaceuticals | 1 | $45B |
|
||
| Metals / Steel | 1 | $18B |
|
||
| Agriculture | 1 | $17B |
|
||
| Packaging | 1 | $12B |
|
||
Price history
+163.8% since first listed10 events — show timeline
- 2026-02-19 Price Changed $52,500 NIRA MLS as Distributed by MLS Grid
- 2026-01-13 Price Changed $42,500 NIRA MLS as Distributed by MLS Grid
- 2025-09-02 Listed $47,500 NIRA MLS as Distributed by MLS Grid
- 2010-05-21 Listing Removed — NIRA MLS as Distributed by MLS Grid
- 2009-01-26 Listed $14,900 NIRA MLS as Distributed by MLS Grid
- 2007-02-14 Listed $12,900 NIRA MLS as Distributed by MLS Grid
- 2007-02-10 Listing Removed — NIRA MLS as Distributed by MLS Grid
- 2007-01-29 Listed $17,650 NIRA MLS as Distributed by MLS Grid
- 2007-01-14 Listing Removed — NIRA MLS as Distributed by MLS Grid
- 2006-10-17 Listed $19,900 NIRA MLS as Distributed by MLS Grid
Property tax history
-17.0%/yrLatest (2024): $401 · +0.1% YoY. Source: county tax records.
Cash-flow waterfall
monthlySold comps — $/sqft
last 12 mo · ≤1 miLoading sold comps…