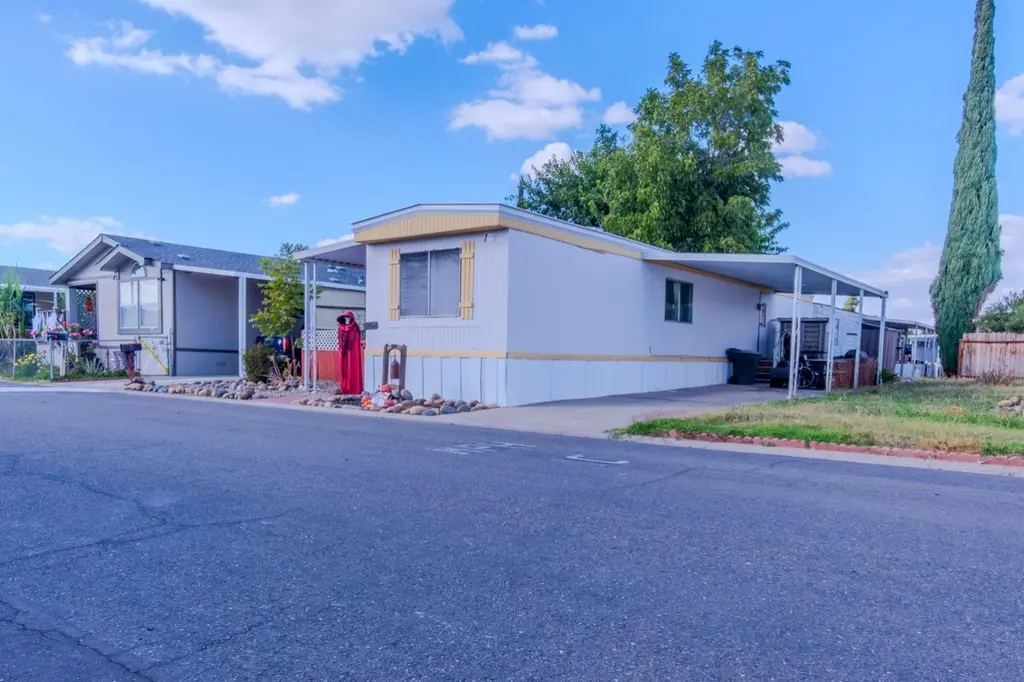
8227 Tiki Ln · Florin, CA
Flood risk 1/10 · Minimal
- FEMA flood zone
- X (shaded)
- Chance of flooding over 30 yrs
- 0.0%
- Est. flood insurance / yr
- $507 – $1,088
Fire risk 2/10 · Minimal
- Est. fire insurance / yr
- $659 – $1,223
Heat risk 7/10 · Major
- Hot days now (above 102°F)
- 7 days/yr
- Hot days in 30 yrs
- 14 days/yr
Wind risk 1/10 · Minimal
- Chance of severe wind over 30 yrs
- —
Air-quality risk 10/10 · Severe
- Unhealthy air days now
- 28 days/yr
- Unhealthy air days in 30 yrs
- 33 days/yr
Risk factors via First Street. Map © Google.
Why this score? — see what drove the B grade
The composite is a weighted blend of 9 inputs, each scored 0–100. Each bar is that input's sub-score; the figure is the points it added to the 100-point composite (weight × sub-score).
- Cash flow +30.0/30.0
- 1% rule +10.0/10.0
- DSCR +10.0/10.0
- ARV discount +7.5/15.0
- Schools +4.1/10.0
- Livability +2.9/5.0
- Rent growth +2.4/5.0
- Condition / age +2.2/5.0
- Appreciation +1.3/10.0
$89,000
🖨 Deal sheet (PDF) 📄 Offer letter ✓ Due diligence
Listing remarks
Welcome to Camellia Village Mobile Estates - a family-friendly community in Sacramento! Ideally located near Highway 99 and Florin Road, this neighborhood offers quick access to shopping, dining, and entertainment while nestled in a park-like setting. Community amenities include a remodeled clubhouse, sparkling swimming and wading pools, a basketball court, green spaces, laundry facility, and boat/RV storage. On-site management and 24-hour emergency maintenance provide convenience and peace of mind, while the Elk Grove Unified School District makes this a great choice for families. This home at 8227 Tiki Lane, Space #222 offers comfort and affordability with everything Camellia Village prov
Key facts
- Basketball court
- Green spaces
- Wading pools
Tags
Neighborhood map
What this means for you Summary
Snapshot
- This is a 2-bed/1.0-bath manufactured listed at $89k. Condition is rated fair.
Deal economics
- At list price, monthly cash flow is $978 ($12k/yr) — positive.
- The deal already cash-flows at list — no discount required.
- Meets the 1% rule at list price ($2k rent vs $89k).
- Recommended offer: $78k (12.0% below list) — sets the bar for market timing.
- Cap rate 19.5% vs local median 3.6% in Florin — top-decile yield for the area; either an underpriced asset or a hidden risk that comps aren't pricing in. Stress-test before assuming the spread holds.
Location & tenants
- Location reads 58/100 on livability (#673 in CA) — a working-class tenant base; expect higher turnover. Strengths: housing A; Watch: employment D, schools D-, crime F.
- Elk Grove Unified (suburban): math 40% / reading 51% proficiency, ranked #165 of 517 in CA (top 32%) — families likely to look elsewhere, expect single-tenant / working-renter base with shorter leases.
- Market conditions: Rents soft (-0.2%/yr); 215 active listings in the ZIP; 3 comparable units currently listed for rent nearby; rentals leasing fast (median 4d on market — plan ~1-2 weeks tenant-placement turnaround); solid renter incomes; 6,825 units permitted in Sacramento County in 2024 (1,752 in 5+ unit buildings).
Forward outlook
- Local home prices are declining (-3.0%/yr); year-one equity from $615 of loan paydown is wiped out by about $3k of value loss. Plan a longer hold.
- Sacramento County population projected at +17% by 2050 — long-run rental-demand tailwind backs the buy-and-hold thesis.
- At projected returns (-3.0% appreciation + 0.0% rent growth), your $25k cash investment doubles in ~3 years — after that, you're playing with house money.
Negotiation context
- It's been on market 254 days — a 12% lower offer ($78k) is reasonable based on typical stale-listing flexibility.
Risks & watch-outs
- Climate carrying-cost: extreme-heat days projected 7→14/yr by 2055 (HVAC capex compounding) — expect insurance premiums to compound above CPI over the hold.
Questions for the listing agent
- It's been on market 254 days. Have you received any prior offers? Is the seller open to a 12% concession, seller financing, or rate buy-down credit?
- Have any recent inspections been done? Can we get a copy of the seller's disclosures and any deferred-maintenance estimates?
- Built in 1979 — when were the roof, HVAC, electrical panel, plumbing, and water heater last replaced?
- Why hasn't it sold? Are there any deal-killer items the seller is aware of (foundation, flood, title, zoning, code violations)?
- Is there a deadline driving the sale (1031 exchange, divorce, estate, relocation)? That informs how much negotiation room exists.
- Schools are D-rated, which usually means shorter tenancies and higher turnover. Who's the typical renter profile here, and what's been the actual vacancy rate?
- Crime grade is F in this area — have there been break-ins, vandalism, or insurance claims at this property in the last 3 years? What carrier currently insures it and at what premium?
- What's the average days-on-market for RENTAL listings here right now (not sales)? A rising rental-DOM trend means longer vacancies and softer asking-rent achievability than the comps imply.
- What's the recent tenant-quality profile in this submarket — average credit score on applications, eviction rate, late-payment / NSF rate, and stable-employment percentage? A property-management company in the area should have these aggregated.
- How much new for-sale + rental construction is in the pipeline within 1–3 miles? Heavy new supply typically softens prices + rents 12–24 months out; constrained supply supports both.
Investment metrics
- 1% rule
- 2.27% ✓
- Cap rate
- 19.49%
- Cash-on-cash
- 47.11%
- DSCR
- 3.10
- GRM
- 3.7
CMA / ARV
- ARV (median comp)
- $57,113
- List price
- $89,000
- Delta
- 55.83%
- Verdict
- OVERPRICED
- Comps
- 5 within 2.0 mi
Show comp detail 1 sale within ~0.75 mi
| Address | Dist | Beds/Ba | Sqft | Sold | Price | $/sf | Match |
|---|---|---|---|---|---|---|---|
| 7515 Debutante Ln #95 | 0.14mi | 2/1.0 | 720 (0%) | 15mo | $64,000 | $89 | 81 |
Match score weights: distance 35% · size 25% · config 20% · recency 20%. Top-matched comps best support the ARV.
Projected returns pro-forma
-3.0% appreciation · 0.0% rent growth · sell at horizon
- IRR
- 41.0%
- Equity multiple
- 2.69×
- Total profit
- $42,013
- Equity at exit
- $13,270
- IRR
- 45.8%
- Equity multiple
- 4.78×
- Total profit
- $94,105
- Equity at exit
- $7,695
Cash invested: $24,920 (down + closing). Projections, not guarantees.
Landlord ↔ Tenant lean methodology
- Overall (STATE)
- 18 Strongly Tenant-Friendly
- State California
- 18 Strongly Tenant-Friendly · D+13
- County
- — inherits STATE
- City
- — inherits STATE
ZIP-level market 95828
- Home prices YoY
- -0.8%
- Rents YoY
- -0.2%
- Active inventory
- 215
- Price-to-rent
- 3.7×
Monthly cashflow live
- Estimated rent
- $2,017 medium interval (Pro) →
- Mortgage (P&I)
- −$467
- Tax est. 1.5%
- −$111 /mo · $1,335/yr
- Insurance
- −$37
- HOA
- −$0
- Vacancy / Maint / Mgmt
- −$424
- Net cashflow
- $978
Break-even live
Sensitivity live
| Price | -10% $1,040 | -5% $1,009 | +0% $978 | +5% $948 | +10% $917 |
|---|---|---|---|---|---|
| Rent | -10% $819 | -5% $899 | +0% $978 | +5% $1,058 | +10% $1,138 |
| Rate | -1.0pp $1,023 | -0.5pp $1,001 | base $978 | +0.5pp $955 | +1.0pp $932 |
UW: 25.0% down · 7.5% · 30yr · 1.5% tax · 5.0% vac · 8.0% maint · 8.0% mgmt
Financing live
Cash to close
- Down payment
- $22,250
- Closing costs
- $2,670
- Reserves months
- —
- Total cash needed
- —
Loan-product check · same deal, 3 products live
Conventional
25% down · 7.5% · 30yr
- Down + closing
- —
- Monthly P&I
- —
- Monthly cashflow
- —
- DSCR
- —
- Eligible?
- —
Personal DTI + credit; lowest rate.
DSCR
20% down · 8.5% · 30yr
- Down + closing
- —
- Monthly P&I
- —
- Monthly cashflow
- —
- DSCR
- —
- Eligible?
- —
No personal income docs; deal must DSCR.
Hard money
10% down · 12.0% · 12mo
- Down + closing
- —
- Monthly P&I
- —
- Monthly cashflow
- —
- DSCR
- —
- Eligible?
- —
Short-term bridge; refi at stabilization.
Rent comps 3 comps
| Address | Beds | Baths | Sqft | Rent | $/sqft | DOM | Units | Dist |
|---|---|---|---|---|---|---|---|---|
| 7575 Power Inn Rd Sacramento, CA | 1.0–2.0 | 1.0–2.0 | 729 | $1,950 | $2.67 | 3d | 5 | 0.46mi |
| 7337 Power Inn Rd Sacramento, CA | 2.0 | 1.0 | 663 | $1,775 | $2.68 | 24d | 3 | 0.57mi |
| 8550 Florin Rd Sacramento, CA | 1.0–2.0 | 1.0 | 776 | $1,795 | $2.31 | 3d | 16 | 0.92mi |
Listing history 15 events
-
2026-06-21days on market $89,000 Active 254 DOM
-
2026-06-18days on market $89,000 Active 251 DOM
-
2026-06-17days on market $89,000 Active 250 DOM
-
2026-06-16days on market $89,000 Active 249 DOM
-
2026-06-15days on market $89,000 Active 248 DOM
-
2026-06-13days on market $89,000 Active 246 DOM
-
2026-06-13days on market $89,000 Active 245 DOM
-
2026-06-09days on market $89,000 Active 242 DOM
-
2026-06-08days on market $89,000 Active 241 DOM
-
2026-06-07days on market $89,000 Active 240 DOM
-
2026-06-05days on market $89,000 Active 237 DOM
-
2026-06-03days on market $89,000 Active 236 DOM
-
2026-06-02days on market $89,000 Active 235 DOM
-
2026-06-01days on market $89,000 Active 234 DOM
-
2026-05-31days on market $89,000 Active 233 DOM
ⓘ Source: listings_history table (triggers on properties + properties_extension) + one-shot
backfill from property_details.listing_events for pre-trigger history.
Climate risk First Street
- Flood 1/10 Low FEMA zone X (shaded) · 0% chance over 30 yrs
- Wildfire 2/10 Low
- Heat 7/10 Severe 7 d/yr ≥102°F today · 14 d/yr by 30 yrs out
- Wind 1/10 Low
- Air quality 10/10 Extreme 28 unhealthy d/yr today · 33 by 30 yrs out
Nearby sold comps map
Loading sold comps map…
Walkable amenities ~0.75 mi
Loading nearby amenities…
Taxation est. · year 1
- Rental income
- $24,205
- − Mortgage interest
- −$4,985
- − Property taxes
- −$1,335
- − Insurance
- −$445
- − Repairs & maintenance
- −$1,936
- − Management
- −$1,936
- − Depreciation
- −$2,589
- Taxable income
- $10,977
- Est. tax owed @ 24.0%
- −$2,635
- After-tax cash flow
- $9,106/yr
For passive investors: Depreciation is non-cash, so a rental often shows a tax loss while cash-flowing — sheltering income. Rental losses are passive: they offset passive income freely, and up to $25,000/yr can offset ordinary (W-2) income if you actively participate and your MAGI is under $100k (phasing out to $0 by $150k); unused losses carry forward. On sale, claimed depreciation is recaptured at up to 25%, and gains may owe capital-gains tax (a 1031 exchange can defer both). Figures are a year-1 estimate at your 24.0% rate — not tax advice; consult a CPA.
Condition & rehab AI · 12 photos
This manufactured home requires significant repairs and updates to its exterior, interior, and appliances to improve its condition and value.
Repairs flagged
- Major exterior siding — Significant wear and tear
- Major flooring — Worn carpet, visible wear
- Major interior walls/paint — Worn paint, visible wear
- Major kitchen appliances — Outdated and cluttered
- Major bathroom fixtures — Outdated and cluttered
Value-add opportunities
- Both Painting and updating interior walls — Fresh paint can improve both resale and rental value
- Both New flooring — New flooring can improve both resale and rental value
- Both Upgrading kitchen appliances — Upgraded appliances can improve both resale and rental value
- Both Updating bathroom fixtures — Updated fixtures can improve both resale and rental value
Renovation cost estimate screening
| Repair item | Severity | Est. cost |
|---|---|---|
| exterior siding · Significant wear and tear | Major | $15,000–50,000 |
| flooring · Worn carpet, visible wear | Major | $15,000–50,000 |
| interior walls/paint · Worn paint, visible wear | Major | $15,000–50,000 |
| kitchen appliances · Outdated and cluttered | Major | $15,000–50,000 |
| bathroom fixtures · Outdated and cluttered | Major | $15,000–50,000 |
| Total estimated repair cost · 5 items | $75,000–250,000 |
Value-add ROI direction
- Both Painting and updating interior walls — Fresh paint can improve both resale and rental value ↑
- Both New flooring — New flooring can improve both resale and rental value ↑
- Both Upgrading kitchen appliances — Upgraded appliances can improve both resale and rental value ↑
- Both Updating bathroom fixtures — Updated fixtures can improve both resale and rental value ↑
ⓘ Cost ranges are severity-bucket heuristics (US national rule-of-thumb). Get contractor quotes + a written scope before underwriting a rehab budget.
Schools (NCES district)
- District
- Elk Grove Unified
- NCES district ID
- 0612330
- Math proficiency
- 40% ▼ -5.00%
- Reading proficiency
- 51% ▼ -5.00%
- Median HH income
- $67,860
- Composite
- 40.72/100
- National rank
- #3658
- State rank
- #165 of 517 in CA
Livability — Florin
- Score
- 58/100
- State rank
- #673
- US rank
- #20705
Category grades
Schools grade is shown separately in the Schools card above.
Census & demographics
- Census place
- Florin, CA
- County
- Sacramento County · 1,539,646 people
- City population
- 761,410
- Metro
- Sacramento-Roseville-Folsom, CA
- Population (ZIP)
- 61,686
- Household income
- $81,778
- Rent vs Own
- Severe rent burden
- 1765.0
Population outlook (Sacramento County) Hauer SSP2
- Today (2025)
- 1,660,763 people
- By 2030
- 1,732,990 · +4.3%
- By 2040
- 1,855,755 · +11.7%
- By 2050
- 1,941,335 · +16.9%
- By 2075
- 2,046,162 · +23.2%
- By 2100
- 1,961,444 · +18.1%
Race, ethnicity, and origin ACS 2023
- Neighborhood character
- Highly diverse neighborhood (Simpson 0.75)
- Race & ethnicity
- Asian 37% Hispanic / Latino 26% White 16% Two or more races 12% Black 10% Pacific Islander 4%
- Hispanic origin (detail)
- Mexican 22%
- Common ancestry
- Italian 1% Russian 1% Portuguese 1%
- Foreign-born
- 35% · Vietnam, Canada, China
- Languages at home
- 47% English-only · Spanish 17% Other Asian/Pacific 13% Vietnamese 8%
Political lean MEDSL · Sacramento
- 2024 margin
- D (+19.7) · D 58.1% · R 38.4% · Other 3.5%
- 2008→2024 swing
- +0.7pp no change · 2008: 19.0pp · 2024: 19.7pp
- All cycles
- 2024: D+19.7 2020: D+25.3 2016: D+23.7 2012: D+16.3 2008: D+19.0
Not yet ingested
- Civics
- —
Market trends
- HPI YoY
- ▼ -7.49%
- Current HPI
- 962.47
- Rent YoY
- ▼ -0.24%
- Metro
- Sacramento-Roseville-Folsom, CA
- State GDP YoY
- ▲ 3.21%
- F500 in state
- 116
Industry mix (Fortune 500 HQ in CA)
| Industry | F500 HQs | Revenue |
|---|---|---|
| Technology | 27 | $1,492B |
|
||
| Financial Services | 3 | $174B |
|
||
| Retail | 3 | $44B |
|
||
| Insurance | 3 | $26B |
|
||
| Media / Entertainment | 2 | $115B |
|
||
| Pharmaceuticals / Biotech | 2 | $62B |
|
||
Cash-flow waterfall
monthlySold comps — $/sqft
last 12 mo · ≤1 miLoading sold comps…