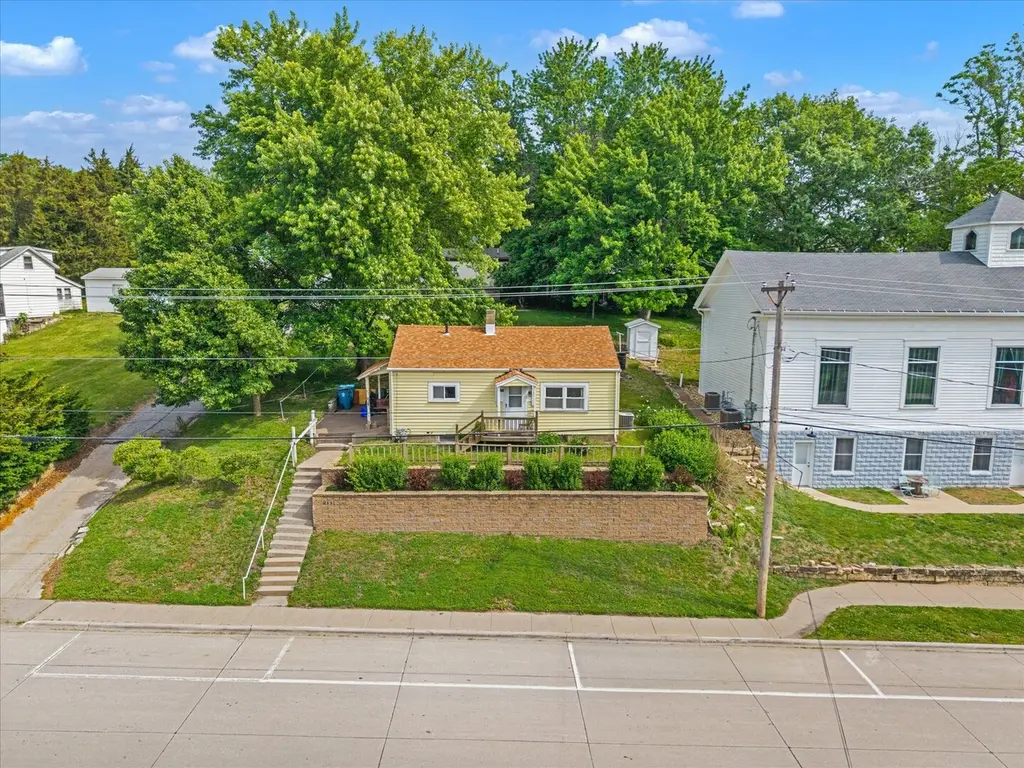
211 Jones St · Le Claire, IA
Flood risk 1/10 · Minimal
- FEMA flood zone
- X (unshaded)
- Chance of flooding over 30 yrs
- 0.0%
- Est. flood insurance / yr
- $473 – $860
Fire risk 1/10 · Minimal
- Est. fire insurance / yr
- $902 – $1,676
Heat risk 3/10 · Minor
- Hot days now (above 104°F)
- 7 days/yr
- Hot days in 30 yrs
- 16 days/yr
Wind risk 2/10 · Minimal
- Chance of severe wind over 30 yrs
- —
Air-quality risk 2/10 · Minimal
- Unhealthy air days now
- 1 days/yr
- Unhealthy air days in 30 yrs
- 1 days/yr
Risk factors via First Street. Map © Google.
Why this score? — see what drove the A- grade
The composite is a weighted blend of 9 inputs, each scored 0–100. Each bar is that input's sub-score; the figure is the points it added to the 100-point composite (weight × sub-score).
- Cash flow +30.0/30.0
- ARV discount +15.0/15.0
- 1% rule +10.0/10.0
- DSCR +10.0/10.0
- Schools +7.6/10.0
- Livability +3.7/5.0
- Rent growth +2.5/5.0
- Condition / age +2.5/5.0
- Appreciation +0.0/10.0
$125,000
🖨 Deal sheet 📄 Offer letter ✓ Due diligence
Listing remarks
In historic downtown Le Claire find this cute 2 bedroom and 1 bathroom original home with gorgeous river views and well maintained landscaping.
Key facts
- Historic downtown
- Gorgeous river views
- 4,356 sq ft lot
Tags
Property features AI
Finance
- Other: Living area size reported from assessor (approx. 660 finished on main); Unfinished basement approx. 330
- HOA & community: No master association fee required
Exterior
- Utilities: Public water; Public sewer
- Home design: Detached single-family home; One-story; Main entry level
- Construction: Built 81–90 years ago; Vinyl siding exterior; Stone foundation; Asphalt roof
- Exterior features: Sloped lot; Lot dimensions approx. 60 x 70; Lot smaller than 0.25 acre
Interior
- Kitchen: Kitchen
- Bedrooms: Master bedroom (Main level, approx. 13 x 9); Bedroom 2 (Main level, approx. 13 x 7); Bedroom 3; Bedroom 4
- Bathrooms: 1 full bath
- Heating & cooling: Natural gas forced air heating; Central air conditioning
- Interior features: Living room; Family room; Dining room; Unfinished partial basement
- Laundry & utility: Dedicated laundry room
Neighborhood map
What this means for you Summary
Snapshot
- This is a 2-bed/1.0-bath single-family listed at $125k.
Deal economics
- At list price, monthly cash flow is $883 ($11k/yr) — positive.
- The deal already cash-flows at list — no discount required.
- Meets the 1% rule at list price ($2k rent vs $125k).
- Recommended offer: $123k (1.5% below list) — sets the bar for market timing.
- Cap rate 14.8% vs local median 4.6% in Le Claire — top-decile yield for the area; either an underpriced asset or a hidden risk that comps aren't pricing in. Stress-test before assuming the spread holds.
Location & tenants
- Location reads 74/100 on livability (#256 in IA, #4,947 nationally) — a middle-class / working-renter tenant base. Strengths: schools A+, crime A+, housing A+; Watch: amenities F, commute F, health & safety F.
- Pleasant Valley Community School District (suburban): math 87% / reading 85% proficiency, ranked #5 of 289 in IA (top 2%) — strong family-tenant draw, lease renewals of 3-5y typical; only 8% free/reduced lunch — higher-income household profile.
- Market conditions: 80 active listings in the ZIP; 805 units permitted in Scott County in 2024 (479 in 5+ unit buildings).
Forward outlook
- Local home prices are declining (-3.0%/yr); year-one equity from $864 of loan paydown is wiped out by about $4k of value loss. Plan a longer hold.
- Scott County population projected at +19% by 2050 — long-run rental-demand tailwind backs the buy-and-hold thesis.
- At projected returns (-3.0% appreciation + 3.0% rent growth), your $35k cash investment doubles in ~4 years — after that, you're playing with house money.
Negotiation context
- It's been on market 27 days — a 2% lower offer ($123k) is reasonable based on typical stale-listing flexibility.
Risks & watch-outs
- Watch-outs: built in 1939 — expect roof / HVAC / electrical / plumbing capex.
Questions for the listing agent
- Built in 1939 — when were the roof, HVAC, electrical panel, plumbing, and water heater last replaced?
- Is there a deadline driving the sale (1031 exchange, divorce, estate, relocation)? That informs how much negotiation room exists.
- Schools are A-rated — typically a magnet for longer-tenancy family renters. What's the average tenant stay here, and is there a school-zone premium baked into asking?
- What's the average days-on-market for RENTAL listings here right now (not sales)? A rising rental-DOM trend means longer vacancies and softer asking-rent achievability than the comps imply.
- What's the recent tenant-quality profile in this submarket — average credit score on applications, eviction rate, late-payment / NSF rate, and stable-employment percentage? A property-management company in the area should have these aggregated.
- How much new for-sale + rental construction is in the pipeline within 1–3 miles? Heavy new supply typically softens prices + rents 12–24 months out; constrained supply supports both.
Investment metrics
- 1% rule
- 1.70% ✓
- Cap rate
- 14.77%
- Cash-on-cash
- 30.28%
- DSCR
- 2.35
- GRM
- 4.9
CMA / ARV
- ARV (on-the-fly)
- $172,920
- Comps found
- 2
Show comp detail 2 sales within ~0.75 mi
| Address | Dist | Beds/Ba | Sqft | Sold | Price | $/sf | Match |
|---|---|---|---|---|---|---|---|
| 218 Davenport St | 0.23mi | 2/1.0 | 620 (-6%) | 21mo | $162,500 | $262 | 62 |
| 305 S 8th St | 0.44mi | 2/1.0 | 758 (+15%) | 8mo | $164,690 | $217 | 48 |
Match score weights: distance 35% · size 25% · config 20% · recency 20%. Top-matched comps best support the ARV.
Projected returns pro-forma
-3.0% appreciation · 3.0% rent growth · sell at horizon
- IRR
- 24.9%
- Equity multiple
- 2.03×
- Total profit
- $35,977
- Equity at exit
- $18,638
- IRR
- 32.7%
- Equity multiple
- 3.96×
- Total profit
- $103,707
- Equity at exit
- $10,808
Cash invested: $35,000 (down + closing). Projections, not guarantees.
Landlord ↔ Tenant lean methodology
- Overall (STATE)
- 83 Strongly Landlord-Friendly
- State Iowa
- 83 Strongly Landlord-Friendly · R+6
- County
- — inherits STATE
- City
- — inherits STATE
ZIP-level market 52753
- Home prices YoY
- -31.0%
- Active inventory
- 80
- Price-to-rent
- 4.9×
Monthly cashflow live
- Estimated rent
- $2,123 medium interval (Pro) →
- Mortgage (P&I)
- −$656
- Tax from tax record
- −$87 /mo · $1,040/yr
- Insurance
- −$52
- HOA
- −$0
- Vacancy / Maint / Mgmt
- −$446
- Net cashflow
- $883
Break-even live
UW: 25.0% down · 7.5% · 30yr · 1.5% tax · 5.0% vac · 8.0% maint · 8.0% mgmt
Financing live
Cash to close
- Down payment
- $31,250
- Closing costs
- $3,750
- Reserves months
- —
- Total cash needed
- —
Loan-product check · same deal, 3 products live
Conventional
25% down · 7.5% · 30yr
- Down + closing
- —
- Monthly P&I
- —
- Monthly cashflow
- —
- DSCR
- —
- Eligible?
- —
Personal DTI + credit; lowest rate.
DSCR
20% down · 8.5% · 30yr
- Down + closing
- —
- Monthly P&I
- —
- Monthly cashflow
- —
- DSCR
- —
- Eligible?
- —
No personal income docs; deal must DSCR.
Hard money
10% down · 12.0% · 12mo
- Down + closing
- —
- Monthly P&I
- —
- Monthly cashflow
- —
- DSCR
- —
- Eligible?
- —
Short-term bridge; refi at stabilization.
Listing history 17 events
-
2026-06-18days on market $125,000 Active 27 DOM
-
2026-06-17days on market $125,000 Active 26 DOM
-
2026-06-16days on market $125,000 Active 25 DOM
-
2026-06-15days on market $125,000 Active 24 DOM
-
2026-06-14days on market $125,000 Active 22 DOM
-
2026-06-13days on market $125,000 Active 21 DOM
-
2026-06-10days on market $125,000 Active 19 DOM
-
2026-06-09days on market $125,000 Active 18 DOM
-
2026-06-08days on market $125,000 Active 17 DOM
-
2026-06-07days on market $125,000 Active 16 DOM
-
2026-06-05days on market $125,000 Active 13 DOM
-
2026-06-03days on market $125,000 Active 12 DOM
-
2026-06-02days on market $125,000 Active 11 DOM
-
2026-06-01days on market $125,000 Active 10 DOM
-
2026-05-31days on market $125,000 Active 9 DOM
-
2026-05-30days on market $125,000 Active 8 DOM
-
2026-05-22$125,000 Active
ⓘ Source: listings_history table (triggers on properties + properties_extension) + one-shot
backfill from property_details.listing_events for pre-trigger history.
Tax reassessment forecast IA · Partial reset (capped growth)
- Current annual tax
- $1,040 · $87/mo
- Projected year-2 tax
- $1,501 · $125/mo
- Expected delta
- +$461/yr (+$38/mo · 44.4%)
ⓘ Screening estimate from a state-policy table — verify with the county assessor before closing.
Climate risk First Street
- Flood 1/10 Low FEMA zone X (unshaded) · 0% chance over 30 yrs
- Wildfire 1/10 Low
- Heat 3/10 Moderate 7 d/yr ≥104°F today · 16 d/yr by 30 yrs out
- Wind 2/10 Low
- Air quality 2/10 Low 1 unhealthy d/yr today · 1 by 30 yrs out
Nearby sold comps map
Loading sold comps map…
Walkable amenities ~0.75 mi
Loading nearby amenities…
Taxation est. · year 1
- Rental income
- $25,479
- − Mortgage interest
- −$7,002
- − Property taxes
- −$1,040
- − Insurance
- −$625
- − Repairs & maintenance
- −$2,038
- − Management
- −$2,038
- − Depreciation
- −$3,636
- Taxable income
- $9,099
- Est. tax owed @ 24.0%
- −$2,184
- After-tax cash flow
- $8,413/yr
For passive investors: Depreciation is non-cash, so a rental often shows a tax loss while cash-flowing — sheltering income. Rental losses are passive: they offset passive income freely, and up to $25,000/yr can offset ordinary (W-2) income if you actively participate and your MAGI is under $100k (phasing out to $0 by $150k); unused losses carry forward. On sale, claimed depreciation is recaptured at up to 25%, and gains may owe capital-gains tax (a 1031 exchange can defer both). Figures are a year-1 estimate at your 24.0% rate — not tax advice; consult a CPA.
Schools (NCES district)
- District
- Pleasant Valley Community School District
- NCES district ID
- 1923110
- Math proficiency
- 87% ▼ -4.00%
- Reading proficiency
- 85% ▼ -2.00%
- Median HH income
- $80,716
- Composite
- 75.59/100
- National rank
- #130
- State rank
- #5 of 289 in IA
Livability — Le Claire
- Score
- 74/100
- State rank
- #256
- US rank
- #4947
Category grades
Schools grade is shown separately in the Schools card above.
Census & demographics
- Census place
- Le Claire, IA
- Population (ZIP)
- 6,111
Population outlook (Scott County) Hauer SSP2
- Today (2025)
- 188,878 people
- By 2030
- 196,648 · +4.1%
- By 2040
- 210,860 · +11.6%
- By 2050
- 224,359 · +18.8%
- By 2075
- 258,884 · +37.1%
- By 2100
- 286,447 · +51.7%
Race, ethnicity, and origin ACS 2023
- Neighborhood character
- Predominantly White (91%)
- Race & ethnicity
- White 91% Two or more races 5% Asian 2% Hispanic / Latino 1%
- Common ancestry
- Serbian 3% Italian 3% Slovak 2%
- Foreign-born
- 0% · Canada
- Languages at home
- 99% English-only · Spanish 1%
Political lean MEDSL · Scott
- 2024 margin
- Toss-up / Even · D 47.3% · R 51.2% · Other 1.4%
- 2008→2024 swing
- -18.4pp toward R · 2008: 14.6pp · 2024: -3.9pp
- All cycles
- 2024: R+3.9 2020: D+3.5 2016: D+1.4 2012: D+13.8 2008: D+14.6
Not yet ingested
- Civics
- —
Market trends
- HPI YoY
- ▼ -91.47%
- Current HPI
- 203.798
- Rent YoY
- —
- Metro
- —
- State GDP YoY
- ▲ 2.48%
- F500 in state
- 4
Industry mix (Fortune 500 HQ in IA)
| Industry | F500 HQs | Revenue |
|---|---|---|
| Financial Services | 1 | $16B |
|
||
| Retail / Convenience | 1 | $15B |
|
||
Price history
1 event — show timeline
- 2026-05-22 Listed $125,000 MRED as Distributed by MLS Grid
Property tax history
+2.3%/yrLatest (2025): $1,040 · -1.1% YoY. Source: county tax records.
Cash-flow waterfall
monthlySold comps — $/sqft
last 12 mo · ≤1 miLoading sold comps…