215 Mink Br · McDowell, KY
Flood risk 10/10 · Severe
- FEMA flood zone
- X (unshaded)
- Chance of flooding over 30 yrs
- 0.99%
- Est. flood insurance / yr
- $507 – $1,088
Fire risk 8/10 · Major
- Est. fire insurance / yr
- $839 – $1,559
Heat risk 4/10 · Minor
- Hot days now (above 100°F)
- 7 days/yr
- Hot days in 30 yrs
- 19 days/yr
Wind risk 2/10 · Minimal
- Chance of severe wind over 30 yrs
- 1.0%
Air-quality risk 1/10 · Minimal
- Unhealthy air days now
- 0 days/yr
- Unhealthy air days in 30 yrs
- 0 days/yr
Risk factors via First Street. Map © Google.
Why this score? — see what drove the C+ grade
The composite is a weighted blend of 9 inputs, each scored 0–100. Each bar is that input's sub-score; the figure is the points it added to the 100-point composite (weight × sub-score).
- Cash flow +24.1/30.0
- DSCR +7.8/10.0
- ARV discount +7.5/15.0
- Appreciation +5.7/10.0
- 1% rule +5.3/10.0
- Livability +2.9/5.0
- Rent growth +2.5/5.0
- Condition / age +2.5/5.0
- Schools +1.8/10.0
$105,900
🖨 Deal sheet 📄 Offer letter ✓ Due diligence
Listing remarks
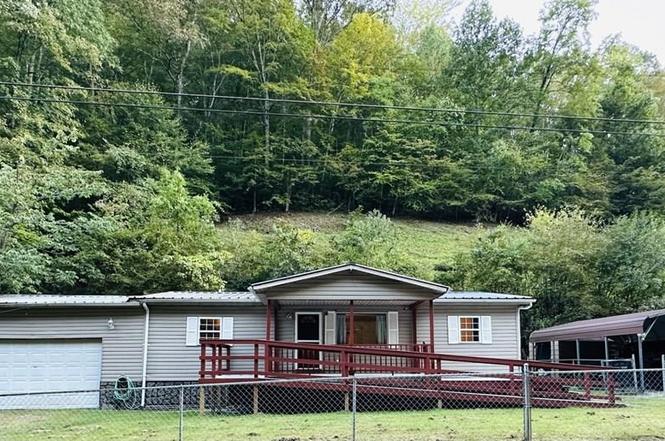
Welcome to this charming 3-bedroom, 1.5-bath home, offering comfort and convenience in a peaceful setting. The property features an attached 2-car garage plus a carport, giving you plenty of space for vehicles and storage. Enjoy the fully fenced yard, perfect for children, pets, or outdoor entertaining. Accessibility is made easy with a wheelchair-friendly ramp leading to the front porch. Inside, you'll find a well-kept home with a practical layout and cozy living spaces. Call today to set up your private showing!
Key facts
- Attached garage
- Carport
- Fully fenced yard
Tags
Property features AI
Exterior
- Parking: 2-car garage
- Utilities: Public water; Septic tank sewer
- Home design: Single Family Residence; Residential property
- Construction: Vinyl siding
- Exterior features: Metal roof; Lot of approximately 0.4 acre
Interior
- Kitchen: Refrigerator; Cooktop
- Flooring: Laminate flooring; Tile flooring
- Bathrooms: 1 full bathroom; 1 half bathroom
- Heating & cooling: Electric heating
- Interior features: 7 total rooms; Storage
Neighborhood map
What this means for you Summary
Snapshot
- This is a 3-bed/1.0-bath single-family listed at $106k.
Deal economics
- At list price, monthly cash flow is $142 ($2k/yr) — positive.
- The deal already cash-flows at list — no discount required.
- Meets the 1% rule at list price ($1k rent vs $106k).
- Recommended offer: $93k (12.0% below list) — sets the bar for market timing.
Location & tenants
- Location reads 58/100 on livability (#438 in KY) — a working-class tenant base; expect higher turnover. Strengths: cost of living A+, housing A+; Watch: amenities F, commute F, employment F.
- Floyd County (rural): math 13% / reading 32% proficiency, ranked #157 of 165 in KY (top 95%) — low school quality limits family demand, transient renter base, plan for 1-2y turnover; 63% free/reduced lunch — lower-income household profile, screen leases tightly.
- Zoned schools: Betsy Layne High School (math 12% / reading 27%, grade F, #213 of 254 statewide, top 86%, 407 students, 74% FRL).
- Market conditions: 15 active listings in the ZIP; 5 units permitted in Floyd County in 2024 (0 in 5+ unit buildings).
Forward outlook
- In year one you build about $2k of equity ($732 loan paydown + $2k appreciation (1.5% local appreciation)).
- Floyd County population projected at -36% by 2050 — secular population decline; favor cash flow + early exit over multi-decade hold.
- At projected returns (1.5% appreciation + 3.0% rent growth), your $30k cash investment doubles in ~7 years — after that, you're playing with house money.
Negotiation context
- It's been on market 263 days — a 12% lower offer ($93k) is reasonable based on typical stale-listing flexibility.
Risks & watch-outs
- Watch-outs: flood insurance adds $66/mo.
- Climate carrying-cost: severe flood risk; severe wildfire risk — expect insurance premiums to compound above CPI over the hold.
Questions for the listing agent
- It's been on market 263 days. Have you received any prior offers? Is the seller open to a 12% concession, seller financing, or rate buy-down credit?
- What's the actual annual flood-insurance premium (NFIP or private), and is the property in a SFHA with mandatory coverage?
- Why hasn't it sold? Are there any deal-killer items the seller is aware of (foundation, flood, title, zoning, code violations)?
- Is there a deadline driving the sale (1031 exchange, divorce, estate, relocation)? That informs how much negotiation room exists.
- Schools are F-rated, which usually means shorter tenancies and higher turnover. Who's the typical renter profile here, and what's been the actual vacancy rate?
- What's the average days-on-market for RENTAL listings here right now (not sales)? A rising rental-DOM trend means longer vacancies and softer asking-rent achievability than the comps imply.
- What's the recent tenant-quality profile in this submarket — average credit score on applications, eviction rate, late-payment / NSF rate, and stable-employment percentage? A property-management company in the area should have these aggregated.
- How much new for-sale + rental construction is in the pipeline within 1–3 miles? Heavy new supply typically softens prices + rents 12–24 months out; constrained supply supports both.
Investment metrics
- 1% rule
- 1.03% ✓
- Cap rate
- 8.66%
- Cash-on-cash
- 8.45%
- DSCR
- 1.38
- GRM
- 8.1
CMA / ARV
No comps found within radius.
Projected returns pro-forma
1.5% appreciation · 3.0% rent growth · sell at horizon
- IRR
- 8.8%
- Equity multiple
- 1.46×
- Total profit
- $13,656
- Equity at exit
- $38,911
- IRR
- 12.3%
- Equity multiple
- 2.58×
- Total profit
- $46,760
- Equity at exit
- $53,914
Cash invested: $29,652 (down + closing). Projections, not guarantees.
Landlord ↔ Tenant lean methodology
- Overall (STATE)
- 83 Strongly Landlord-Friendly
- State Kentucky
- 83 Strongly Landlord-Friendly · R+16
- County
- — inherits STATE
- City
- — inherits STATE
ZIP-level market 41635
- Home prices YoY
- 1.9%
- Active inventory
- 15
- Price-to-rent
- 8.1×
Monthly cashflow live
- Estimated rent
- $1,093 medium interval (Pro) →
- Mortgage (P&I)
- −$555
- Tax from tax record
- −$55 /mo · $660/yr
- Insurance
- −$44
- Flood insurance flood zone
- −$66 /mo · $798/yr
- HOA
- −$0
- Vacancy / Maint / Mgmt
- −$230
- Net cashflow
- $142
Break-even live
UW: 25.0% down · 7.5% · 30yr · 1.5% tax · 5.0% vac · 8.0% maint · 8.0% mgmt
Financing live
Cash to close
- Down payment
- $26,475
- Closing costs
- $3,177
- Reserves months
- —
- Total cash needed
- —
Loan-product check · same deal, 3 products live
Conventional
25% down · 7.5% · 30yr
- Down + closing
- —
- Monthly P&I
- —
- Monthly cashflow
- —
- DSCR
- —
- Eligible?
- —
Personal DTI + credit; lowest rate.
DSCR
20% down · 8.5% · 30yr
- Down + closing
- —
- Monthly P&I
- —
- Monthly cashflow
- —
- DSCR
- —
- Eligible?
- —
No personal income docs; deal must DSCR.
Hard money
10% down · 12.0% · 12mo
- Down + closing
- —
- Monthly P&I
- —
- Monthly cashflow
- —
- DSCR
- —
- Eligible?
- —
Short-term bridge; refi at stabilization.
Listing history 18 events
-
2026-06-18days on market $105,900 Active 263 DOM
-
2026-06-17days on market $105,900 Active 262 DOM
-
2026-06-16days on market $105,900 Active 261 DOM
-
2026-06-15days on market $105,900 Active 260 DOM
-
2026-06-13days on market $105,900 Active 258 DOM
-
2026-06-12days on market $105,900 Active 257 DOM
-
2026-06-09days on market $105,900 Active 254 DOM
-
2026-06-08days on market $105,900 Active 253 DOM
-
2026-06-07days on market $105,900 Active 252 DOM
-
2026-06-07days on market $105,900 Active 251 DOM
-
2026-06-04days on market $105,900 Active 248 DOM
-
2026-06-02days on market $105,900 Active 247 DOM
-
2026-06-01days on market $105,900 Active 246 DOM
-
2026-05-31days on market $105,900 Active 245 DOM
-
2026-05-31days on market $105,900 Active 244 DOM
-
2026-03-14price $105,900
-
2025-12-31price $106,900
-
2025-09-29$108,500 Active
ⓘ Source: listings_history table (triggers on properties + properties_extension) + one-shot
backfill from property_details.listing_events for pre-trigger history.
Tax reassessment forecast KY · Resets to sale price
- Current annual tax
- $660 · $55/mo
- Projected year-2 tax
- $911 · $76/mo
- Expected delta
- +$251/yr (+$21/mo · 38.0%)
ⓘ Screening estimate from a state-policy table — verify with the county assessor before closing.
Climate risk First Street
- Flood 10/10 Extreme FEMA zone X (unshaded) · 99% chance over 30 yrs
- Wildfire 8/10 Severe
- Heat 4/10 Moderate 7 d/yr ≥100°F today · 19 d/yr by 30 yrs out
- Wind 2/10 Low 100% chance of damaging wind over 30 yrs
- Air quality 1/10 Low 0 unhealthy d/yr today · 0 by 30 yrs out
Nearby sold comps map
Loading sold comps map…
Walkable amenities ~0.75 mi
Loading nearby amenities…
Taxation est. · year 1
- Rental income
- $13,115
- − Mortgage interest
- −$5,932
- − Property taxes
- −$660
- − Insurance
- −$1,327
- − Repairs & maintenance
- −$1,049
- − Management
- −$1,049
- − Depreciation
- −$3,081
- Taxable income
- $17
- Est. tax owed @ 24.0%
- −$4
- After-tax cash flow
- $1,705/yr
For passive investors: Depreciation is non-cash, so a rental often shows a tax loss while cash-flowing — sheltering income. Rental losses are passive: they offset passive income freely, and up to $25,000/yr can offset ordinary (W-2) income if you actively participate and your MAGI is under $100k (phasing out to $0 by $150k); unused losses carry forward. On sale, claimed depreciation is recaptured at up to 25%, and gains may owe capital-gains tax (a 1031 exchange can defer both). Figures are a year-1 estimate at your 24.0% rate — not tax advice; consult a CPA.
Schools (NCES district)
- District
- Floyd County
- NCES district ID
- 2101950
- Math proficiency
- 13% ▼ -24.00%
- Reading proficiency
- 32% ▼ -25.00%
- Median HH income
- $29,638
- Composite
- 17.97/100
- National rank
- #8988
- State rank
- #157 of 165 in KY
Livability — McDowell
- Score
- 58/100
- State rank
- #438
- US rank
- #21540
Category grades
Schools grade is shown separately in the Schools card above.
Census & demographics
- City population
- 196
- Population (ZIP)
- 3,314
Population outlook (Floyd County) Hauer SSP2
- Today (2025)
- 33,016 people
- By 2030
- 30,683 · -7.1%
- By 2040
- 25,378 · -23.1%
- By 2050
- 21,013 · -36.4%
- By 2075
- 14,361 · -56.5%
- By 2100
- 10,464 · -68.3%
Race, ethnicity, and origin ACS 2023
- Neighborhood character
- Predominantly White (99%)
- Race & ethnicity
- White 99%
- Common ancestry
- Slovak 3% Serbian 1% Italian 1%
- Foreign-born
- 0%
Political lean MEDSL · Floyd
- 2024 margin
- Solid R (+59.2) · D 19.6% · R 78.8% · Other 1.7%
- 2008→2024 swing
- -57.9pp toward R · 2008: -1.3pp · 2024: -59.2pp
- All cycles
- 2024: R+59.2 2020: R+51.2 2016: R+48.3 2012: R+33.9 2008: R+1.3
Not yet ingested
- Civics
- —
Market trends
- HPI YoY
- ▲ 1.50%
- Current HPI
- 81.8896
- Rent YoY
- —
- Metro
- —
- State GDP YoY
- ▲ 1.81%
- F500 in state
- 4
Industry mix (Fortune 500 HQ in KY)
| Industry | F500 HQs | Revenue |
|---|---|---|
| Healthcare | 1 | $118B |
|
||
| Food / Beverage | 1 | $7B |
|
||
Price history
-2.4% since first listed3 events — show timeline
- 2026-03-14 Price Changed $105,900 EKAR
- 2025-12-31 Price Changed $106,900 EKAR
- 2025-09-29 Listed $108,500 EKAR
Property tax history
+5.0%/yrLatest (2025): $660 · -0.2% YoY. Source: county tax records.
Cash-flow waterfall
monthlySold comps — $/sqft
last 12 mo · ≤1 miLoading sold comps…