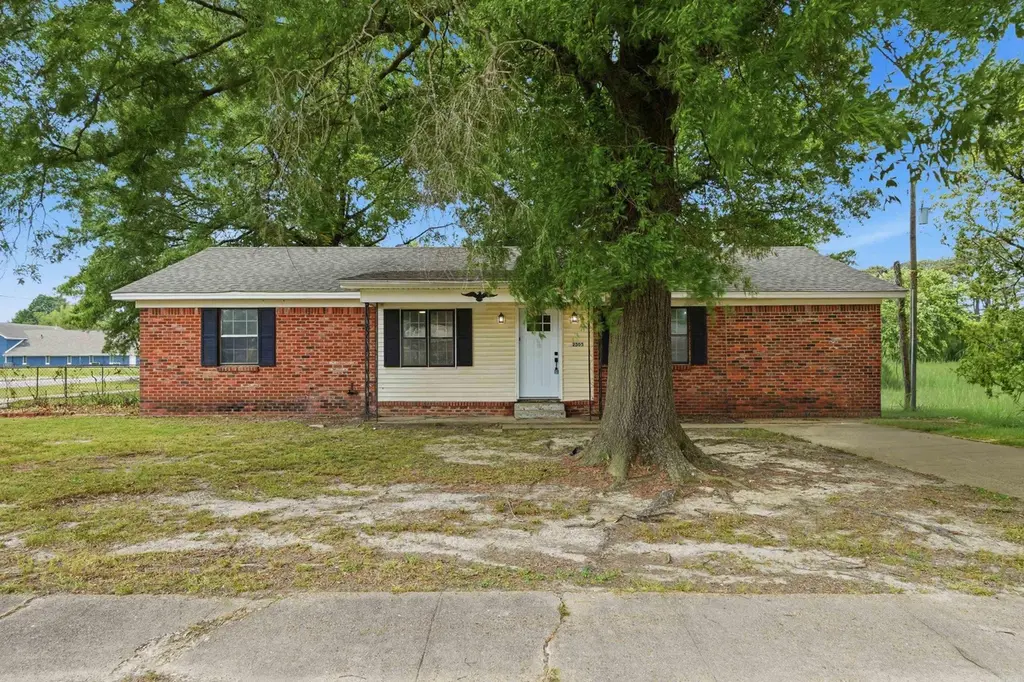
2505 Fairfield · Jonesboro, AR
Flood risk 1/10 · Minimal
- FEMA flood zone
- X
- Chance of flooding over 30 yrs
- 0.0%
- Est. flood insurance / yr
- $507 – $1,088
Fire risk 1/10 · Minimal
- Est. fire insurance / yr
- $1,499 – $2,785
Heat risk 6/10 · Moderate
- Hot days now (above 108°F)
- 7 days/yr
- Hot days in 30 yrs
- 20 days/yr
Wind risk 4/10 · Minor
- Chance of severe wind over 30 yrs
- 8.0%
Air-quality risk 1/10 · Minimal
- Unhealthy air days now
- 0 days/yr
- Unhealthy air days in 30 yrs
- 0 days/yr
Risk factors via First Street. Map © Google.
Why this score? — see what drove the D+ grade
The composite is a weighted blend of 9 inputs, each scored 0–100. Each bar is that input's sub-score; the figure is the points it added to the 100-point composite (weight × sub-score).
- Cash flow +21.8/30.0
- DSCR +7.0/10.0
- 1% rule +4.7/10.0
- Rent growth +3.4/5.0
- Livability +3.2/5.0
- Condition / age +2.5/5.0
- Schools +2.3/10.0
- ARV discount +0.7/15.0
- Appreciation +0.0/10.0
$150,000
🖨 Deal sheet 📄 Offer letter ✓ Due diligence
Listing remarks MLS
3 bedroom, 2 bath centrally located in Jonesboro. Approximately 1516 square feet of living space.
Key facts
- Tile floors
- Dishwasher
- Microwave
Tags
Property features AI
Finance
- Financial info: Finance options include VA, FHA, conventional loans or cash
Exterior
- Parking: Parking pads
- Utilities: Public water; Public sewer
- Home design: Brick and metal/vinyl siding exterior; Inside city limits; Level, corner lot
- Construction: Architectural shingle roof; Other foundation (see remarks)
- Exterior features: Patio; Partially fenced yard with chain link fencing; Paved road access
Interior
- Kitchen: Free‑standing stove; Electric range; Microwave; Dishwasher; Garbage disposal; Pantry
- Flooring: Tile
- Bathrooms: 2 full bathrooms
- Heating & cooling: Central heating; Central cooling
- Interior features: Gas water heater; Ceiling fans
- Laundry & utility: Laundry room
Neighborhood map
What this means for you Summary
Snapshot
- This is a 3-bed/1.0-bath single-family listed at $150k.
Deal economics
- At list price, monthly cash flow is $233 ($3k/yr) — positive.
- The deal already cash-flows at list — no discount required.
- To meet the 1% rule (rent ≥ 1% of price), the offer needs to be $145k (3.2% below list).
- Recommended offer: $145k (3.2% below list) — sets the bar for 1% rule.
- Cap rate 8.2% vs local median 4.4% in Jonesboro — top-decile yield for the area; either an underpriced asset or a hidden risk that comps aren't pricing in. Stress-test before assuming the spread holds.
Location & tenants
- Location reads 65/100 on livability (#145 in AR) — a middle-class / working-renter tenant base. Strengths: cost of living A+, housing A+, health & safety A+; Watch: schools D, crime F, amenities F.
- Jonesboro School District (urban): math 28% / reading 28% proficiency, ranked #169 of 238 in AR (top 71%) — low school quality limits family demand, transient renter base, plan for 1-2y turnover; 67% free/reduced lunch — lower-income household profile, screen leases tightly.
- Market conditions: Rents rising (+3.6%/yr); 295 active listings in the ZIP; 8 comparable units currently listed for rent nearby; rentals lingering (median 44d on market — plan ~5-8 weeks vacancy on turnover, expect pricing pressure); 100% of comp listings sitting > 30 days — soft ceiling on asking rent; 926 units permitted in Craighead County in 2024 (69 in 5+ unit buildings).
- This rent runs 38% of the median local income ($45k/yr) — at the standard rent-burdened threshold; future hikes will face affordability resistance.
Forward outlook
- Local home prices are declining (-3.0%/yr); year-one equity from $1k of loan paydown is wiped out by about $4k of value loss. Plan a longer hold.
- Craighead County population projected at +38% by 2050 — long-run rental-demand tailwind backs the buy-and-hold thesis.
Negotiation context
- Only 4 days on market — expect competitive offers; lowballing is unlikely to land.
- 2 sale attempts since 13y ago with the ask held roughly flat each time — persistent listings suggest the price (not the market) is what's stuck; bring a comps-based counter.
Risks & watch-outs
- Climate carrying-cost: extreme-heat days projected 7→20/yr by 2055 (HVAC capex compounding) — expect insurance premiums to compound above CPI over the hold.
Questions for the listing agent
- Is there a deadline driving the sale (1031 exchange, divorce, estate, relocation)? That informs how much negotiation room exists.
- Schools are D-rated, which usually means shorter tenancies and higher turnover. Who's the typical renter profile here, and what's been the actual vacancy rate?
- Crime grade is F in this area — have there been break-ins, vandalism, or insurance claims at this property in the last 3 years? What carrier currently insures it and at what premium?
- The area grade is low — what's the realistic commute time and amenity access for the typical tenant pool here? Any planned neighborhood developments (good or bad) we should know about?
- What's the average days-on-market for RENTAL listings here right now (not sales)? A rising rental-DOM trend means longer vacancies and softer asking-rent achievability than the comps imply.
- What's the recent tenant-quality profile in this submarket — average credit score on applications, eviction rate, late-payment / NSF rate, and stable-employment percentage? A property-management company in the area should have these aggregated.
- How much new for-sale + rental construction is in the pipeline within 1–3 miles? Heavy new supply typically softens prices + rents 12–24 months out; constrained supply supports both.
Investment metrics
- 1% rule
- 0.97% ✗
- Cap rate
- 8.16%
- Cash-on-cash
- 6.67%
- DSCR
- 1.30
- GRM
- 8.6
CMA / ARV
- ARV (on-the-fly)
- $130,376
- Comps found
- 10
Show comp detail 10 sales within ~0.75 mi
| Address | Dist | Beds/Ba | Sqft | Sold | Price | $/sf | Match |
|---|---|---|---|---|---|---|---|
| 2505 Fairfield | 0.00mi | 3/2.0 | 1,516 (0%) | 0mo | $150,000 | $99 | 96 |
| 3500 Fairview Dr | 0.11mi | 3/1.0 | 1,296 (-14%) | 6mo | $57,500 | $44 | 65 |
| 3200 Meador Rd | 0.20mi | 3/2.0 | 1,348 (-11%) | 4mo | $107,000 | $79 | 65 |
| 3806 School St | 0.46mi | 3/2.0 | 1,397 (-8%) | 4mo | $25,000 | $18 | 58 |
| 3511 Kristal Dr | 0.20mi | 4/2.0 (+1) | 1,720 (+14%) | 2mo | $75,000 | $44 | 57 |
| 2104 Parkside Drive Dr | 0.36mi | 3/2.0 | 1,389 (-8%) | 10mo | $119,900 | $86 | 56 |
| 3123 Fairview Dr | 0.24mi | 4/3.0 (+1) | 1,368 (-10%) | 12mo | $183,900 | $134 | 50 |
| 2122 Sun Cir | 0.35mi | 4/2.5 (+1) | 1,295 (-15%) | 8mo | $117,000 | $90 | 41 |
| 3317 Sun Ave | 0.29mi | 4/1.5 (+1) | 1,333 (-12%) | 22mo | $100,000 | $75 | 41 |
| 3314 Timms St | 0.43mi | 4/2.0 (+1) | 1,295 (-15%) | 10mo | $130,000 | $100 | 38 |
Match score weights: distance 35% · size 25% · config 20% · recency 20%. Top-matched comps best support the ARV.
Projected returns pro-forma
-3.0% appreciation · 3.64% rent growth · sell at horizon
- IRR
- -5.4%
- Equity multiple
- 0.80×
- Total profit
- $-8,550
- Equity at exit
- $22,365
- IRR
- 4.9%
- Equity multiple
- 1.37×
- Total profit
- $15,398
- Equity at exit
- $12,969
Cash invested: $42,000 (down + closing). Projections, not guarantees.
Landlord ↔ Tenant lean methodology
- Overall (STATE)
- 92 Strongly Landlord-Friendly
- State Arkansas
- 92 Strongly Landlord-Friendly · R+14
- County
- — inherits STATE
- City
- — inherits STATE
ZIP-level market 72401
- Home prices YoY
- -34.2%
- Rents YoY
- 3.6%
- Active inventory
- 295
- Price-to-rent
- 8.6×
Monthly cashflow live
- Estimated rent
- $1,453 high interval (Pro) →
- Mortgage (P&I)
- −$787
- Tax from tax record
- −$65 /mo · $781/yr
- Insurance
- −$62
- HOA
- −$0
- Vacancy / Maint / Mgmt
- −$305
- Net cashflow
- $233
Break-even live
UW: 25.0% down · 7.5% · 30yr · 1.5% tax · 5.0% vac · 8.0% maint · 8.0% mgmt
Financing live
Cash to close
- Down payment
- $37,500
- Closing costs
- $4,500
- Reserves months
- —
- Total cash needed
- —
Loan-product check · same deal, 3 products live
Conventional
25% down · 7.5% · 30yr
- Down + closing
- —
- Monthly P&I
- —
- Monthly cashflow
- —
- DSCR
- —
- Eligible?
- —
Personal DTI + credit; lowest rate.
DSCR
20% down · 8.5% · 30yr
- Down + closing
- —
- Monthly P&I
- —
- Monthly cashflow
- —
- DSCR
- —
- Eligible?
- —
No personal income docs; deal must DSCR.
Hard money
10% down · 12.0% · 12mo
- Down + closing
- —
- Monthly P&I
- —
- Monthly cashflow
- —
- DSCR
- —
- Eligible?
- —
Short-term bridge; refi at stabilization.
Rent comps 8 comps
| Address | Beds | Baths | Sqft | Rent | $/sqft | DOM | Units | Dist |
|---|---|---|---|---|---|---|---|---|
| 2017 Fairfield Dr Jonesboro, AR | 3.0 | 1.5 | 1180 | $1,250 | $1.06 | 44d | 1 | 0.38mi |
| 3717 Glitterman Dr Jonesboro, AR | 4.0 | 2.0 | 1544 | $1,595 | $1.03 | 44d | 1 | 1.08mi |
| 3622 Hargis Dr Jonesboro, AR | 3.0 | 2.0 | 1143 | $1,495 | $1.31 | 44d | 1 | 1.15mi |
| 3809 Travers Ln Jonesboro, AR | 3.0 | 2.0 | 1243 | $1,550 | $1.25 | 44d | 1 | 1.18mi |
| 3817 Keeneland Dr Jonesboro, AR | 3.0 | 2.0 | 1355 | $1,525 | $1.13 | 44d | 1 | 1.19mi |
| 3840 Travers Ln Jonesboro, AR | 3.0 | 2.0 | 1243 | $1,525 | $1.23 | 44d | 1 | 1.29mi |
| 3719 Stadium Blvd Unit J10 Jonesboro, AR | 2.0 | 1.0 | 1100 | $1,144 | $1.04 | 44d | 1 | 1.45mi |
| 3719 Stadium Blvd Unit E20 Jonesboro, AR | 3.0 | 2.0 | 1350 | $1,294 | $0.96 | 44d | 1 | 1.50mi |
Listing history 7 events
-
2026-05-07status Under Contract
-
2026-05-02$150,000 New Listing
-
2023-12-13soldstatus $1,095,000
-
2022-12-16soldstatus $300,000
-
2013-07-31soldstatus $50,000 97-char remark
Show marketing remark (97 chars)
3 bedroom, 2 bath centrally located in Jonesboro. Approximately 1516 square feet of living space.
-
2013-06-07$52,900 97-char remark
Show marketing remark (97 chars)
3 bedroom, 2 bath centrally located in Jonesboro. Approximately 1516 square feet of living space.
-
2006-01-03soldstatus $72,000
ⓘ Source: listings_history table (triggers on properties + properties_extension) + one-shot
backfill from property_details.listing_events for pre-trigger history.
Tax reassessment forecast AR · Resets to sale price
- Current annual tax
- $781 · $65/mo
- Projected year-2 tax
- $960 · $80/mo
- Expected delta
- +$179/yr (+$15/mo · 23.0%)
ⓘ Screening estimate from a state-policy table — verify with the county assessor before closing.
Climate risk First Street
- Flood 1/10 Low FEMA zone X · 0% chance over 30 yrs
- Wildfire 1/10 Low
- Heat 6/10 Major 7 d/yr ≥108°F today · 20 d/yr by 30 yrs out
- Wind 4/10 Moderate 8% chance of damaging wind over 30 yrs
- Air quality 1/10 Low 0 unhealthy d/yr today · 0 by 30 yrs out
Nearby sold comps map
Loading sold comps map…
Walkable amenities ~0.75 mi
Loading nearby amenities…
Taxation est. · year 1
- Rental income
- $17,432
- − Mortgage interest
- −$8,402
- − Property taxes
- −$781
- − Insurance
- −$750
- − Repairs & maintenance
- −$1,395
- − Management
- −$1,395
- − Depreciation
- −$4,364
- Taxable income
- $346
- Est. tax owed @ 24.0%
- −$83
- After-tax cash flow
- $2,718/yr
For passive investors: Depreciation is non-cash, so a rental often shows a tax loss while cash-flowing — sheltering income. Rental losses are passive: they offset passive income freely, and up to $25,000/yr can offset ordinary (W-2) income if you actively participate and your MAGI is under $100k (phasing out to $0 by $150k); unused losses carry forward. On sale, claimed depreciation is recaptured at up to 25%, and gains may owe capital-gains tax (a 1031 exchange can defer both). Figures are a year-1 estimate at your 24.0% rate — not tax advice; consult a CPA.
Schools (NCES district)
- District
- Jonesboro School District
- NCES district ID
- 0508280
- Math proficiency
- 28% ▼ -9.00%
- Reading proficiency
- 28% ▼ -8.00%
- Median HH income
- $34,347
- Composite
- 23.06/100
- National rank
- #7967
- State rank
- #169 of 238 in AR
Livability — Jonesboro
- Score
- 65/100
- State rank
- #145
- US rank
- #12692
Category grades
Schools grade is shown separately in the Schools card above.
Census & demographics
- Census place
- Jonesboro, AR
- County
- Craighead County · 97,185 people
- City population
- 91,245
- Metro
- Jonesboro, AR
- Population (ZIP)
- 42,602
- Household income
- $45,329
- Rent vs Own
- Severe rent burden
- 2606.0
Population outlook (Craighead County) Hauer SSP2
- Today (2025)
- 122,235 people
- By 2030
- 131,338 · +7.4%
- By 2040
- 149,862 · +22.6%
- By 2050
- 168,034 · +37.5%
- By 2075
- 208,094 · +70.2%
- By 2100
- 233,251 · +90.8%
Race, ethnicity, and origin ACS 2023
- Neighborhood character
- Diverse neighborhood (Simpson 0.56)
- Race & ethnicity
- White 60% Black 26% Hispanic / Latino 9% Two or more races 7%
- Hispanic origin (detail)
- Mexican 8%
- Common ancestry
- Slovak 2% Italian 1% Lithuanian 1%
- Foreign-born
- 4% · Canada
- Languages at home
- 92% English-only · Spanish 7%
Political lean MEDSL · Craighead
- 2024 margin
- Solid R (+37.4) · D 30.1% · R 67.5% · Other 2.4%
- 2008→2024 swing
- -12.9pp toward R · 2008: -24.5pp · 2024: -37.4pp
- All cycles
- 2024: R+37.4 2020: R+35.4 2016: R+35.2 2012: R+31.1 2008: R+24.5
Not yet ingested
- Civics
- —
Market trends
- HPI YoY
- ▼ -108.25%
- Current HPI
- 208.2079
- Rent YoY
- ▲ 3.64%
- Metro
- Jonesboro, AR
- State GDP YoY
- ▲ 3.80%
- F500 in state
- 10
Industry mix (Fortune 500 HQ in AR)
| Industry | F500 HQs | Revenue |
|---|---|---|
| Retail | 1 | $681B |
|
||
| Food / Agriculture | 1 | $53B |
|
||
| Retail / Energy | 1 | $22B |
|
||
| Transportation / Logistics | 1 | $12B |
|
||
| Energy | 1 | $4B |
|
||
Price history
+108.3% since first listed7 events — show timeline
- 2026-05-07 Pending — CARMLS
- 2026-05-02 Listed $150,000 CARMLS
- 2023-12-13 Sold (Public Records) $1,095,000 Public Records
- 2022-12-16 Sold (Public Records) $300,000 Public Records
- 2013-07-31 Sold (MLS) $50,000 CARMLS
- 2013-06-07 Listed $52,900 CARMLS
- 2006-01-03 Sold (Public Records) $72,000 Public Records
Property tax history
+4.3%/yrLatest (2025): $781 · +0.0% YoY. Source: county tax records.
Cash-flow waterfall
monthlySold comps — $/sqft
last 12 mo · ≤1 miLoading sold comps…