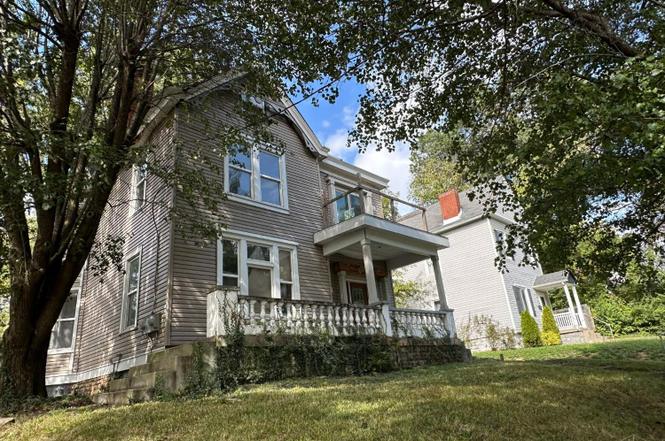
435 Purcell Ave · Cincinnati, OH
Flood risk 1/10 · Minimal
- FEMA flood zone
- X (unshaded)
- Chance of flooding over 30 yrs
- 0.0%
- Est. flood insurance / yr
- $473 – $860
Fire risk 1/10 · Minimal
- Est. fire insurance / yr
- $713 – $1,323
Heat risk 4/10 · Minor
- Hot days now (above 102°F)
- 7 days/yr
- Hot days in 30 yrs
- 19 days/yr
Wind risk 2/10 · Minimal
- Chance of severe wind over 30 yrs
- 1.0%
Air-quality risk 3/10 · Minor
- Unhealthy air days now
- 3 days/yr
- Unhealthy air days in 30 yrs
- 5 days/yr
Risk factors via First Street. Map © Google.
Why this score? — see what drove the C grade
The composite is a weighted blend of 9 inputs, each scored 0–100. Each bar is that input's sub-score; the figure is the points it added to the 100-point composite (weight × sub-score).
- Cash flow +25.1/30.0
- DSCR +8.2/10.0
- ARV discount +7.5/15.0
- 1% rule +6.6/10.0
- Livability +4.0/5.0
- Rent growth +3.3/5.0
- Schools +2.5/10.0
- Condition / age +2.5/5.0
- Appreciation +0.0/10.0
$169,000
🖨 Deal sheet (PDF) 📄 Offer letter ✓ Due diligence
Listing remarks MLS
2 units with solid bones. Both units currently occupied. A money maker with room to push CAP rates higher.
Key facts
- 8,668 sq ft lot
- Built 1895
- Listed 220 days
Property features AI
Finance
- Other: Zoned residential
- HOA & community: No HOA
Exterior
- Utilities: Public water; Public sewer; Natural gas service; Gas heating; Gas water heating
- Home design: Traditional single-family home; One main level with additional upper floors; Second floor area documented (1,361 sq ft)
- Construction: Stone foundation
- Exterior features: Shingle roof; Vinyl siding; Energy-efficient windows including Low-E and double-hung styles
Interior
- Kitchen: Kitchen approximately 10 x 10
- Bedrooms: 5 bedrooms total; Primary bedroom approximately 12 x 12 (on level 2); Bedroom 2 approximately 10 x 10 (on level 2); Bedroom 3 approximately 12 x 10 (on level 2); Bedroom 4 approximately 12 x 10 (on level 2); Bedroom 5 approximately 12 x 15 (on level 3)
- Bathrooms: 2 full bathrooms; Full bathroom on level 1; Full bathroom on level 2; Primary bathroom: other configuration
- Interior features: 12 total rooms; Basement with finished/usable space (1,385 sq ft)
Neighborhood map
What this means for you Summary
Snapshot
- This is a 5-bed/2.0-bath single-family listed at $169k.
Deal economics
- At list price, monthly cash flow is $373 ($4k/yr) — positive.
- The deal already cash-flows at list — no discount required.
- Meets the 1% rule at list price ($2k rent vs $169k).
- Recommended offer: $149k (12.0% below list) — sets the bar for market timing.
- Cap rate 8.9% vs local median 3.9% in Cincinnati — top-decile yield for the area; either an underpriced asset or a hidden risk that comps aren't pricing in. Stress-test before assuming the spread holds.
Location & tenants
- Location reads 80/100 on livability (#130 in OH, #1,856 nationally) — a professional / high-income tenant draw. Strengths: amenities A+, commute A+, cost of living A+; Watch: employment D, crime F.
- Cincinnati Public Schools (urban): math 25% / reading 36% proficiency, ranked #581 of 656 in OH (top 89%) — families likely to look elsewhere, expect single-tenant / working-renter base with shorter leases; 70% free/reduced lunch — lower-income household profile, screen leases tightly.
- Zoned schools: Roberts Academy (math 16% / reading 22%, grade F, #1,320 of 1,584 statewide, top 83%, 765 students, 0% FRL); Hartwell School (math 17% / reading 31%, grade F, #593 of 654 statewide, top 91%, 447 students, 0% FRL); Walnut Hills High School (math 79% / reading 89%, grade A, #17 of 781 statewide, top 2%, 2,582 students, 14% FRL) — zoned schools average 5% FRL vs 70% district-wide (66 pts lower); this property's tenant base skews higher-income than the district average.
- Market conditions: Rents rising (+3.3%/yr); 70 active listings in the ZIP; lower-income renter base — watch delinquency; 801 units permitted in Hamilton County in 2024 (190 in 5+ unit buildings).
- At $1,956/mo this rent would consume 54% of the median local household income ($44k/yr) (locally 980% of renters already pay >50% of income on rent) — very limited rent-growth headroom before tenants either downsize or default.
Forward outlook
- Local home prices are declining (-3.0%/yr); year-one equity from $1k of loan paydown is wiped out by about $5k of value loss. Plan a longer hold.
Negotiation context
- It's been on market 220 days — a 12% lower offer ($149k) is reasonable based on typical stale-listing flexibility.
- 11 sale attempts since 21y ago; this cycle's ask has dropped $60k (26%) from the opening price — seller is motivated, your offer sets the floor, not the list.
- Current owner paid $52k; list at $169k implies a 225% gain — meaningful room to come down on a strong offer.
Risks & watch-outs
- Watch-outs: built in 1895 — expect roof / HVAC / electrical / plumbing capex.
Questions for the listing agent
- It's been on market 220 days. Have you received any prior offers? Is the seller open to a 12% concession, seller financing, or rate buy-down credit?
- Built in 1895 — when were the roof, HVAC, electrical panel, plumbing, and water heater last replaced?
- Why hasn't it sold? Are there any deal-killer items the seller is aware of (foundation, flood, title, zoning, code violations)?
- Is there a deadline driving the sale (1031 exchange, divorce, estate, relocation)? That informs how much negotiation room exists.
- Schools are B-rated — typically a magnet for longer-tenancy family renters. What's the average tenant stay here, and is there a school-zone premium baked into asking?
- Crime grade is F in this area — have there been break-ins, vandalism, or insurance claims at this property in the last 3 years? What carrier currently insures it and at what premium?
- What's the average days-on-market for RENTAL listings here right now (not sales)? A rising rental-DOM trend means longer vacancies and softer asking-rent achievability than the comps imply.
- What's the recent tenant-quality profile in this submarket — average credit score on applications, eviction rate, late-payment / NSF rate, and stable-employment percentage? A property-management company in the area should have these aggregated.
- How much new for-sale + rental construction is in the pipeline within 1–3 miles? Heavy new supply typically softens prices + rents 12–24 months out; constrained supply supports both.
Investment metrics
- 1% rule
- 1.16% ✓
- Cap rate
- 8.94%
- Cash-on-cash
- 9.47%
- DSCR
- 1.42
- GRM
- 7.2
CMA / ARV
- ARV (on-the-fly)
- $349,067
- Comps found
- 1
Show comp detail 1 sale within ~0.75 mi
| Address | Dist | Beds/Ba | Sqft | Sold | Price | $/sf | Match |
|---|---|---|---|---|---|---|---|
| 525 Hawthorne Ave | 0.15mi | 5/4.0 | 3,205 (-5%) | 24mo | $329,000 | $103 | 56 |
Match score weights: distance 35% · size 25% · config 20% · recency 20%. Top-matched comps best support the ARV.
Projected returns pro-forma
-3.0% appreciation · 3.3% rent growth · sell at horizon
- IRR
- -1.7%
- Equity multiple
- 0.94×
- Total profit
- $-2,982
- Equity at exit
- $25,198
- IRR
- 8.4%
- Equity multiple
- 1.65×
- Total profit
- $30,598
- Equity at exit
- $14,612
Cash invested: $47,320 (down + closing). Projections, not guarantees.
Landlord ↔ Tenant lean methodology
- Overall (STATE)
- 73 Landlord-Friendly
- State Ohio
- 73 Landlord-Friendly · R+6
- County
- — inherits STATE
- City
- — inherits STATE
ZIP-level market 45205
- Rents YoY
- 3.3%
- Active inventory
- 70
- Price-to-rent
- 7.2×
Monthly cashflow live
- Estimated rent
- $1,956 medium interval (Pro) →
- Mortgage (P&I)
- −$886
- Tax from tax record
- −$215 /mo · $2,585/yr
- Insurance
- −$70
- HOA
- −$0
- Vacancy / Maint / Mgmt
- −$411
- Net cashflow
- $373
Break-even live
Sensitivity live
| Price | -10% $469 | -5% $421 | +0% $373 | +5% $326 | +10% $278 |
|---|---|---|---|---|---|
| Rent | -10% $219 | -5% $296 | +0% $373 | +5% $451 | +10% $528 |
| Rate | -1.0pp $458 | -0.5pp $416 | base $373 | +0.5pp $330 | +1.0pp $285 |
UW: 25.0% down · 7.5% · 30yr · 1.5% tax · 5.0% vac · 8.0% maint · 8.0% mgmt
Financing live
Cash to close
- Down payment
- $42,250
- Closing costs
- $5,070
- Reserves months
- —
- Total cash needed
- —
Loan-product check · same deal, 3 products live
Conventional
25% down · 7.5% · 30yr
- Down + closing
- —
- Monthly P&I
- —
- Monthly cashflow
- —
- DSCR
- —
- Eligible?
- —
Personal DTI + credit; lowest rate.
DSCR
20% down · 8.5% · 30yr
- Down + closing
- —
- Monthly P&I
- —
- Monthly cashflow
- —
- DSCR
- —
- Eligible?
- —
No personal income docs; deal must DSCR.
Hard money
10% down · 12.0% · 12mo
- Down + closing
- —
- Monthly P&I
- —
- Monthly cashflow
- —
- DSCR
- —
- Eligible?
- —
Short-term bridge; refi at stabilization.
Listing history 46 events
-
2026-06-21days on market $169,000 Active 220 DOM
-
2026-06-18days on market $169,000 Active 217 DOM
-
2026-06-17days on market $169,000 Active 216 DOM
-
2026-06-16days on market $169,000 Active 215 DOM
-
2026-06-15days on market $169,000 Active 214 DOM
-
2026-06-13days on market $169,000 Active 212 DOM
-
2026-06-13days on market $169,000 Active 211 DOM
-
2026-06-09days on market $169,000 Active 208 DOM
-
2026-06-08days on market $169,000 Active 207 DOM
-
2026-06-07days on market $169,000 Active 206 DOM
-
2026-06-03days on market $169,000 Active 202 DOM
-
2026-06-02days on market $169,000 Active 201 DOM
-
2026-06-01days on market $169,000 Active 200 DOM
-
2026-05-31days on market $169,000 Active 199 DOM
-
2026-04-06price $169,000
-
2026-03-09price $189,000
-
2026-02-10price $199,000
-
2025-11-13$229,000 Active
-
2018-07-19soldstatus $52,000
-
2018-07-16soldstatus $52,000 Sold 106-char remark
Show marketing remark (106 chars)
2 units with solid bones. Both units currently occupied. A money maker with room to push CAP rates higher.
-
2018-06-21historical Accept Backup Offers 106-char remark
Show marketing remark (106 chars)
2 units with solid bones. Both units currently occupied. A money maker with room to push CAP rates higher.
-
2018-06-12$45,000 Active 106-char remark
Show marketing remark (106 chars)
2 units with solid bones. Both units currently occupied. A money maker with room to push CAP rates higher.
-
2018-01-10historical
-
2017-12-15status Active
-
2017-09-27historical Accept Backup Offers
-
2017-08-24status Active
-
2017-08-11historical Accept Backup Offers
-
2017-07-11$55,000 Active
-
2017-02-28historical Accept Backup Offers
-
2017-02-27historical
-
2017-01-17$59,900 Active
-
2016-12-31historical
-
2016-09-21$59,900 Active
-
2016-09-08historical
-
2016-07-21price $59,900
-
2016-06-21price $64,900
-
2016-04-14$69,900 Active
-
2010-07-28soldstatus $70,000
-
2008-12-10soldstatus $23,000
-
2008-11-28soldstatus $15,000
-
2008-08-15$27,000
-
2008-02-28historical
-
2007-02-27$65,000
-
2005-11-29soldstatus $115,000
-
2005-05-06soldstatus $51,000
-
2005-03-31$49,900
ⓘ Source: listings_history table (triggers on properties + properties_extension) + one-shot
backfill from property_details.listing_events for pre-trigger history.
Tax reassessment forecast OH · Partial reset (capped growth)
- Current annual tax
- $2,585 · $215/mo
- Projected year-2 tax
- $2,611 · $218/mo
- Expected delta
- +$26/yr (+$2/mo · 1.0%)
ⓘ Screening estimate from a state-policy table — verify with the county assessor before closing.
Climate risk First Street
- Flood 1/10 Low FEMA zone X (unshaded) · 0% chance over 30 yrs
- Wildfire 1/10 Low
- Heat 4/10 Moderate 7 d/yr ≥102°F today · 19 d/yr by 30 yrs out
- Wind 2/10 Low 100% chance of damaging wind over 30 yrs
- Air quality 3/10 Moderate 3 unhealthy d/yr today · 5 by 30 yrs out
Nearby sold comps map
Loading sold comps map…
Walkable amenities ~0.75 mi
Loading nearby amenities…
Taxation est. · year 1
- Rental income
- $23,475
- − Mortgage interest
- −$9,467
- − Property taxes
- −$2,585
- − Insurance
- −$845
- − Repairs & maintenance
- −$1,878
- − Management
- −$1,878
- − Depreciation
- −$4,916
- Taxable income
- $1,906
- Est. tax owed @ 24.0%
- −$457
- After-tax cash flow
- $4,023/yr
For passive investors: Depreciation is non-cash, so a rental often shows a tax loss while cash-flowing — sheltering income. Rental losses are passive: they offset passive income freely, and up to $25,000/yr can offset ordinary (W-2) income if you actively participate and your MAGI is under $100k (phasing out to $0 by $150k); unused losses carry forward. On sale, claimed depreciation is recaptured at up to 25%, and gains may owe capital-gains tax (a 1031 exchange can defer both). Figures are a year-1 estimate at your 24.0% rate — not tax advice; consult a CPA.
Schools (NCES district)
- District
- Cincinnati Public Schools
- NCES district ID
- 3904375
- Math proficiency
- 25% ▼ -19.00%
- Reading proficiency
- 36% ▼ -14.00%
- Median HH income
- $35,743
- Composite
- 25.21/100
- National rank
- #7508
- State rank
- #581 of 656 in OH
Livability — Cincinnati
- Score
- 80/100
- State rank
- #130
- US rank
- #1856
Category grades
Schools grade is shown separately in the Schools card above.
Census & demographics
- Census place
- Cincinnati, OH
- County
- Hamilton County · 701,295 people
- City population
- 505,555
- Metro
- Cincinnati, OH-KY-IN
- Population (ZIP)
- 18,651
- Household income
- $43,682
- Rent vs Own
- Severe rent burden
- 980.0
Population outlook (Hamilton County) Hauer SSP2
- Today (2025)
- 826,054 people
- By 2030
- 830,947 · +0.6%
- By 2040
- 832,319 · +0.8%
- By 2050
- 822,428 · -0.4%
- By 2075
- 788,688 · -4.5%
- By 2100
- 710,674 · -14.0%
Race, ethnicity, and origin ACS 2023
- Neighborhood character
- Diverse neighborhood (Simpson 0.69)
- Race & ethnicity
- Black 43% White 32% Hispanic / Latino 16% Two or more races 7% Asian 2%
- Hispanic origin (detail)
- Mexican 2%
- Common ancestry
- Lithuanian 1% Slovak 1% Serbian 1%
- Foreign-born
- 9% · Canada, India, China
- Languages at home
- 84% English-only · Spanish 10% Other Asian/Pacific 2% Other Indo-European 1%
Political lean MEDSL · Hamilton
- 2024 margin
- D (+14.9) · D 57.0% · R 42.1%
- 2008→2024 swing
- +7.9pp toward D · 2008: 7.0pp · 2024: 14.9pp
- All cycles
- 2024: D+14.9 2020: D+15.9 2016: D+9.5 2012: D+4.9 2008: D+7.0
Not yet ingested
- Civics
- —
Market trends
- HPI YoY
- ▼ -138.67%
- Current HPI
- 163.3375
- Rent YoY
- ▲ 3.30%
- Metro
- Cincinnati, OH-KY-IN
- State GDP YoY
- ▲ 1.98%
- F500 in state
- 48
Industry mix (Fortune 500 HQ in OH)
| Industry | F500 HQs | Revenue |
|---|---|---|
| Insurance | 3 | $145B |
|
||
| Industrial Machinery | 3 | $49B |
|
||
| Financial Services | 3 | $24B |
|
||
| Consumer Goods | 2 | $93B |
|
||
| Aerospace / Defense | 2 | $47B |
|
||
| Utilities | 2 | $33B |
|
||
Price history
+238.7% since first listed32 events — show timeline
- 2026-04-06 Price Changed $169,000 Cincy MLS
- 2026-03-09 Price Changed $189,000 Cincy MLS
- 2026-02-10 Price Changed $199,000 Cincy MLS
- 2025-11-13 Listed $229,000 Cincy MLS
- 2018-07-19 Sold (Public Records) $52,000 Public Records
- 2018-07-16 Sold (MLS) $52,000 Cincy MLS
- 2018-06-21 Contingent — Cincy MLS
- 2018-06-12 Listed $45,000 Cincy MLS
- 2018-01-10 Listing Removed — Cincy MLS
- 2017-12-15 Relisted — Cincy MLS
- 2017-09-27 Contingent — Cincy MLS
- 2017-08-24 Relisted — Cincy MLS
- 2017-08-11 Contingent — Cincy MLS
- 2017-07-11 Listed $55,000 Cincy MLS
- 2017-02-28 Contingent — Cincy MLS
- 2017-02-27 Listing Removed — Cincy MLS
- 2017-01-17 Listed $59,900 Cincy MLS
- 2016-12-31 Listing Removed — Cincy MLS
- 2016-09-21 Listed $59,900 Cincy MLS
- 2016-09-08 Listing Removed — Cincy MLS
- 2016-07-21 Price Changed $59,900 Cincy MLS
- 2016-06-21 Price Changed $64,900 Cincy MLS
- 2016-04-14 Listed $69,900 Cincy MLS
- 2010-07-28 Sold (Public Records) $70,000 Public Records
- 2008-12-10 Sold (Public Records) $23,000 Public Records
- 2008-11-28 Sold (MLS) $15,000 Cincy MLS
- 2008-08-15 Listed $27,000 Cincy MLS
- 2008-02-28 Listing Removed — Cincy MLS
- 2007-02-27 Listed $65,000 Cincy MLS
- 2005-11-29 Sold (Public Records) $115,000 Public Records
- 2005-05-06 Sold (MLS) $51,000 Cincy MLS
- 2005-03-31 Listed $49,900 Cincy MLS
Property tax history
+4.4%/yrLatest (2025): $2,585 · +24.4% YoY. Source: county tax records.
Cash-flow waterfall
monthlySold comps — $/sqft
last 12 mo · ≤1 miLoading sold comps…