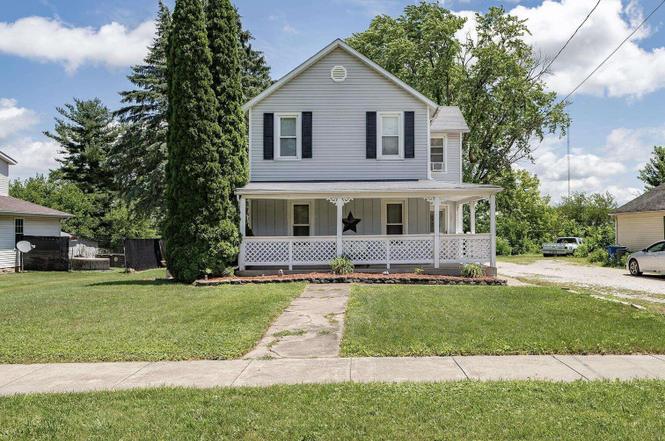
108 N Poplar St · Cambridge, IL
Flood risk 1/10 · Minimal
- FEMA flood zone
- X (unshaded)
- Chance of flooding over 30 yrs
- 0.0%
- Est. flood insurance / yr
- $473 – $860
Fire risk 1/10 · Minimal
- Est. fire insurance / yr
- $804 – $1,492
Heat risk 3/10 · Minor
- Hot days now (above 103°F)
- 7 days/yr
- Hot days in 30 yrs
- 17 days/yr
Wind risk 2/10 · Minimal
- Chance of severe wind over 30 yrs
- —
Air-quality risk 3/10 · Minor
- Unhealthy air days now
- 2 days/yr
- Unhealthy air days in 30 yrs
- 3 days/yr
Risk factors via First Street. Map © Google.
Why this score? — see what drove the C grade
The composite is a weighted blend of 9 inputs, each scored 0–100. Each bar is that input's sub-score; the figure is the points it added to the 100-point composite (weight × sub-score).
- Cash flow +14.3/30.0
- ARV discount +13.9/15.0
- Appreciation +9.2/10.0
- 1% rule +5.2/10.0
- DSCR +4.3/10.0
- Livability +3.3/5.0
- Schools +2.9/10.0
- Rent growth +2.5/5.0
- Condition / age +2.5/5.0
$129,000
🖨 Deal sheet 📄 Offer letter ✓ Due diligence
Listing remarks MLS
Lovely Remodeled 3 Bedroom/2 Bath Home! Large Kitchen complete with vaulted ceilings and hickory cabinets. Main Floor Master Bedroom & Laundry Room. Rustic accents, solid oak interior doors, Oversize heated garage w/ finished game room, large shed. Call Today to Schedule a Showing!
Key facts
- 2 garage spots
- Built 1917
Neighborhood map
What this means for you Summary
Snapshot
- This is a 3-bed/1.0-bath single-family listed at $129k.
Deal economics
- At list price, monthly cash flow is $23 ($277/yr) — positive.
- The deal already cash-flows at list — no discount required.
- Meets the 1% rule at list price ($1k rent vs $129k).
Location & tenants
- Location reads 66/100 on livability (#584 in IL) — a middle-class / working-renter tenant base. Strengths: crime A+, cost of living A+, housing A+; Watch: schools F, amenities F, commute F.
- Cambridge CUSD 227 (rural): math 28% / reading 37% proficiency, ranked #215 of 620 in IL (top 35%) — families likely to look elsewhere, expect single-tenant / working-renter base with shorter leases.
- Market conditions: 15 active listings in the ZIP; 32 units permitted in Henry County in 2024 (0 in 5+ unit buildings).
Forward outlook
- In year one you build about $12k of equity ($892 loan paydown + $11k appreciation (8.3% local appreciation)).
- Henry County population projected at -16% by 2050 — secular population decline; favor cash flow + early exit over multi-decade hold.
- At projected returns (8.3% appreciation + 3.0% rent growth), your $36k cash investment doubles in ~3 years — after that, you're playing with house money.
- By year 4, paydown + projected appreciation supports a ~$41k cash-out refi (75% LTV) — recoverable capital for the next deal without selling this one.
Negotiation context
- Only 0 days on market — expect competitive offers; lowballing is unlikely to land.
- 7 sale attempts since 9y ago with the ask held roughly flat each time — persistent listings suggest the price (not the market) is what's stuck; bring a comps-based counter.
Risks & watch-outs
- Watch-outs: property tax is 2.7% of price; built in 1917 — expect roof / HVAC / electrical / plumbing capex.
Questions for the listing agent
- Built in 1917 — when were the roof, HVAC, electrical panel, plumbing, and water heater last replaced?
- Property tax is high relative to price — has the assessment been appealed recently, and will the sale trigger a re-assessment?
- Is there a deadline driving the sale (1031 exchange, divorce, estate, relocation)? That informs how much negotiation room exists.
- Schools are F-rated, which usually means shorter tenancies and higher turnover. Who's the typical renter profile here, and what's been the actual vacancy rate?
- What's the average days-on-market for RENTAL listings here right now (not sales)? A rising rental-DOM trend means longer vacancies and softer asking-rent achievability than the comps imply.
- What's the recent tenant-quality profile in this submarket — average credit score on applications, eviction rate, late-payment / NSF rate, and stable-employment percentage? A property-management company in the area should have these aggregated.
- How much new for-sale + rental construction is in the pipeline within 1–3 miles? Heavy new supply typically softens prices + rents 12–24 months out; constrained supply supports both.
Investment metrics
- 1% rule
- 1.02% ✓
- Cap rate
- 6.51%
- Cash-on-cash
- 0.77%
- DSCR
- 1.03
- GRM
- 8.2
CMA / ARV
- ARV (on-the-fly)
- $150,232
- Comps found
- 12
Show comp detail 12 sales within ~0.75 mi
| Address | Dist | Beds/Ba | Sqft | Sold | Price | $/sf | Match |
|---|---|---|---|---|---|---|---|
| 108 N Poplar St | 0.00mi | 3/2.0 | 1,688 (0%) | 5mo | $128,500 | $76 | 92 |
| 410 E North St | 0.23mi | 4/1.5 (+1) | 1,456 (-14%) | 2mo | $119,900 | $82 | 58 |
| 204 W Locust St | 0.52mi | 3/1.5 | 1,488 (-12%) | 4mo | $110,000 | $74 | 51 |
| 316 W North St | 0.68mi | 3/1.5 | 1,836 (+9%) | 2mo | $190,000 | $103 | 50 |
| 419 N Main St | 0.69mi | 3/1.0 | 1,599 (-5%) | 12mo | $145,000 | $91 | 49 |
| 315 N East St | 0.53mi | 3/2.0 | 1,472 (-13%) | 5mo | $12,250 | $8 | 45 |
| 212 S East St | 0.53mi | 4/1.5 (+1) | 1,524 (-10%) | 11mo | $136,000 | $89 | 43 |
| 314 W Locust St | 0.64mi | 3/1.5 | 1,900 (+13%) | 7mo | $129,900 | $68 | 42 |
| 315 W Locust St | 0.64mi | 4/1.0 (+1) | 1,488 (-12%) | 6mo | $75,000 | $50 | 41 |
| 204 Maple St | 0.44mi | 4/3.0 (+1) | 1,472 (-13%) | 13mo | $200,000 | $136 | 34 |
| 205 S West St | 0.70mi | 3/1.0 | 1,440 (-15%) | 18mo | $130,000 | $90 | 28 |
| 205 S West St | 0.70mi | 3/1.0 | 1,440 (-15%) | 18mo | $130,000 | $90 | 28 |
Match score weights: distance 35% · size 25% · config 20% · recency 20%. Top-matched comps best support the ARV.
Projected returns pro-forma
8.34% appreciation · 3.0% rent growth · sell at horizon
- IRR
- 21.3%
- Equity multiple
- 2.59×
- Total profit
- $57,526
- Equity at exit
- $101,003
- IRR
- 19.6%
- Equity multiple
- 5.60×
- Total profit
- $166,175
- Equity at exit
- $203,420
Cash invested: $36,120 (down + closing). Projections, not guarantees.
Landlord ↔ Tenant lean methodology
- Overall (STATE)
- 43 Moderately Tenant-Leaning
- State Illinois
- 43 Moderately Tenant-Leaning · D+7
- County
- — inherits STATE
- City
- — inherits STATE
ZIP-level market 61238
- Home prices YoY
- 3.1%
- Active inventory
- 15
- Price-to-rent
- 8.2×
Monthly cashflow live
- Estimated rent
- $1,315 medium interval (Pro) →
- Mortgage (P&I)
- −$676
- Tax from tax record
- −$285 /mo · $3,422/yr
- Insurance
- −$54
- HOA
- −$0
- Vacancy / Maint / Mgmt
- −$276
- Net cashflow
- $23
Break-even live
UW: 25.0% down · 7.5% · 30yr · 1.5% tax · 5.0% vac · 8.0% maint · 8.0% mgmt
Financing live
Cash to close
- Down payment
- $32,250
- Closing costs
- $3,870
- Reserves months
- —
- Total cash needed
- —
Loan-product check · same deal, 3 products live
Conventional
25% down · 7.5% · 30yr
- Down + closing
- —
- Monthly P&I
- —
- Monthly cashflow
- —
- DSCR
- —
- Eligible?
- —
Personal DTI + credit; lowest rate.
DSCR
20% down · 8.5% · 30yr
- Down + closing
- —
- Monthly P&I
- —
- Monthly cashflow
- —
- DSCR
- —
- Eligible?
- —
No personal income docs; deal must DSCR.
Hard money
10% down · 12.0% · 12mo
- Down + closing
- —
- Monthly P&I
- —
- Monthly cashflow
- —
- DSCR
- —
- Eligible?
- —
Short-term bridge; refi at stabilization.
Listing history 32 events
-
2026-05-24status Pending
-
2026-05-24status Pending
-
2026-05-22status Pending
-
2026-01-21soldstatus $128,500
-
2026-01-16soldstatus $128,500 Closed
-
2026-01-16soldstatus $128,500 Closed
-
2026-01-16soldstatus $128,500 Closed
-
2026-01-16soldstatus $128,500 Closed
-
2026-01-08status Pending
-
2026-01-05historical
-
2025-12-09status Pending
-
2025-12-09historical
-
2025-12-09historical
-
2025-10-23price
-
2025-08-07price
-
2025-07-23status Active
-
2025-07-09status Pending
-
2025-06-27$129,000
-
2025-06-27Active
-
2021-10-15soldstatus $115,000 286-char remark
Show marketing remark (286 chars)
Lovely Remodeled 3 Bedroom/2 Bath Home! Large Kitchen complete with vaulted ceilings and hickory cabinets. Main Floor Master Bedroom & Laundry Room. Rustic accents, solid oak interior doors, Oversize heated garage w/ finished game room, large shed. Call Today to Schedule a Showing!
-
2021-08-06historical
-
2021-08-06historical
-
2021-08-06historical
-
2021-08-06historical
-
2021-05-15$118,000 286-char remark
Show marketing remark (286 chars)
Lovely Remodeled 3 Bedroom/2 Bath Home! Large Kitchen complete with vaulted ceilings and hickory cabinets. Main Floor Master Bedroom & Laundry Room. Rustic accents, solid oak interior doors, Oversize heated garage w/ finished game room, large shed. Call Today to Schedule a Showing!
-
2017-12-07soldstatus $96,600
-
2017-11-22soldstatus $96,500
-
2017-11-22soldstatus $96,500
-
2017-06-09$99,000
-
2017-06-09$99,000
ⓘ Source: listings_history table (triggers on properties + properties_extension) + one-shot
backfill from property_details.listing_events for pre-trigger history.
Tax reassessment forecast IL · Partial reset (capped growth)
- Current annual tax
- $3,422 · $285/mo
- Projected year-2 tax
- $3,422 · $285/mo
- Expected delta
- $0/yr ($0/mo · 0.0%)
ⓘ Screening estimate from a state-policy table — verify with the county assessor before closing.
Climate risk First Street
- Flood 1/10 Low FEMA zone X (unshaded) · 0% chance over 30 yrs
- Wildfire 1/10 Low
- Heat 3/10 Moderate 7 d/yr ≥103°F today · 17 d/yr by 30 yrs out
- Wind 2/10 Low
- Air quality 3/10 Moderate 2 unhealthy d/yr today · 3 by 30 yrs out
Nearby sold comps map
Loading sold comps map…
Walkable amenities ~0.75 mi
Loading nearby amenities…
Taxation est. · year 1
- Rental income
- $15,775
- − Mortgage interest
- −$7,226
- − Property taxes
- −$3,422
- − Insurance
- −$645
- − Repairs & maintenance
- −$1,262
- − Management
- −$1,262
- − Depreciation
- −$3,753
- Taxable loss
- −$1,795
- Est. tax savings @ 24.0%
- +$431
- After-tax cash flow
- $708/yr
For passive investors: Depreciation is non-cash, so a rental often shows a tax loss while cash-flowing — sheltering income. Rental losses are passive: they offset passive income freely, and up to $25,000/yr can offset ordinary (W-2) income if you actively participate and your MAGI is under $100k (phasing out to $0 by $150k); unused losses carry forward. On sale, claimed depreciation is recaptured at up to 25%, and gains may owe capital-gains tax (a 1031 exchange can defer both). Figures are a year-1 estimate at your 24.0% rate — not tax advice; consult a CPA.
Schools (NCES district)
- District
- Cambridge CUSD 227
- NCES district ID
- 1708160
- Math proficiency
- 28% ▲ 4.00%
- Reading proficiency
- 37% ▲ 10.00%
- Median HH income
- $55,653
- Composite
- 28.79/100
- National rank
- #6663
- State rank
- #215 of 620 in IL
Livability — Cambridge
- Score
- 66/100
- State rank
- #584
- US rank
- #12167
Category grades
Schools grade is shown separately in the Schools card above.
Census & demographics
- Census place
- Cambridge, IL
- Population (ZIP)
- 2,705
Population outlook (Henry County) Hauer SSP2
- Today (2025)
- 47,376 people
- By 2030
- 45,920 · -3.1%
- By 2040
- 42,829 · -9.6%
- By 2050
- 39,606 · -16.4%
- By 2075
- 31,848 · -32.8%
- By 2100
- 23,503 · -50.4%
Race, ethnicity, and origin ACS 2023
- Neighborhood character
- Predominantly White (93%)
- Race & ethnicity
- White 93% Two or more races 4% Black 2%
- Common ancestry
- English 6% Scottish 3% Slovak 2%
- Foreign-born
- 1%
- Languages at home
- 99% English-only · Tagalog/Filipino 1% Spanish 1%
Political lean MEDSL · Henry
- 2024 margin
- Strong R (+24.5) · D 36.8% · R 61.3% · Other 1.9%
- 2008→2024 swing
- -32.2pp toward R · 2008: 7.7pp · 2024: -24.5pp
- All cycles
- 2024: R+24.5 2020: R+21.4 2016: R+21.2 2012: D+3.1 2008: D+7.7
Not yet ingested
- Civics
- —
Market trends
- HPI YoY
- ▲ 8.34%
- Current HPI
- 276.25
- Rent YoY
- —
- Metro
- —
- State GDP YoY
- ▲ 1.59%
- F500 in state
- 60
Industry mix (Fortune 500 HQ in IL)
| Industry | F500 HQs | Revenue |
|---|---|---|
| Insurance | 4 | $201B |
|
||
| Consumer Goods | 4 | $87B |
|
||
| Industrial Machinery | 3 | $64B |
|
||
| Healthcare | 2 | $55B |
|
||
| Retail / Pharmacy | 1 | $148B |
|
||
| Agriculture / Food | 1 | $86B |
|
||
Price history
+29.8% since first listed32 events — show timeline
- 2026-05-24 Pending — MRED as Distributed by MLS Grid
- 2026-05-24 Pending — MRED as Distributed by MLS Grid
- 2026-05-22 Pending — MRED as Distributed by MLS Grid
- 2026-01-21 Sold (Public Records) $128,500 Public Records
- 2026-01-16 Sold (MLS) $128,500 MRED as Distributed by MLS Grid
- 2026-01-16 Sold (MLS) $128,500 MRED as Distributed by MLS Grid
- 2026-01-16 Sold (MLS) $128,500 MRED as Distributed by MLS Grid
- 2026-01-16 Sold (MLS) $128,500 MRED as Distributed by MLS Grid
- 2026-01-08 Pending — MRED as Distributed by MLS Grid
- 2026-01-05 Listing Removed — MRED as Distributed by MLS Grid
- 2025-12-09 Pending — RMLSA as Distributed by MLS Grid
- 2025-12-09 Listing Removed — RMLSA as Distributed by MLS Grid
- 2025-12-09 Listing Removed — MRED as Distributed by MLS Grid
- 2025-10-23 Price Changed — RMLSA as Distributed by MLS Grid
- 2025-08-07 Price Changed — RMLSA as Distributed by MLS Grid
- 2025-07-23 Relisted — RMLSA as Distributed by MLS Grid
- 2025-07-09 Pending — RMLSA as Distributed by MLS Grid
- 2025-06-27 Listed — RMLSA as Distributed by MLS Grid
- 2025-06-27 Listed $129,000 MRED as Distributed by MLS Grid
- 2021-10-15 Sold (MLS) $115,000 RMLSA as Distributed by MLS Grid
- 2021-10-15 Sold (MLS) $115,000 MRED as Distributed by MLS Grid
- 2021-08-06 Listing Removed — RMLSA as Distributed by MLS Grid
- 2021-08-06 Listing Removed — RMLSA as Distributed by MLS Grid
- 2021-08-06 Listing Removed — RMLSA as Distributed by MLS Grid
- 2021-08-06 Listing Removed — RMLSA as Distributed by MLS Grid
- 2021-05-15 Listed $118,000 RMLSA as Distributed by MLS Grid
- 2021-05-15 Listed $118,000 MRED as Distributed by MLS Grid
- 2017-12-07 Sold (Public Records) $96,600 Public Records
- 2017-11-22 Sold (MLS) $96,500 RMLSA as Distributed by MLS Grid
- 2017-11-22 Sold (MLS) $96,500 MRED as Distributed by MLS Grid
- 2017-06-09 Listed $99,000 RMLSA as Distributed by MLS Grid
- 2017-06-09 Listed $99,000 MRED as Distributed by MLS Grid
Property tax history
+1.2%/yrLatest (2024): $3,422 · +2.1% YoY. Source: county tax records.
Cash-flow waterfall
monthlySold comps — $/sqft
last 12 mo · ≤1 miLoading sold comps…