3996 Century Dr · Homestead Meadows South, TX
Flood risk No data
- FEMA flood zone
- —
- Chance of flooding over 30 yrs
- —
- Est. flood insurance / yr
- —
Fire risk No data
- Est. fire insurance / yr
- —
Heat risk No data
- Hot days now (above threshold)
- —
- Hot days in 30 yrs
- —
Wind risk No data
- Chance of severe wind over 30 yrs
- —
Air-quality risk No data
- Unhealthy air days now
- —
- Unhealthy air days in 30 yrs
- —
Risk factors via First Street. Map © Google.
Why this score? — see what drove the C- grade
The composite is a weighted blend of 9 inputs, each scored 0–100. Each bar is that input's sub-score; the figure is the points it added to the 100-point composite (weight × sub-score).
- Cash flow +24.7/30.0
- DSCR +8.0/10.0
- ARV discount +7.5/15.0
- 1% rule +5.1/10.0
- Rent growth +3.0/5.0
- Livability +2.6/5.0
- Condition / age +2.5/5.0
- Schools +1.5/10.0
- Appreciation +0.0/10.0
$175,000
🖨 Deal sheet 📄 Offer letter ✓ Due diligence
Listing remarks MLS
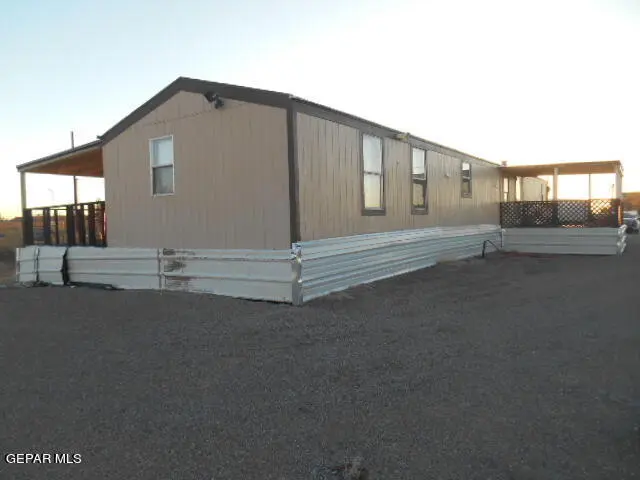
CASH ONLY!!!! THIS 1996 MANUFACTURED HOME IS 1,152 SQ.FT. ON A 1.12 ACRES LOT, NEW REFRIGERATED AIR UNIT, 3 BEDROOMS, 2 FULL BATHS, CEILING FANS, KITCHEN ISLAND, WASHER HOOK UPS. WITH A WOOD DECK TO ENJOY SUNSET VIEWS OF THE DESERT LAND.
Key facts
- 1.12 acre lot
- Built 1996
- Listed 28 days
Neighborhood map
What this means for you Summary
Snapshot
- This is a 3-bed/2.0-bath manufactured listed at $175k.
Deal economics
- At list price, monthly cash flow is $366 ($4k/yr) — positive.
- The deal already cash-flows at list — no discount required.
- Meets the 1% rule at list price ($2k rent vs $175k).
- Recommended offer: $172k (1.5% below list) — sets the bar for market timing.
Location & tenants
- Location reads 51/100 on livability (#1,476 in TX) — a working-class tenant base; expect higher turnover. Strengths: cost of living A+, housing A+; Watch: schools F, crime F, amenities F.
- Clint ISD (suburban): math 14% / reading 22% proficiency, ranked #792 of 826 in TX (top 96%) — low school quality limits family demand, transient renter base, plan for 1-2y turnover.
- Market conditions: Rents rising (+2.1%/yr); 1183 active listings in the ZIP; solid renter incomes; 2,196 units permitted in El Paso County in 2024 (143 in 5+ unit buildings).
Forward outlook
- Local home prices are declining (-3.0%/yr); year-one equity from $1k of loan paydown is wiped out by about $5k of value loss. Plan a longer hold.
- El Paso County population projected at +10% by 2050 — modest demand growth; plan on rents tracking national, not racing it.
Negotiation context
- It's been on market 28 days — a 2% lower offer ($172k) is reasonable based on typical stale-listing flexibility.
- 6 sale attempts since 16y ago with the ask held roughly flat each time — persistent listings suggest the price (not the market) is what's stuck; bring a comps-based counter.
Questions for the listing agent
- Is there a deadline driving the sale (1031 exchange, divorce, estate, relocation)? That informs how much negotiation room exists.
- Schools are F-rated, which usually means shorter tenancies and higher turnover. Who's the typical renter profile here, and what's been the actual vacancy rate?
- Crime grade is F in this area — have there been break-ins, vandalism, or insurance claims at this property in the last 3 years? What carrier currently insures it and at what premium?
- What's the average days-on-market for RENTAL listings here right now (not sales)? A rising rental-DOM trend means longer vacancies and softer asking-rent achievability than the comps imply.
- What's the recent tenant-quality profile in this submarket — average credit score on applications, eviction rate, late-payment / NSF rate, and stable-employment percentage? A property-management company in the area should have these aggregated.
- How much new for-sale + rental construction is in the pipeline within 1–3 miles? Heavy new supply typically softens prices + rents 12–24 months out; constrained supply supports both.
Investment metrics
- 1% rule
- 1.01% ✓
- Cap rate
- 8.80%
- Cash-on-cash
- 8.95%
- DSCR
- 1.40
- GRM
- 8.3
CMA / ARV
No comps found within radius.
Projected returns pro-forma
-3.0% appreciation · 2.06% rent growth · sell at horizon
- IRR
- -3.7%
- Equity multiple
- 0.86×
- Total profit
- $-6,810
- Equity at exit
- $26,093
- IRR
- 4.9%
- Equity multiple
- 1.35×
- Total profit
- $17,056
- Equity at exit
- $15,131
Cash invested: $49,000 (down + closing). Projections, not guarantees.
Landlord ↔ Tenant lean methodology
- Overall (STATE)
- 87 Strongly Landlord-Friendly
- State Texas
- 87 Strongly Landlord-Friendly · R+5
- County
- — inherits STATE
- City
- — inherits STATE
ZIP-level market 79938
- Home prices YoY
- -8.6%
- Rents YoY
- 2.1%
- Active inventory
- 1183
- Price-to-rent
- 8.3×
Monthly cashflow live
- Estimated rent
- $1,761 medium interval (Pro) →
- Mortgage (P&I)
- −$918
- Tax from tax record
- −$35 /mo · $420/yr
- Insurance
- −$73
- HOA
- −$0
- Vacancy / Maint / Mgmt
- −$370
- Net cashflow
- $366
Break-even live
UW: 25.0% down · 7.5% · 30yr · 1.5% tax · 5.0% vac · 8.0% maint · 8.0% mgmt
Financing live
Cash to close
- Down payment
- $43,750
- Closing costs
- $5,250
- Reserves months
- —
- Total cash needed
- —
Loan-product check · same deal, 3 products live
Conventional
25% down · 7.5% · 30yr
- Down + closing
- —
- Monthly P&I
- —
- Monthly cashflow
- —
- DSCR
- —
- Eligible?
- —
Personal DTI + credit; lowest rate.
DSCR
20% down · 8.5% · 30yr
- Down + closing
- —
- Monthly P&I
- —
- Monthly cashflow
- —
- DSCR
- —
- Eligible?
- —
No personal income docs; deal must DSCR.
Hard money
10% down · 12.0% · 12mo
- Down + closing
- —
- Monthly P&I
- —
- Monthly cashflow
- —
- DSCR
- —
- Eligible?
- —
Short-term bridge; refi at stabilization.
Listing history 14 events
-
2026-06-02status $175,000 Pending 28 DOM
-
2026-06-01days on market $175,000 Active 28 DOM
-
2026-05-31days on market $175,000 Active 27 DOM
-
2026-05-15status Active 239-char remark
Show marketing remark (239 chars)
CASH ONLY!!!! THIS 1996 MANUFACTURED HOME IS 1,152 SQ.FT. ON A 1.12 ACRES LOT, NEW REFRIGERATED AIR UNIT, 3 BEDROOMS, 2 FULL BATHS, CEILING FANS, KITCHEN ISLAND, WASHER HOOK UPS. WITH A WOOD DECK TO ENJOY SUNSET VIEWS OF THE DESERT LAND.
-
2026-03-24status Pending 239-char remark
Show marketing remark (239 chars)
CASH ONLY!!!! THIS 1996 MANUFACTURED HOME IS 1,152 SQ.FT. ON A 1.12 ACRES LOT, NEW REFRIGERATED AIR UNIT, 3 BEDROOMS, 2 FULL BATHS, CEILING FANS, KITCHEN ISLAND, WASHER HOOK UPS. WITH A WOOD DECK TO ENJOY SUNSET VIEWS OF THE DESERT LAND.
-
2026-03-12$175,000 Active 239-char remark
Show marketing remark (239 chars)
CASH ONLY!!!! THIS 1996 MANUFACTURED HOME IS 1,152 SQ.FT. ON A 1.12 ACRES LOT, NEW REFRIGERATED AIR UNIT, 3 BEDROOMS, 2 FULL BATHS, CEILING FANS, KITCHEN ISLAND, WASHER HOOK UPS. WITH A WOOD DECK TO ENJOY SUNSET VIEWS OF THE DESERT LAND.
-
2024-09-12historical $1,200
-
2024-08-01price $1,200
-
2024-05-16$1,400
-
2022-04-28$155,000 Active
-
2012-06-26historical
-
2012-02-22$75,000
-
2010-08-30historical
-
2010-04-23$69,900
ⓘ Source: listings_history table (triggers on properties + properties_extension) + one-shot
backfill from property_details.listing_events for pre-trigger history.
Tax reassessment forecast TX · Resets to sale price
- Current annual tax
- $420 · $35/mo
- Projected year-2 tax
- $3,202 · $267/mo
- Expected delta
- +$2,783/yr (+$232/mo · 662.7%)
ⓘ Screening estimate from a state-policy table — verify with the county assessor before closing.
Nearby sold comps map
Loading sold comps map…
Walkable amenities ~0.75 mi
Loading nearby amenities…
Taxation est. · year 1
- Rental income
- $21,132
- − Mortgage interest
- −$9,803
- − Property taxes
- −$420
- − Insurance
- −$875
- − Repairs & maintenance
- −$1,691
- − Management
- −$1,691
- − Depreciation
- −$5,091
- Taxable income
- $1,563
- Est. tax owed @ 24.0%
- −$375
- After-tax cash flow
- $4,012/yr
For passive investors: Depreciation is non-cash, so a rental often shows a tax loss while cash-flowing — sheltering income. Rental losses are passive: they offset passive income freely, and up to $25,000/yr can offset ordinary (W-2) income if you actively participate and your MAGI is under $100k (phasing out to $0 by $150k); unused losses carry forward. On sale, claimed depreciation is recaptured at up to 25%, and gains may owe capital-gains tax (a 1031 exchange can defer both). Figures are a year-1 estimate at your 24.0% rate — not tax advice; consult a CPA.
Schools (NCES district)
- District
- Clint ISD
- NCES district ID
- 4814430
- Math proficiency
- 14% ▼ -32.00%
- Reading proficiency
- 22% ▼ -15.00%
- Median HH income
- $37,490
- Composite
- 15.03/100
- National rank
- #9356
- State rank
- #792 of 826 in TX
Livability — Homestead Meadows South
- Score
- 51/100
- State rank
- #1476
- US rank
- #25289
Category grades
Schools grade is shown separately in the Schools card above.
Census & demographics
- Census place
- Homestead Meadows South, TX
- County
- El Paso County · 761,266 people
- Metro
- El Paso, TX
- Population (ZIP)
- 99,621
- Household income
- $77,272
- Rent vs Own
- Severe rent burden
- 900.0
Population outlook (El Paso County) Hauer SSP2
- Today (2025)
- 897,899 people
- By 2030
- 922,694 · +2.8%
- By 2040
- 960,492 · +7.0%
- By 2050
- 982,919 · +9.5%
- By 2075
- 997,266 · +11.1%
- By 2100
- 900,630 · +0.3%
Race, ethnicity, and origin ACS 2023
- Neighborhood character
- Predominantly Hispanic (83%)
- Race & ethnicity
- Hispanic / Latino 83% Two or more races 42% White 10% Black 4%
- Hispanic origin (detail)
- Mexican 76% Puerto Rican 1%
- Common ancestry
- Italian 1% Lithuanian 1%
- Foreign-born
- 20% · Canada, Guatemala
- Languages at home
- 36% English-only · Spanish 62%
Political lean MEDSL · El Paso
- 2024 margin
- D (+15.1) · D 57.0% · R 41.8% · Other 1.2%
- 2008→2024 swing
- -17.4pp toward R · 2008: 32.5pp · 2024: 15.1pp
- All cycles
- 2024: D+15.1 2020: D+35.1 2016: D+43.2 2012: D+32.6 2008: D+32.5
Not yet ingested
- Civics
- —
Market trends
- HPI YoY
- ▼ -19.39%
- Current HPI
- 207.2031
- Rent YoY
- ▲ 2.06%
- Metro
- El Paso, TX
- State GDP YoY
- ▲ 3.95%
- F500 in state
- 110
Industry mix (Fortune 500 HQ in TX)
| Industry | F500 HQs | Revenue |
|---|---|---|
| Energy | 16 | $1,198B |
|
||
| Technology | 5 | $198B |
|
||
| Engineering / Construction | 4 | $72B |
|
||
| Energy Services | 3 | $60B |
|
||
| Utilities | 3 | $41B |
|
||
| Healthcare | 2 | $330B |
|
||
Price history
+150.4% since first listed11 events — show timeline
- 2026-05-15 Relisted — GEPARMLS
- 2026-03-24 Pending — GEPARMLS
- 2026-03-12 Listed $175,000 GEPARMLS
- 2024-09-12 Rental Removed $1,200 GEPARMLS
- 2024-08-01 Price Changed $1,200 GEPARMLS
- 2024-05-16 Listed for Rent $1,400 GEPARMLS
- 2022-04-28 Listed $155,000 GEPARMLS
- 2012-06-26 Listing Removed — GEPARMLS
- 2012-02-22 Listed $75,000 GEPARMLS
- 2010-08-30 Listing Removed — GEPARMLS
- 2010-04-23 Listed $69,900 GEPARMLS
Property tax history
+1.6%/yrLatest (2017): $420 · +1.2% YoY. Source: county tax records.
Cash-flow waterfall
monthlySold comps — $/sqft
last 12 mo · ≤1 miLoading sold comps…