387 Parkridge Ave · Lakeside, FL
Flood risk 1/10 · Minimal
- FEMA flood zone
- X (unshaded)
- Chance of flooding over 30 yrs
- 0.0%
- Est. flood insurance / yr
- $507 – $1,088
Fire risk 4/10 · Minor
- Est. fire insurance / yr
- $947 – $1,759
Heat risk 9/10 · Severe
- Hot days now (above 107°F)
- 7 days/yr
- Hot days in 30 yrs
- 19 days/yr
Wind risk 9/10 · Severe
- Chance of severe wind over 30 yrs
- 99.0%
Air-quality risk 3/10 · Minor
- Unhealthy air days now
- 3 days/yr
- Unhealthy air days in 30 yrs
- 3 days/yr
Risk factors via First Street. Map © Google.
Why this score? — see what drove the C grade
The composite is a weighted blend of 9 inputs, each scored 0–100. Each bar is that input's sub-score; the figure is the points it added to the 100-point composite (weight × sub-score).
- Cash flow +19.4/30.0
- ARV discount +15.0/15.0
- DSCR +6.1/10.0
- Schools +5.1/10.0
- 1% rule +4.8/10.0
- Rent growth +3.4/5.0
- Livability +3.4/5.0
- Condition / age +2.5/5.0
- Appreciation +0.0/10.0
$175,000
🖨 Deal sheet 📄 Offer letter ✓ Due diligence
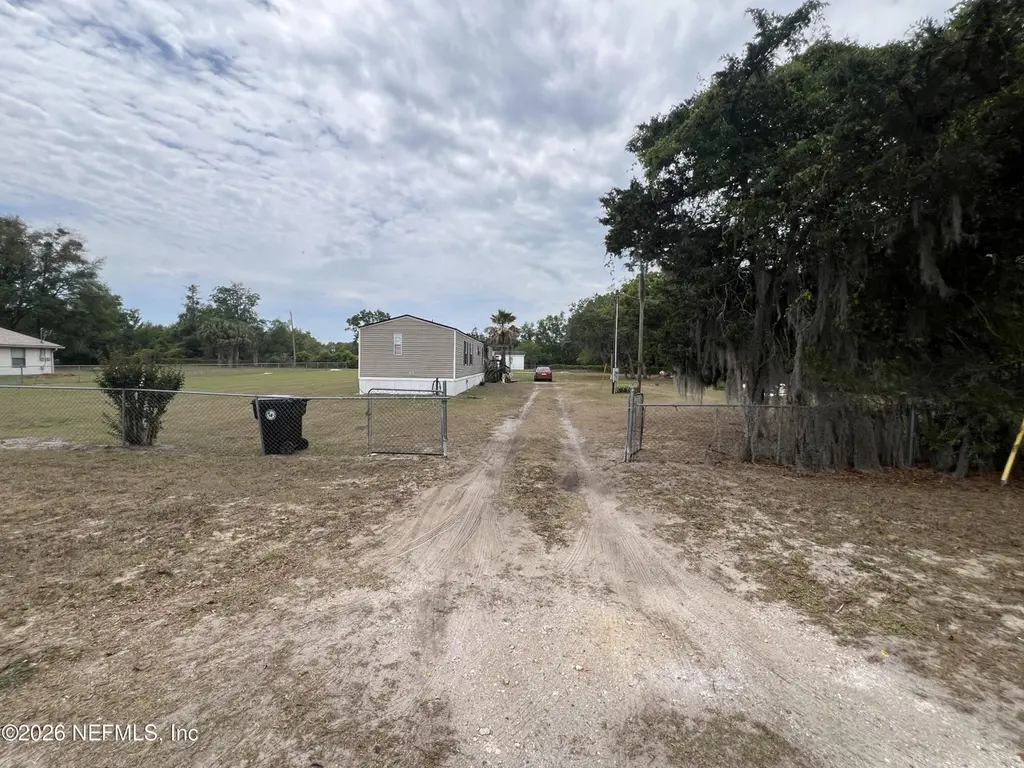
Listing remarks
Great starter home. 0.48 acre corner lot fully fenced in. New roof, new AC. * 1 of the bathroom will be renovated before closing. * kitchen cabinets will be replaced before closing. The house still needs some TLC. No HOA, no CDD fees.
Key facts
- Fully fenced
- Bathroom renovated
- New ac
Tags
Property features AI
Finance
- HOA & community: Not a senior community
Exterior
- Parking: Other parking (details not specified)
- Utilities: Electricity connected; Public sewer; Water connected; Sewer connected
- Home design: Single wide manufactured home; Property is attached; Currently used as a residential manufactured home
- Exterior features: Corner lot; Fenced yard with chain link fencing; Shingle roof
Interior
- Bedrooms: 3 bedrooms
- Bathrooms: 2 full bathrooms
- Heating & cooling: Central heating; Central air conditioning
- Interior features: Appliances other than standard (details not specified)
Neighborhood map
What this means for you Summary
Snapshot
- This is a 3-bed/2.0-bath manufactured listed at $175k.
Deal economics
- At list price, monthly cash flow is $195 ($2k/yr) — positive.
- The deal already cash-flows at list — no discount required.
- To meet the 1% rule (rent ≥ 1% of price), the offer needs to be $171k (2.1% below list).
- Recommended offer: $171k (2.1% below list) — sets the bar for 1% rule.
- Cap rate 7.6% vs local median 4.7% in Lakeside — top-decile yield for the area; either an underpriced asset or a hidden risk that comps aren't pricing in. Stress-test before assuming the spread holds.
Location & tenants
- Location reads 68/100 on livability (#505 in FL) — a middle-class / working-renter tenant base. Strengths: cost of living A+, housing A+, schools B; Watch: amenities F, commute F, health & safety F.
- Clay (suburban): math 58% / reading 59% proficiency, ranked #14 of 73 in FL (top 19%) — acceptable for families but not a draw, mixed tenant base, ~2y average lease.
- Market conditions: Rents rising (+3.7%/yr); 217 active listings in the ZIP; 20 comparable units currently listed for rent nearby; rentals leasing fast (median 8d on market — plan ~1-2 weeks tenant-placement turnaround); solid renter incomes; 1,876 units permitted in Clay County in 2024 (14 in 5+ unit buildings).
Forward outlook
- Local home prices are declining (-3.0%/yr); year-one equity from $1k of loan paydown is wiped out by about $5k of value loss. Plan a longer hold.
- Clay County population projected at +19% by 2050 — long-run rental-demand tailwind backs the buy-and-hold thesis.
Negotiation context
- It's been on market 17 days — a 2% lower offer ($172k) is reasonable based on typical stale-listing flexibility.
- Current owner paid $45k; list at $175k implies a 289% gain — meaningful room to come down on a strong offer.
Risks & watch-outs
- Climate carrying-cost: severe wind risk, 99% chance of damaging wind over 30y; extreme-heat days projected 7→19/yr by 2055 (HVAC capex compounding) — expect insurance premiums to compound above CPI over the hold.
Questions for the listing agent
- Is there a deadline driving the sale (1031 exchange, divorce, estate, relocation)? That informs how much negotiation room exists.
- Schools are B-rated — typically a magnet for longer-tenancy family renters. What's the average tenant stay here, and is there a school-zone premium baked into asking?
- What's the average days-on-market for RENTAL listings here right now (not sales)? A rising rental-DOM trend means longer vacancies and softer asking-rent achievability than the comps imply.
- What's the recent tenant-quality profile in this submarket — average credit score on applications, eviction rate, late-payment / NSF rate, and stable-employment percentage? A property-management company in the area should have these aggregated.
- How much new for-sale + rental construction is in the pipeline within 1–3 miles? Heavy new supply typically softens prices + rents 12–24 months out; constrained supply supports both.
Investment metrics
- 1% rule
- 0.98% ✗
- Cap rate
- 7.63%
- Cash-on-cash
- 4.78%
- DSCR
- 1.21
- GRM
- 8.5
CMA / ARV
- ARV (on-the-fly)
- $218,880
- Comps found
- 2
Show comp detail 2 sales within ~0.75 mi
| Address | Dist | Beds/Ba | Sqft | Sold | Price | $/sf | Match |
|---|---|---|---|---|---|---|---|
| 440 Hansen Ave | 0.73mi | 4/2.0 (+1) | 1,248 (+3%) | 14mo | $225,000 | $180 | 45 |
| 758 Washington Ave | 0.59mi | 3/2.0 | 1,380 (+14%) | 8mo | $170,000 | $123 | 43 |
Match score weights: distance 35% · size 25% · config 20% · recency 20%. Top-matched comps best support the ARV.
Projected returns pro-forma
-3.0% appreciation · 3.73% rent growth · sell at horizon
- IRR
- -8.1%
- Equity multiple
- 0.70×
- Total profit
- $-14,654
- Equity at exit
- $26,093
- IRR
- 2.4%
- Equity multiple
- 1.17×
- Total profit
- $8,515
- Equity at exit
- $15,131
Cash invested: $49,000 (down + closing). Projections, not guarantees.
Landlord ↔ Tenant lean methodology
- Overall (STATE)
- 87 Strongly Landlord-Friendly
- State Florida
- 87 Strongly Landlord-Friendly · R+3
- County
- — inherits STATE
- City
- — inherits STATE
ZIP-level market 32065
- Home prices YoY
- -25.6%
- Rents YoY
- 3.7%
- Active inventory
- 217
- Price-to-rent
- 8.5×
Monthly cashflow live
- Estimated rent
- $1,713 high interval (Pro) →
- Mortgage (P&I)
- −$918
- Tax from tax record
- −$167 /mo · $2,008/yr
- Insurance
- −$73
- HOA
- −$0
- Vacancy / Maint / Mgmt
- −$360
- Net cashflow
- $195
Break-even live
Sensitivity live
| Price | -10% $294 | -5% $245 | +0% $195 | +5% $146 | +10% $96 |
|---|---|---|---|---|---|
| Rent | -10% $60 | -5% $128 | +0% $195 | +5% $263 | +10% $331 |
| Rate | -1.0pp $283 | -0.5pp $240 | base $195 | +0.5pp $150 | +1.0pp $104 |
UW: 25.0% down · 7.5% · 30yr · 1.5% tax · 5.0% vac · 8.0% maint · 8.0% mgmt
Financing live
Cash to close
- Down payment
- $43,750
- Closing costs
- $5,250
- Reserves months
- —
- Total cash needed
- —
Loan-product check · same deal, 3 products live
Conventional
25% down · 7.5% · 30yr
- Down + closing
- —
- Monthly P&I
- —
- Monthly cashflow
- —
- DSCR
- —
- Eligible?
- —
Personal DTI + credit; lowest rate.
DSCR
20% down · 8.5% · 30yr
- Down + closing
- —
- Monthly P&I
- —
- Monthly cashflow
- —
- DSCR
- —
- Eligible?
- —
No personal income docs; deal must DSCR.
Hard money
10% down · 12.0% · 12mo
- Down + closing
- —
- Monthly P&I
- —
- Monthly cashflow
- —
- DSCR
- —
- Eligible?
- —
Short-term bridge; refi at stabilization.
Rent comps 20 comps
| Address | Beds | Baths | Sqft | Rent | $/sqft | DOM | Units | Dist |
|---|---|---|---|---|---|---|---|---|
| 49 College Dr Orange Park, FL | 2.0 | 2.0 | 784 | $1,150 | $1.47 | 8d | 8 | 0.41mi |
| 409 Jefferson Ave Orange Park, FL | 1.0–2.0 | 1.0–2.0 | 720 | $1,370 | $1.90 | 3d | 2 | 0.51mi |
| 1270 Ticonderoga Trl Unit C Orange Park, FL | 2.0 | 2.0 | 922 | $1,300 | $1.41 | 24d | 1 | 0.65mi |
| 1324 Jefferson Ave Orange Park, FL | 2.0 | 2.0 | 926 | $1,245 | $1.34 | 24d | 1 | 0.67mi |
| 1324 Jefferson Ave Orange Park, FL | 2.0 | 2.0 | 922 | $1,245 | $1.35 | 3d | 1 | 0.67mi |
| 1333 Jefferson Ave Unit D Orange Park, FL | 2.0 | 2.0 | 922 | $1,325 | $1.44 | 24d | 1 | 0.69mi |
| 1330 Jefferson Ave Orange Park, FL | 2.0 | 2.0 | 922 | $1,250 | $1.36 | 16d | 1 | 0.70mi |
| 1248 Ticonderoga Trl Unit C Orange Park, FL | 2.0 | 2.0 | 922 | $1,195 | $1.30 | 8d | 1 | 0.76mi |
| 2716 Secret Harbor Dr Orange Park, FL | 3.0 | 2.0 | 1268 | $1,695 | $1.34 | 8d | 1 | 0.78mi |
| 2716 Secret Harbor Dr Orange Park, FL | 3.0 | 2.0 | 1388 | $1,695 | $1.22 | 4d | 1 | 0.78mi |
| 1177 Kincross Ct Orange Park, FL | 3.0 | 2.0 | 1426 | $1,885 | $1.32 | 24d | 1 | 0.84mi |
| 1281 Independence Dr Orange Park, FL | 3.0 | 2.0 | 1087 | $1,695 | $1.56 | 24d | 1 | 0.93mi |
| 2897 Gatling Blvd Orange Park, FL | 3.0 | 2.0 | 1338 | $1,650 | $1.23 | 8d | 1 | 0.94mi |
| 1504 Pawnee St Orange Park, FL | 3.0 | 2.0 | 1338 | $1,795 | $1.34 | 20d | 1 | 1.19mi |
| 1338 Pawnee St Orange Park, FL | 3.0 | 2.0 | 1324 | $1,905 | $1.44 | 20d | 1 | 1.25mi |
| 2804 Canyon Ct Orange Park, FL | 3.0 | 2.0 | 1367 | $1,824 | $1.33 | 15d | 1 | 1.28mi |
| 1255 Tahoe Ct Orange Park, FL | 3.0 | 2.0 | 1305 | $1,916 | $1.47 | 8d | 1 | 1.31mi |
| 2300 Twelve Oaks Dr Unit F2 Orange Park, FL | 2.0 | 1.0 | 1016 | $1,299 | $1.28 | 8d | 1 | 1.39mi |
| 2796 Kiowa Ave Orange Park, FL | 3.0 | 2.0 | 1274 | $1,915 | $1.50 | 2d | 1 | 1.43mi |
| 25 Knight Boxx Rd Orange Park, FL | 1.0–3.0 | 1.0–2.0 | 1109 | $1,863 | $1.68 | 2d | 18 | 1.46mi |
Listing history 12 events
-
2026-06-18days on market $175,000 Active 17 DOM
-
2026-06-17days on market $175,000 Active 16 DOM
-
2026-06-16days on market $175,000 Active 15 DOM
-
2026-06-15days on market $175,000 Active 14 DOM
-
2026-06-13days on market $175,000 Active 12 DOM
-
2026-06-13days on market $175,000 Active 11 DOM
-
2026-06-09days on market $175,000 Active 8 DOM
-
2026-06-08days on market $175,000 Active 7 DOM
-
2026-06-07days on market $175,000 Active 6 DOM
-
2026-06-03days on market $175,000 Active 2 DOM
-
2026-06-02remarks 234-char remark
-
2026-06-02$175,000 Active 1 DOM
ⓘ Source: listings_history table (triggers on properties + properties_extension) + one-shot
backfill from property_details.listing_events for pre-trigger history.
Tax reassessment forecast FL · Resets to sale price
- Current annual tax
- $2,008 · $167/mo
- Projected year-2 tax
- $2,008 · $167/mo
- Expected delta
- $0/yr ($0/mo · 0.0%)
ⓘ Screening estimate from a state-policy table — verify with the county assessor before closing.
Climate risk First Street
- Flood 1/10 Low FEMA zone X (unshaded) · 0% chance over 30 yrs
- Wildfire 4/10 Moderate
- Heat 9/10 Extreme 7 d/yr ≥107°F today · 19 d/yr by 30 yrs out
- Wind 9/10 Extreme 99% chance of damaging wind over 30 yrs
- Air quality 3/10 Moderate 3 unhealthy d/yr today · 3 by 30 yrs out
Nearby sold comps map
Loading sold comps map…
Walkable amenities ~0.75 mi
Loading nearby amenities…
Taxation est. · year 1
- Rental income
- $20,557
- − Mortgage interest
- −$9,803
- − Property taxes
- −$2,008
- − Insurance
- −$875
- − Repairs & maintenance
- −$1,645
- − Management
- −$1,645
- − Depreciation
- −$5,091
- Taxable loss
- −$509
- Est. tax savings @ 24.0%
- +$122
- After-tax cash flow
- $2,466/yr
For passive investors: Depreciation is non-cash, so a rental often shows a tax loss while cash-flowing — sheltering income. Rental losses are passive: they offset passive income freely, and up to $25,000/yr can offset ordinary (W-2) income if you actively participate and your MAGI is under $100k (phasing out to $0 by $150k); unused losses carry forward. On sale, claimed depreciation is recaptured at up to 25%, and gains may owe capital-gains tax (a 1031 exchange can defer both). Figures are a year-1 estimate at your 24.0% rate — not tax advice; consult a CPA.
Schools (NCES district)
- District
- Clay
- NCES district ID
- 1200300
- Math proficiency
- 58% ▼ -8.00%
- Reading proficiency
- 59% ▼ -3.00%
- Median HH income
- $59,379
- Composite
- 50.73/100
- National rank
- #1815
- State rank
- #14 of 73 in FL
Livability — Lakeside
- Score
- 68/100
- State rank
- #505
- US rank
- #9341
Category grades
Schools grade is shown separately in the Schools card above.
Census & demographics
- Census place
- Lakeside, FL
- County
- Clay County · 208,450 people
- Metro
- Jacksonville, FL
- Population (ZIP)
- 41,578
- Household income
- $97,455
- Rent vs Own
- Severe rent burden
- 1129.0
Population outlook (Clay County) Hauer SSP2
- Today (2025)
- 230,495 people
- By 2030
- 242,427 · +5.2%
- By 2040
- 262,244 · +13.8%
- By 2050
- 275,148 · +19.4%
- By 2075
- 295,397 · +28.2%
- By 2100
- 287,592 · +24.8%
Race, ethnicity, and origin ACS 2023
- Neighborhood character
- Diverse neighborhood (Simpson 0.67)
- Race & ethnicity
- White 51% Black 20% Hispanic / Latino 15% Two or more races 15% Asian 6%
- Hispanic origin (detail)
- Mexican 3% Puerto Rican 5% Cuban 3%
- Common ancestry
- Lithuanian 4% Romanian 2% Portuguese 2%
- Foreign-born
- 8% · Canada, China
- Languages at home
- 88% English-only · Spanish 7% Tagalog/Filipino 3% Other Asian/Pacific 1%
Political lean MEDSL · Clay
- 2024 margin
- Solid R (+39.3) · D 29.9% · R 69.2%
- 2008→2024 swing
- +3.6pp toward D · 2008: -42.8pp · 2024: -39.3pp
- All cycles
- 2024: R+39.3 2020: R+37.1 2016: R+44.3 2012: R+45.8 2008: R+42.8
Not yet ingested
- Civics
- —
Market trends
- HPI YoY
- ▼ -95.13%
- Current HPI
- 276.5987
- Rent YoY
- ▲ 3.73%
- Metro
- Jacksonville, FL
- State GDP YoY
- ▲ 3.28%
- F500 in state
- 36
Industry mix (Fortune 500 HQ in FL)
| Industry | F500 HQs | Revenue |
|---|---|---|
| Industrial Technology | 2 | $29B |
|
||
| Insurance | 2 | $17B |
|
||
| Retail | 1 | $60B |
|
||
| Technology Distribution | 1 | $58B |
|
||
| Homebuilding | 1 | $35B |
|
||
| Technology Manufacturing | 1 | $35B |
|
||
Price history
+288.9% since first listed2 events — show timeline
- 2026-04-15 Listed $175,000 realMLS
- 2005-01-18 Sold (Public Records) $45,000 Public Records
Property tax history
+6.9%/yrLatest (2025): $2,008 · +5.6% YoY. Source: county tax records.
Cash-flow waterfall
monthlySold comps — $/sqft
last 12 mo · ≤1 miLoading sold comps…