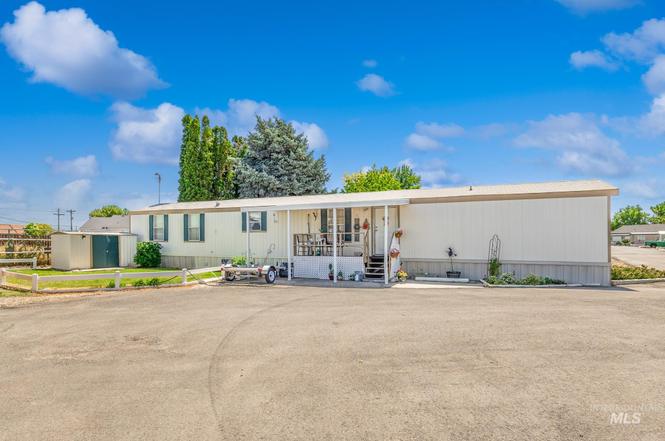
1401 N Midland Trlr 9 · Nampa, ID
Flood risk No data
- FEMA flood zone
- —
- Chance of flooding over 30 yrs
- —
- Est. flood insurance / yr
- —
Fire risk No data
- Est. fire insurance / yr
- —
Heat risk No data
- Hot days now (above threshold)
- —
- Hot days in 30 yrs
- —
Wind risk No data
- Chance of severe wind over 30 yrs
- —
Air-quality risk No data
- Unhealthy air days now
- —
- Unhealthy air days in 30 yrs
- —
Risk factors via First Street. Map © Google.
Why this score? — see what drove the B- grade
The composite is a weighted blend of 9 inputs, each scored 0–100. Each bar is that input's sub-score; the figure is the points it added to the 100-point composite (weight × sub-score).
- Cash flow +30.0/30.0
- 1% rule +10.0/10.0
- DSCR +10.0/10.0
- Rent growth +4.1/5.0
- Schools +3.8/10.0
- Livability +3.6/5.0
- Condition / age +2.5/5.0
- ARV discount +1.2/15.0
- Appreciation +0.0/10.0
$99,900
🖨 Deal sheet 📄 Offer letter ✓ Due diligence
Listing remarks
Welcome to your next chapter in this well-maintained 3-bedroom, 2-bath home nestled in a welcoming 55 and over community. This mobile home offers comfort and functionality with a spacious layout perfect for daily living and relaxation. The primary bedroom includes an en-suite bath, ensuring privacy and ease. Entertain guests or unwind in the generously sized living area and enjoy meals in the cozy dining space just off the kitchen. Outside, the rented lot provides a low-maintenance lifestyle without sacrificing outdoor enjoyment. Conveniently located near community essentials, you're just a short trip from a local grocery store, a trusted pet and garden supply spot, and an educational cente
Key facts
- Cozy dining space
- En suite bath
- Conveniently located
Tags
Property features AI
Finance
- Other: Located in Nampa NE area; directions: Nampa Caldwell Blvd, south on Midland to address; OK Mobile Home Park
- HOA & community: Monthly association fee
Exterior
- Home design: Mobile/manufactured home
- Construction: Originally built in 1999
- Exterior features: Small lot (approx. 5,999 sq ft); Located in a mobile/manufactured home park (rented lot)
Interior
- Bedrooms: Three bedrooms, all on the main level
- Bathrooms: Two bathrooms
- Heating & cooling: No heating; No cooling
- Interior features: Main-level master and additional bedrooms
Neighborhood map
What this means for you Summary
Snapshot
- This is a 3-bed/2.0-bath manufactured listed at $100k.
Deal economics
- At list price, monthly cash flow is $635 ($8k/yr) — positive.
- The deal already cash-flows at list — no discount required.
- Meets the 1% rule at list price ($2k rent vs $100k).
- Recommended offer: $88k (12.0% below list) — sets the bar for market timing.
- Cap rate 13.9% vs local median 3.2% in Nampa — top-decile yield for the area; either an underpriced asset or a hidden risk that comps aren't pricing in. Stress-test before assuming the spread holds.
Location & tenants
- Location reads 72/100 on livability (#47 in ID) — a middle-class / working-renter tenant base. Strengths: housing A+, health & safety A+, cost of living A-; Watch: employment C-, amenities F, commute F.
- Vallivue School District (rural): math 34% / reading 56% proficiency, ranked #48 of 92 in ID (top 52%) — families likely to look elsewhere, expect single-tenant / working-renter base with shorter leases.
- Zoned schools: East Canyon Elementary School (math 34% / reading 44%, grade F, #247 of 357 statewide, top 70%, 692 students, 33% FRL); Ridgevue High School (math 27% / reading 67%, grade D-, #55 of 169 statewide, top 34%, 1,578 students, 31% FRL) — zoned schools average 32% FRL vs 52% district-wide (20 pts lower); this property's tenant base skews higher-income than the district average.
- Market conditions: Rents rising fast (+6.4%/yr); 319 active listings in the ZIP; 40 comparable units currently listed for rent nearby; rentals at typical pace (median 19d on market — plan ~3-4 weeks tenant-placement turnaround); 3,620 units permitted in Canyon County in 2024 (196 in 5+ unit buildings).
Forward outlook
- Local home prices are declining (-3.0%/yr); year-one equity from $691 of loan paydown is wiped out by about $3k of value loss. Plan a longer hold.
- Canyon County population projected at +41% by 2050 — long-run rental-demand tailwind backs the buy-and-hold thesis.
- At projected returns (-3.0% appreciation + 6.4% rent growth), your $28k cash investment doubles in ~5 years — after that, you're playing with house money.
Negotiation context
- It's been on market 333 days — a 12% lower offer ($88k) is reasonable based on typical stale-listing flexibility.
- 2 sale attempts since 5y ago; this cycle's ask has dropped $25k (20%) from the opening price — seller is motivated, your offer sets the floor, not the list.
Questions for the listing agent
- It's been on market 333 days. Have you received any prior offers? Is the seller open to a 12% concession, seller financing, or rate buy-down credit?
- Why hasn't it sold? Are there any deal-killer items the seller is aware of (foundation, flood, title, zoning, code violations)?
- Is there a deadline driving the sale (1031 exchange, divorce, estate, relocation)? That informs how much negotiation room exists.
- Schools are D-rated, which usually means shorter tenancies and higher turnover. Who's the typical renter profile here, and what's been the actual vacancy rate?
- What's the average days-on-market for RENTAL listings here right now (not sales)? A rising rental-DOM trend means longer vacancies and softer asking-rent achievability than the comps imply.
- What's the recent tenant-quality profile in this submarket — average credit score on applications, eviction rate, late-payment / NSF rate, and stable-employment percentage? A property-management company in the area should have these aggregated.
- How much new for-sale + rental construction is in the pipeline within 1–3 miles? Heavy new supply typically softens prices + rents 12–24 months out; constrained supply supports both.
Investment metrics
- 1% rule
- 1.55% ✓
- Cap rate
- 13.92%
- Cash-on-cash
- 27.23%
- DSCR
- 2.21
- GRM
- 5.4
CMA / ARV
- ARV (on-the-fly)
- $87,696
- Comps found
- 12
Show comp detail 12 sales within ~0.75 mi
| Address | Dist | Beds/Ba | Sqft | Sold | Price | $/sf | Match |
|---|---|---|---|---|---|---|---|
| 571 Caldwell Blvd Trlr 36 Blvd | 0.27mi | 3/2.0 | 1,008 (0%) | 14mo | $89,990 | $89 | 76 |
| 1401 N Midland Blvd #17 | 0.00mi | 2/2.0 (-1) | 924 (-8%) | 10mo | $110,000 | $119 | 73 |
| 1410 W Flamingo Ave Trlr 7 #7 | 0.38mi | 3/2.0 | 924 (-8%) | 3mo | $72,000 | $78 | 66 |
| 571 Caldwell Blvd #11 | 0.27mi | 3/1.5 | 924 (-8%) | 15mo | $60,000 | $65 | 59 |
| 1715 W Flamingo Ave #67 | 0.44mi | 2/2.0 (-1) | 980 (-3%) | 14mo | $89,999 | $92 | 58 |
| 1715 W Flamingo Ave Trlr 27a Unit 27A | 0.44mi | 2/2.0 (-1) | 960 (-5%) | 11mo | $77,500 | $81 | 58 |
| 1715 W Flamingo Ave Trlr 91 | 0.44mi | 2/2.0 (-1) | 938 (-7%) | 7mo | $115,000 | $123 | 57 |
| 1410 Flamingo #57 | 0.38mi | 2/2.0 (-1) | 938 (-7%) | 15mo | $69,900 | $75 | 54 |
| 1410 W Flamingo Ave #93 Ave | 0.38mi | 3/2.0 | 924 (-8%) | 20mo | $79,985 | $87 | 52 |
| 1907 W Flamingo #107 | 0.51mi | 2/2.0 (-1) | 1,106 (+10%) | 6mo | $169,900 | $154 | 50 |
| 1715 Flamingo Unit 61A | 0.44mi | 2/2.0 (-1) | 1,152 (+14%) | 1mo | $85,000 | $74 | 50 |
| 1715 W Flamingo Ave #39 Ave | 0.44mi | 3/2.0 | 1,120 (+11%) | 18mo | $87,500 | $78 | 46 |
Match score weights: distance 35% · size 25% · config 20% · recency 20%. Top-matched comps best support the ARV.
Projected returns pro-forma
-3.0% appreciation · 6.41% rent growth · sell at horizon
- IRR
- 24.7%
- Equity multiple
- 2.06×
- Total profit
- $29,707
- Equity at exit
- $14,895
- IRR
- 34.4%
- Equity multiple
- 4.65×
- Total profit
- $101,992
- Equity at exit
- $8,638
Cash invested: $27,972 (down + closing). Projections, not guarantees.
Landlord ↔ Tenant lean methodology
- Overall (STATE)
- 91 Strongly Landlord-Friendly
- State Idaho
- 91 Strongly Landlord-Friendly · R+18
- County
- — inherits STATE
- City
- — inherits STATE
ZIP-level market 83651
- Home prices YoY
- -28.3%
- Rents YoY
- 6.4%
- Active inventory
- 319
- Price-to-rent
- 5.4×
Monthly cashflow live
- Estimated rent
- $1,550 high interval (Pro) →
- Mortgage (P&I)
- −$524
- Tax from tax record
- −$25 /mo · $294/yr
- Insurance
- −$42
- HOA
- −$0
- Vacancy / Maint / Mgmt
- −$326
- Net cashflow
- $635
Break-even live
UW: 25.0% down · 7.5% · 30yr · 1.5% tax · 5.0% vac · 8.0% maint · 8.0% mgmt
Financing live
Cash to close
- Down payment
- $24,975
- Closing costs
- $2,997
- Reserves months
- —
- Total cash needed
- —
Loan-product check · same deal, 3 products live
Conventional
25% down · 7.5% · 30yr
- Down + closing
- —
- Monthly P&I
- —
- Monthly cashflow
- —
- DSCR
- —
- Eligible?
- —
Personal DTI + credit; lowest rate.
DSCR
20% down · 8.5% · 30yr
- Down + closing
- —
- Monthly P&I
- —
- Monthly cashflow
- —
- DSCR
- —
- Eligible?
- —
No personal income docs; deal must DSCR.
Hard money
10% down · 12.0% · 12mo
- Down + closing
- —
- Monthly P&I
- —
- Monthly cashflow
- —
- DSCR
- —
- Eligible?
- —
Short-term bridge; refi at stabilization.
Rent comps 40 comps
| Address | Beds | Baths | Sqft | Rent | $/sqft | DOM | Units | Dist |
|---|---|---|---|---|---|---|---|---|
| 1215 N Benewah St Nampa, ID | 3.0 | 2.0 | 1219 | $1,250 | $1.03 | 14d | 1 | 0.13mi |
| 1013 W Willow Ave Nampa, ID | 3.0 | 1.0 | 900 | $1,500 | $1.67 | 14d | 1 | 0.13mi |
| 1490 W Bonneville Cir Nampa, ID | 2.0 | 1.5 | 970 | $1,350 | $1.39 | 23d | 1 | 0.30mi |
| 1435 W Bonneville Cir Unit 1470-103 Nampa, ID | 2.0 | 1.5 | 970 | $1,350 | $1.39 | 3d | 1 | 0.31mi |
| 1275 Caldwell Blvd Nampa, ID | 1.0–3.0 | 1.0–2.0 | 921 | $1,900 | $2.06 | 23d | 1 | 0.34mi |
| 1805 W Bella Ln Nampa, ID | 2.0 | 2.0 | 965 | $1,395 | $1.45 | 21d | 1 | 0.49mi |
| 1825 W Bella Ln Nampa, ID | 2.0 | 2.0 | 880 | $1,395 | $1.59 | 23d | 1 | 0.49mi |
| 1860 W Bella Ln Nampa, ID | 2.0 | 2.0 | 880 | $1,395 | $1.59 | 14d | 1 | 0.51mi |
| 1865 W Bella Ln Nampa, ID | 2.0 | 2.0 | 880 | $1,395 | $1.59 | 23d | 1 | 0.52mi |
| 1925 W Bella Ln Nampa, ID | 2.0 | 2.0 | 965 | $1,395 | $1.45 | 23d | 1 | 0.55mi |
| 1920 W Bella Ln Nampa, ID | 2.0 | 2.0 | 880 | $1,395 | $1.59 | 23d | 1 | 0.55mi |
| 450 W Orchard Ave Nampa, ID | 1.0–3.0 | 1.0–2.0 | 1129 | $1,699 | $1.50 | 3d | 11 | 0.56mi |
| 2084 W Bella Ln Unit 1460910P Nampa, ID | 3.0 | 2.0 | 1237 | $3,905 | $3.16 | 23d | 1 | 0.63mi |
| 16060 N Merchant Way Nampa, ID | 2.0–3.0 | 2.0 | 1115 | $1,695 | $1.52 | 3d | 1 | 0.66mi |
| 9848 W Sand Hill Dr Nampa, ID | 1.0–3.0 | 1.0–2.0 | 1008 | $1,650 | $1.64 | 23d | 1 | 0.79mi |
| 1820 W Camelot Dr Nampa, ID | 3.0 | 2.0 | 1400 | $2,195 | $1.57 | 3d | 1 | 0.80mi |
| 151 N Midland Blvd Unit 101 Nampa, ID | 2.0 | 2.0 | 930 | $1,325 | $1.42 | 14d | 1 | 0.84mi |
| 151 N Midland Blvd Unit 103 Nampa, ID | 2.0 | 2.0 | 930 | $1,325 | $1.42 | 23d | 1 | 0.84mi |
| 617 Purple Sage Dr Nampa, ID | 3.0 | 2.0 | 1104 | $1,795 | $1.63 | 23d | 1 | 0.94mi |
| 11179 W Brassy Cove Loop Nampa, ID | 2.0 | 2.0 | 900 | $1,395 | $1.55 | 3d | 1 | 0.99mi |
| 11199 W Brassy Cove Loop Nampa, ID | 2.0 | 2.0 | 900 | $1,395 | $1.55 | 23d | 1 | 1.01mi |
| 11188 W Brassy Cove Loop Nampa, ID | 2.0 | 2.0 | 900 | $1,395 | $1.55 | 23d | 1 | 1.02mi |
| 11004 W Brassy Cove Loop Nampa, ID | 2.0 | 2.0 | 900 | $1,395 | $1.55 | 21d | 1 | 1.03mi |
| 11010 W Brassy Cove Loop Nampa, ID | 2.0 | 2.0 | 900 | $1,395 | $1.55 | 23d | 1 | 1.03mi |
| 11160 W Brassy Cove Loop Nampa, ID | 2.0 | 2.0 | 900 | $1,395 | $1.55 | 23d | 1 | 1.04mi |
| 15690 N Knightgate Ln Nampa, ID | 2.0–3.0 | 2.0–3.0 | 1239 | $1,825 | $1.47 | 3d | 3 | 1.04mi |
| 11159 W Brassy Cove Loop Nampa, ID | 2.0 | 2.0 | 900 | $1,395 | $1.55 | 23d | 1 | 1.06mi |
| 11028 W Brassy Cove Loop Nampa, ID | 2.0 | 2.0 | 900 | $1,395 | $1.55 | 23d | 1 | 1.06mi |
| 11130 W Ashburn Ln Nampa, ID | 2.0 | 2.0 | 1106 | $1,650 | $1.49 | 14d | 2 | 1.08mi |
| 11034 W Brassy Cove Loop Nampa, ID | 2.0 | 2.0 | 900 | $1,395 | $1.55 | 19d | 1 | 1.08mi |
| 15550 N Kodee Way Nampa, ID | 2.0 | 2.0 | 900 | $1,395 | $1.55 | 14d | 1 | 1.08mi |
| 11039 W Brassy Cove Loop Nampa, ID | 2.0 | 2.0 | 900 | $1,395 | $1.55 | 10d | 1 | 1.08mi |
| 11144 W Brassy Cove Loop Nampa, ID | 2.0 | 2.0 | 900 | $1,395 | $1.55 | 3d | 1 | 1.13mi |
| 11139 W Brassy Cove Loop Nampa, ID | 2.0 | 2.0 | 945 | $1,395 | $1.48 | 14d | 1 | 1.14mi |
| 11139 W Brassy Cove Loop Unit 201 Nampa, ID | 2.0 | 2.0 | 900 | $1,395 | $1.55 | 21d | 1 | 1.14mi |
| 11082 W Brassy Cove Loop Nampa, ID | 2.0 | 2.0 | 900 | $1,395 | $1.55 | 10d | 1 | 1.17mi |
| 11215 W Ashburn Ln Nampa, ID | 2.0–3.0 | 2.0–3.0 | 1176 | $1,825 | $1.55 | 3d | 2 | 1.17mi |
| 11132 W Brassy Cove Loop Nampa, ID | 2.0 | 2.0 | 900 | $1,395 | $1.55 | 3d | 1 | 1.17mi |
| 11214 W Ashburn Ln Nampa, ID | 3.0 | 3.0 | 1301 | $1,825 | $1.40 | 3d | 2 | 1.17mi |
| 11106 W Brassy Cove Loop Nampa, ID | 2.0 | 2.0 | 900 | $1,395 | $1.55 | 3d | 1 | 1.18mi |
Listing history 4 events
-
2025-10-18price $99,900
-
2025-08-14price $119,900
-
2025-06-28$124,900 Active
-
2021-01-29$45,000
ⓘ Source: listings_history table (triggers on properties + properties_extension) + one-shot
backfill from property_details.listing_events for pre-trigger history.
Tax reassessment forecast ID · Resets to sale price
- Current annual tax
- $294 · $25/mo
- Projected year-2 tax
- $689 · $57/mo
- Expected delta
- +$395/yr (+$33/mo · 134.2%)
ⓘ Screening estimate from a state-policy table — verify with the county assessor before closing.
Nearby sold comps map
Loading sold comps map…
Walkable amenities ~0.75 mi
Loading nearby amenities…
Taxation est. · year 1
- Rental income
- $18,605
- − Mortgage interest
- −$5,596
- − Property taxes
- −$294
- − Insurance
- −$500
- − Repairs & maintenance
- −$1,488
- − Management
- −$1,488
- − Depreciation
- −$2,906
- Taxable income
- $6,333
- Est. tax owed @ 24.0%
- −$1,520
- After-tax cash flow
- $6,098/yr
For passive investors: Depreciation is non-cash, so a rental often shows a tax loss while cash-flowing — sheltering income. Rental losses are passive: they offset passive income freely, and up to $25,000/yr can offset ordinary (W-2) income if you actively participate and your MAGI is under $100k (phasing out to $0 by $150k); unused losses carry forward. On sale, claimed depreciation is recaptured at up to 25%, and gains may owe capital-gains tax (a 1031 exchange can defer both). Figures are a year-1 estimate at your 24.0% rate — not tax advice; consult a CPA.
Schools (NCES district)
- District
- Vallivue School District
- NCES district ID
- 1600600
- Math proficiency
- 34% ▼ -9.00%
- Reading proficiency
- 56% ▼ -1.00%
- Median HH income
- $47,377
- Composite
- 38.3/100
- National rank
- #4229
- State rank
- #48 of 92 in ID
Livability — Nampa
- Score
- 72/100
- State rank
- #47
- US rank
- #6250
Category grades
Schools grade is shown separately in the Schools card above.
Census & demographics
- Census place
- Nampa, ID
- County
- Canyon County · 235,358 people
- City population
- 142,249
- Metro
- Boise City, ID
- Population (ZIP)
- 38,121
- Household income
- $69,914
- Rent vs Own
- Severe rent burden
- 723.0
Population outlook (Canyon County) Hauer SSP2
- Today (2025)
- 248,853 people
- By 2030
- 269,596 · +8.3%
- By 2040
- 311,081 · +25.0%
- By 2050
- 350,809 · +41.0%
- By 2075
- 441,884 · +77.6%
- By 2100
- 505,641 · +103.2%
Race, ethnicity, and origin ACS 2023
- Neighborhood character
- Predominantly White (70%)
- Race & ethnicity
- White 70% Hispanic / Latino 24% Two or more races 11%
- Hispanic origin (detail)
- Mexican 20%
- Common ancestry
- Portuguese 3% Slovak 2% Lithuanian 2%
- Foreign-born
- 8% · Canada, Vietnam
- Languages at home
- 81% English-only · Spanish 16% German/W. Germanic 1% Russian/Polish/Slavic 1%
Political lean MEDSL · Canyon
- 2024 margin
- Solid R (+46.6) · D 25.4% · R 72.0% · Other 2.5%
- 2008→2024 swing
- -11.4pp toward R · 2008: -35.2pp · 2024: -46.6pp
- All cycles
- 2024: R+46.6 2020: R+39.7 2016: R+41.8 2012: R+37.1 2008: R+35.2
Not yet ingested
- Civics
- —
Market trends
- HPI YoY
- ▼ -132.40%
- Current HPI
- 335.6717
- Rent YoY
- ▲ 6.41%
- Metro
- Boise City, ID
- State GDP YoY
- ▲ 4.51%
- F500 in state
- 6
Industry mix (Fortune 500 HQ in ID)
| Industry | F500 HQs | Revenue |
|---|---|---|
| Retail | 1 | $79B |
|
||
| Technology | 1 | $25B |
|
||
| Food / Agriculture | 1 | $6B |
|
||
Price history
+122.0% since first listed4 events — show timeline
- 2025-10-18 Price Changed $99,900 IMLS
- 2025-08-14 Price Changed $119,900 IMLS
- 2025-06-28 Listed $124,900 IMLS
- 2021-01-29 Listed $45,000 IMLS
Property tax history
+4.5%/yrLatest (2022): $294 · -6.8% YoY. Source: county tax records.
Cash-flow waterfall
monthlySold comps — $/sqft
last 12 mo · ≤1 miLoading sold comps…