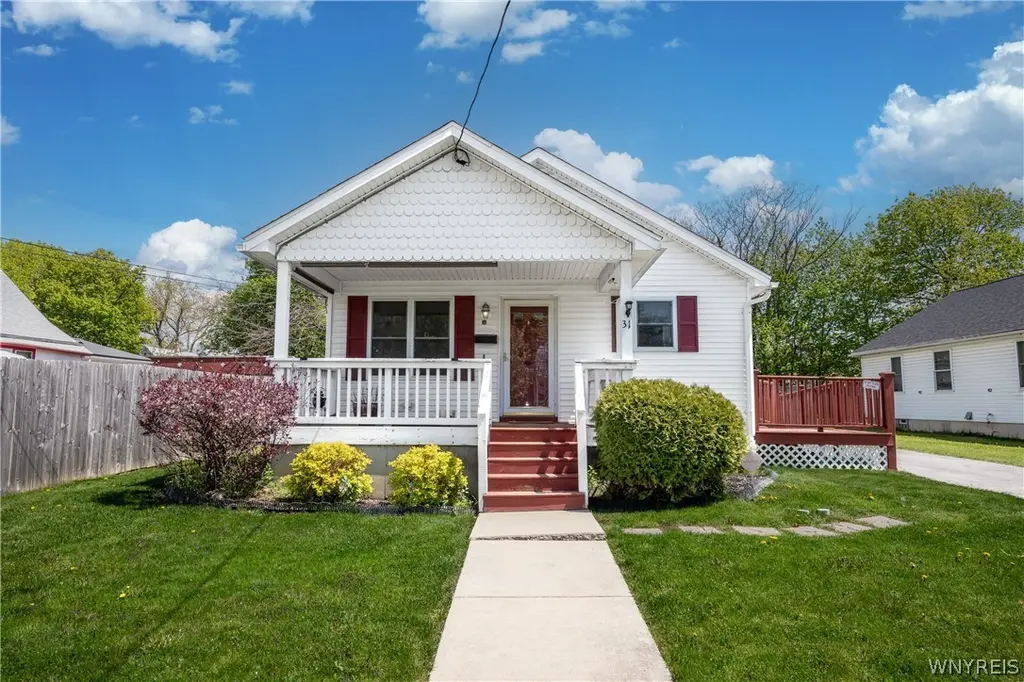
31 Johnson St · Buffalo, NY
Flood risk 1/10 · Minimal
- FEMA flood zone
- X (unshaded)
- Chance of flooding over 30 yrs
- 0.0%
- Est. flood insurance / yr
- $473 – $860
Fire risk 1/10 · Minimal
- Est. fire insurance / yr
- $691 – $1,283
Heat risk 3/10 · Minor
- Hot days now (above 92°F)
- 7 days/yr
- Hot days in 30 yrs
- 15 days/yr
Wind risk 1/10 · Minimal
- Chance of severe wind over 30 yrs
- —
Air-quality risk 3/10 · Minor
- Unhealthy air days now
- 2 days/yr
- Unhealthy air days in 30 yrs
- 3 days/yr
Risk factors via First Street. Map © Google.
Why this score? — see what drove the B grade
The composite is a weighted blend of 9 inputs, each scored 0–100. Each bar is that input's sub-score; the figure is the points it added to the 100-point composite (weight × sub-score).
- Cash flow +30.0/30.0
- DSCR +10.0/10.0
- Appreciation +10.0/10.0
- 1% rule +7.3/10.0
- Livability +3.9/5.0
- Schools +3.3/10.0
- Rent growth +2.5/5.0
- Condition / age +2.5/5.0
- ARV discount +1.9/15.0
$190,000
🖨 Deal sheet 📄 Offer letter ✓ Due diligence
Listing remarks
Welcome to 31 Johnson St—an inviting 3-bedroom, 1-bath, fully fenced Ranch with solid bones, smart system updates, and room to make it your own. Big-ticket items are handled with an updated furnace, roof, and electrical service and hot water tank, for peace of mind. Sun-filled living areas offer flexible layouts, and the kitchen is comfortable with a stove and refrigerator, with clear potential for modernization. Generous bedrooms, a private rear yard, and the possibility of off-street parking add everyday convenience. Set in a convenient Buffalo location near parks, shopping, and quick highway access. Motivated seller and priced to reflect light cosmetic TLC. A well-cared-for Ranch y
Key facts
- Hot water tank
- Fully fenced
- Private rear yard
Tags
Property features AI
Exterior
- Parking: No garage; Driveway parking
- Utilities: Electricity connected (circuit breakers); Public water connected; Sewer connected
- Home design: Single-story (1 story); Frame construction with vinyl siding; Asphalt roof; Poured foundation; Existing condition
- Construction: Built as existing structure; Frame with vinyl siding; Asphalt roof; Poured foundation
- Exterior features: Blacktop driveway; Fully fenced yard; Shed/storage structure; Rectangular residential lot near public transit; City street frontage
Interior
- Kitchen: Dishwasher; Free-standing range; Microwave; Oven; Refrigerator; Eat-in kitchen
- Bedrooms: Three main-level bedrooms (all on the first/main level)
- Flooring: Hardwood; Linoleum; Vinyl; Various flooring
- Bathrooms: One full bathroom (main level)
- Heating & cooling: Gas heating
- Interior features: Accessible approach with ramp; Ceiling fan(s); Separate/formal dining room; Eat-in kitchen; Separate/formal living room; Air filtration; Bedroom on main level; Full basement with egress windows
- Laundry & utility: Washer and dryer; Laundry located in the basement; Gas water heater
Neighborhood map
What this means for you Summary
Snapshot
- This is a 3-bed/1.0-bath single-family listed at $190k.
Deal economics
- At list price, monthly cash flow is $715 ($9k/yr) — positive.
- The deal already cash-flows at list — no discount required.
- Meets the 1% rule at list price ($2k rent vs $190k).
- Cap rate 10.8% vs local median 8.0% in Buffalo — top-decile yield for the area; either an underpriced asset or a hidden risk that comps aren't pricing in. Stress-test before assuming the spread holds.
Location & tenants
- Location reads 77/100 on livability (#195 in NY, #3,011 nationally) — a middle-class / working-renter tenant base. Strengths: commute A+, housing A+, health & safety A+; Watch: crime F, employment D-.
- Buffalo City School District (urban): math 41% / reading 40% proficiency, ranked #535 of 590 in NY (top 91%) — families likely to look elsewhere, expect single-tenant / working-renter base with shorter leases; 75% free/reduced lunch — lower-income household profile, screen leases tightly.
- Market conditions: 83 active listings in the ZIP; 19 comparable units currently listed for rent nearby; rentals at typical pace (median 15d on market — plan ~3-4 weeks tenant-placement turnaround); 1,244 units permitted in Erie County in 2024 (563 in 5+ unit buildings).
Forward outlook
- In year one you build about $20k of equity ($1k loan paydown + $19k appreciation (10.0% local appreciation)).
- At projected returns (10.0% appreciation + 3.0% rent growth), your $53k cash investment doubles in ~2 years — after that, you're playing with house money.
- By year 2, paydown + projected appreciation supports a ~$33k cash-out refi (75% LTV) — recoverable capital for the next deal without selling this one.
Negotiation context
- Only 7 days on market — expect competitive offers; lowballing is unlikely to land.
Questions for the listing agent
- Is there a deadline driving the sale (1031 exchange, divorce, estate, relocation)? That informs how much negotiation room exists.
- Crime grade is F in this area — have there been break-ins, vandalism, or insurance claims at this property in the last 3 years? What carrier currently insures it and at what premium?
- What's the average days-on-market for RENTAL listings here right now (not sales)? A rising rental-DOM trend means longer vacancies and softer asking-rent achievability than the comps imply.
- What's the recent tenant-quality profile in this submarket — average credit score on applications, eviction rate, late-payment / NSF rate, and stable-employment percentage? A property-management company in the area should have these aggregated.
- How much new for-sale + rental construction is in the pipeline within 1–3 miles? Heavy new supply typically softens prices + rents 12–24 months out; constrained supply supports both.
Investment metrics
- 1% rule
- 1.23% ✓
- Cap rate
- 10.81%
- Cash-on-cash
- 16.13%
- DSCR
- 1.72
- GRM
- 6.8
CMA / ARV
- ARV (median comp)
- $169,031
- List price
- $190,000
- Delta
- 12.41%
- Verdict
- OVERPRICED
- Comps
- 20 within 1.0 mi
Show comp detail 12 sales within ~0.75 mi
| Address | Dist | Beds/Ba | Sqft | Sold | Price | $/sf | Match |
|---|---|---|---|---|---|---|---|
| 18 Paderewski Dr | 0.16mi | 3/1.0 | 1,080 (-7%) | 17mo | $65,000 | $60 | 67 |
| 598 High St | 0.57mi | 3/1.0 | 1,139 (-2%) | 7mo | $115,000 | $101 | 65 |
| 23 Guilford St | 0.25mi | 4/1.5 (+1) | 1,322 (+14%) | 1mo | $190,000 | $144 | 57 |
| 323 Jefferson Ave | 0.64mi | 3/2.0 | 1,220 (+6%) | 5mo | $195,000 | $160 | 53 |
| 513 High St | 0.55mi | 3/1.0 | 1,270 (+10%) | 7mo | $95,000 | $75 | 52 |
| 553 William St | 0.52mi | 3/1.5 | 1,279 (+11%) | 5mo | $231,750 | $181 | 52 |
| 95 Peckham St | 0.33mi | 4/1.0 (+1) | 1,249 (+8%) | 18mo | $150,000 | $120 | 51 |
| 189 Reed St | 0.47mi | 4/1.0 (+1) | 1,261 (+9%) | 10mo | $145,000 | $115 | 50 |
| 255 Reed St | 0.58mi | 4/1.0 (+1) | 1,294 (+12%) | 6mo | $125,000 | $97 | 44 |
| 47 John Paul Ct Ct | 0.68mi | 3/2.5 | 1,274 (+10%) | 4mo | $234,900 | $184 | 42 |
| 511 William St | 0.54mi | 2/1.5 (-1) | 990 (-14%) | 2mo | $205,000 | $207 | 42 |
| 70 Camp St | 0.45mi | 3/1.5 | 1,324 (+14%) | 21mo | $245,000 | $185 | 36 |
Match score weights: distance 35% · size 25% · config 20% · recency 20%. Top-matched comps best support the ARV.
Projected returns pro-forma
10.0% appreciation · 3.0% rent growth · sell at horizon
- IRR
- 36.2%
- Equity multiple
- 3.80×
- Total profit
- $148,939
- Equity at exit
- $171,167
- IRR
- 31.2%
- Equity multiple
- 8.57×
- Total profit
- $402,631
- Equity at exit
- $369,128
Cash invested: $53,200 (down + closing). Projections, not guarantees.
Landlord ↔ Tenant lean methodology
- Overall (STATE)
- 15 Strongly Tenant-Friendly
- State New York
- 15 Strongly Tenant-Friendly · D+10
- County
- — inherits STATE
- City
- — inherits STATE
ZIP-level market 14212
- Home prices YoY
- 20.4%
- Active inventory
- 83
- Price-to-rent
- 6.8×
Monthly cashflow live
- Estimated rent
- $2,331 high interval (Pro) →
- Mortgage (P&I)
- −$996
- Tax from tax record
- −$51 /mo · $611/yr
- Insurance
- −$79
- HOA
- −$0
- Vacancy / Maint / Mgmt
- −$490
- Net cashflow
- $715
Break-even live
UW: 25.0% down · 7.5% · 30yr · 1.5% tax · 5.0% vac · 8.0% maint · 8.0% mgmt
Financing live
Cash to close
- Down payment
- $47,500
- Closing costs
- $5,700
- Reserves months
- —
- Total cash needed
- —
Loan-product check · same deal, 3 products live
Conventional
25% down · 7.5% · 30yr
- Down + closing
- —
- Monthly P&I
- —
- Monthly cashflow
- —
- DSCR
- —
- Eligible?
- —
Personal DTI + credit; lowest rate.
DSCR
20% down · 8.5% · 30yr
- Down + closing
- —
- Monthly P&I
- —
- Monthly cashflow
- —
- DSCR
- —
- Eligible?
- —
No personal income docs; deal must DSCR.
Hard money
10% down · 12.0% · 12mo
- Down + closing
- —
- Monthly P&I
- —
- Monthly cashflow
- —
- DSCR
- —
- Eligible?
- —
Short-term bridge; refi at stabilization.
Rent comps 19 comps
| Address | Beds | Baths | Sqft | Rent | $/sqft | DOM | Units | Dist |
|---|---|---|---|---|---|---|---|---|
| 983 Michigan Ave Buffalo, NY | 2.0 | 1.0–2.0 | 804 | $3,202 | $3.98 | 2d | 58 | 0.92mi |
| 140 Seymour St Buffalo, NY | 2.0 | 1.0 | 1300 | $1,800 | $1.38 | 23d | 1 | 1.04mi |
| 140 Seymour St Unit First Floor Buffalo, NY | 2.0 | 1.0 | 1300 | $1,800 | $1.38 | 3d | 1 | 1.04mi |
| 489 Ellicott St Unit 36 Buffalo, NY | 2.0 | 2.0 | 1000 | $1,550 | $1.55 | 3d | 1 | 1.10mi |
| 1145 Michigan Ave Buffalo, NY | 2.0 | 1.0–2.0 | 655 | $2,049 | $3.13 | 43d | 1 | 1.12mi |
| 628 Ellicott St Buffalo, NY | 1.0–2.0 | 1.0–2.0 | 1059 | $2,812 | $2.65 | 2d | 5 | 1.14mi |
| 17 N Pearl St Buffalo, NY | 2.0 | 2.0 | 1077 | $2,700 | $2.51 | 23d | 1 | 1.25mi |
| 17 N Pearl St Unit 3 Buffalo, NY | 3.0 | 2.0 | 1197 | $3,100 | $2.59 | 23d | 1 | 1.25mi |
| 519 Virginia St Buffalo, NY | 1.0–2.0 | 1.0–2.0 | 700 | $1,700 | $2.43 | 3d | 3 | 1.27mi |
| 44 N Pearl St #5 Buffalo, NY | 3.0 | 1.0 | 1200 | $2,400 | $2.00 | 43d | 1 | 1.28mi |
| 465 Washington St Buffalo, NY | 1.0–2.0 | 1.0–2.0 | 1388 | $2,285 | $1.65 | 2d | 5 | 1.29mi |
| 19 North St Buffalo, NY | 2.0 | 1.0–2.0 | 1306 | $2,910 | $2.23 | 10d | 7 | 1.33mi |
| 40 North St Unit 306 Buffalo, NY | 2.0 | 1.5 | 1125 | $1,950 | $1.73 | 43d | 1 | 1.34mi |
| 1155 Main St Buffalo, NY | 2.0 | 1.0–2.0 | 592 | $2,300 | $3.88 | 43d | 1 | 1.36mi |
| 149 Swan St #404 Buffalo, NY | 2.0 | 2.0 | 1237 | $2,050 | $1.66 | 11d | 1 | 1.37mi |
| 149 Swan St #404 Buffalo, NY | 2.0 | 2.0 | 1237 | $2,100 | $1.70 | 23d | 1 | 1.37mi |
| 1152 Main St Apt 3 Buffalo, NY | 3.0 | 1.0 | 1000 | $2,400 | $2.40 | 14d | 1 | 1.38mi |
| 506 Delaware Ave Buffalo, NY | 1.0–2.0 | 1.0–1.5 | 1190 | $2,995 | $2.52 | 10d | 6 | 1.42mi |
| 130 Linwood Ave Buffalo, NY | 2.0 | 1.0 | 900 | $1,900 | $2.11 | 23d | 1 | 1.48mi |
Listing history 1 events
-
2026-05-13$190,000 Active 718-char remark
ⓘ Source: listings_history table (triggers on properties + properties_extension) + one-shot
backfill from property_details.listing_events for pre-trigger history.
Tax reassessment forecast NY · Partial reset (capped growth)
- Current annual tax
- $611 · $51/mo
- Projected year-2 tax
- $1,911 · $159/mo
- Expected delta
- +$1,300/yr (+$108/mo · 212.8%)
ⓘ Screening estimate from a state-policy table — verify with the county assessor before closing.
Climate risk First Street
- Flood 1/10 Low FEMA zone X (unshaded) · 0% chance over 30 yrs
- Wildfire 1/10 Low
- Heat 3/10 Moderate 7 d/yr ≥92°F today · 15 d/yr by 30 yrs out
- Wind 1/10 Low
- Air quality 3/10 Moderate 2 unhealthy d/yr today · 3 by 30 yrs out
Nearby sold comps map
Loading sold comps map…
Walkable amenities ~0.75 mi
Loading nearby amenities…
Taxation est. · year 1
- Rental income
- $27,972
- − Mortgage interest
- −$10,643
- − Property taxes
- −$611
- − Insurance
- −$950
- − Repairs & maintenance
- −$2,238
- − Management
- −$2,238
- − Depreciation
- −$5,527
- Taxable income
- $5,765
- Est. tax owed @ 24.0%
- −$1,384
- After-tax cash flow
- $7,197/yr
For passive investors: Depreciation is non-cash, so a rental often shows a tax loss while cash-flowing — sheltering income. Rental losses are passive: they offset passive income freely, and up to $25,000/yr can offset ordinary (W-2) income if you actively participate and your MAGI is under $100k (phasing out to $0 by $150k); unused losses carry forward. On sale, claimed depreciation is recaptured at up to 25%, and gains may owe capital-gains tax (a 1031 exchange can defer both). Figures are a year-1 estimate at your 24.0% rate — not tax advice; consult a CPA.
Schools (NCES district)
- District
- Buffalo City School District
- NCES district ID
- 3605850
- Math proficiency
- 41% ▲ 11.00%
- Reading proficiency
- 40% ▲ 7.00%
- Median HH income
- $31,665
- Composite
- 33.17/100
- National rank
- #5544
- State rank
- #535 of 590 in NY
Livability — Buffalo
- Score
- 77/100
- State rank
- #195
- US rank
- #3011
Category grades
Schools grade is shown separately in the Schools card above.
Census & demographics
- Census place
- Buffalo, NY
- City population
- 440,021
- Population (ZIP)
- 13,603
Population outlook (Erie County) Hauer SSP2
- Today (2025)
- 933,037 people
- By 2030
- 935,181 · +0.2%
- By 2040
- 928,531 · -0.5%
- By 2050
- 905,725 · -2.9%
- By 2075
- 834,037 · -10.6%
- By 2100
- 708,033 · -24.1%
Race, ethnicity, and origin ACS 2023
- Neighborhood character
- Highly diverse neighborhood (Simpson 0.75)
- Race & ethnicity
- White 32% Black 27% Asian 25% Hispanic / Latino 9% Two or more races 8%
- Hispanic origin (detail)
- Puerto Rican 8%
- Common ancestry
- Romanian 12% Serbian 1% Lithuanian 1%
- Foreign-born
- 20% · Philippines, Canada, China
- Languages at home
- 68% English-only · Other Indo-European 18% Spanish 4% Other Asian/Pacific 2%
Political lean MEDSL · Erie
- 2024 margin
- Lean D (+9.7) · D 54.8% · R 45.2%
- 2008→2024 swing
- -7.9pp toward R · 2008: 17.5pp · 2024: 9.7pp
- All cycles
- 2024: D+9.7 2020: D+14.7 2016: D+4.8 2012: D+15.6 2008: D+17.5
Not yet ingested
- Civics
- —
Market trends
- HPI YoY
- ▲ 79.80%
- Current HPI
- 471.6399
- Rent YoY
- —
- Metro
- —
- State GDP YoY
- ▲ 2.60%
- F500 in state
- 92
Industry mix (Fortune 500 HQ in NY)
| Industry | F500 HQs | Revenue |
|---|---|---|
| Financial Services | 10 | $950B |
|
||
| Consumer Goods | 9 | $162B |
|
||
| Insurance | 4 | $225B |
|
||
| Telecommunications | 2 | $144B |
|
||
| Pharmaceuticals | 2 | $112B |
|
||
| Media / Entertainment | 2 | $69B |
|
||
Price history
2 events — show timeline
- 2026-05-20 Pending — WNYREIS
- 2026-05-13 Listed $190,000 WNYREIS
Property tax history
+9.1%/yrLatest (2025): $611 · +16.0% YoY. Source: county tax records.
Cash-flow waterfall
monthlySold comps — $/sqft
last 12 mo · ≤1 miLoading sold comps…