30158 Sunset Rd · Erie, MN
Flood risk 1/10 · Minimal
- FEMA flood zone
- —
- Chance of flooding over 30 yrs
- 0.0%
- Est. flood insurance / yr
- —
Fire risk 6/10 · Moderate
- Est. fire insurance / yr
- $888 – $1,650
Heat risk 1/10 · Minimal
- Hot days now (above 94°F)
- 7 days/yr
- Hot days in 30 yrs
- 12 days/yr
Wind risk 1/10 · Minimal
- Chance of severe wind over 30 yrs
- —
Air-quality risk 2/10 · Minimal
- Unhealthy air days now
- 2 days/yr
- Unhealthy air days in 30 yrs
- 2 days/yr
Risk factors via First Street. Map © Google.
Why this score? — see what drove the C- grade
The composite is a weighted blend of 9 inputs, each scored 0–100. Each bar is that input's sub-score; the figure is the points it added to the 100-point composite (weight × sub-score).
- Cash flow +21.1/30.0
- ARV discount +7.5/15.0
- DSCR +6.7/10.0
- 1% rule +4.5/10.0
- Schools +4.0/10.0
- Rent growth +2.5/5.0
- Livability +2.5/5.0
- Condition / age +2.5/5.0
- Appreciation +0.0/10.0
$294,900
🖨 Deal sheet 📄 Offer letter ✓ Due diligence
Listing remarks
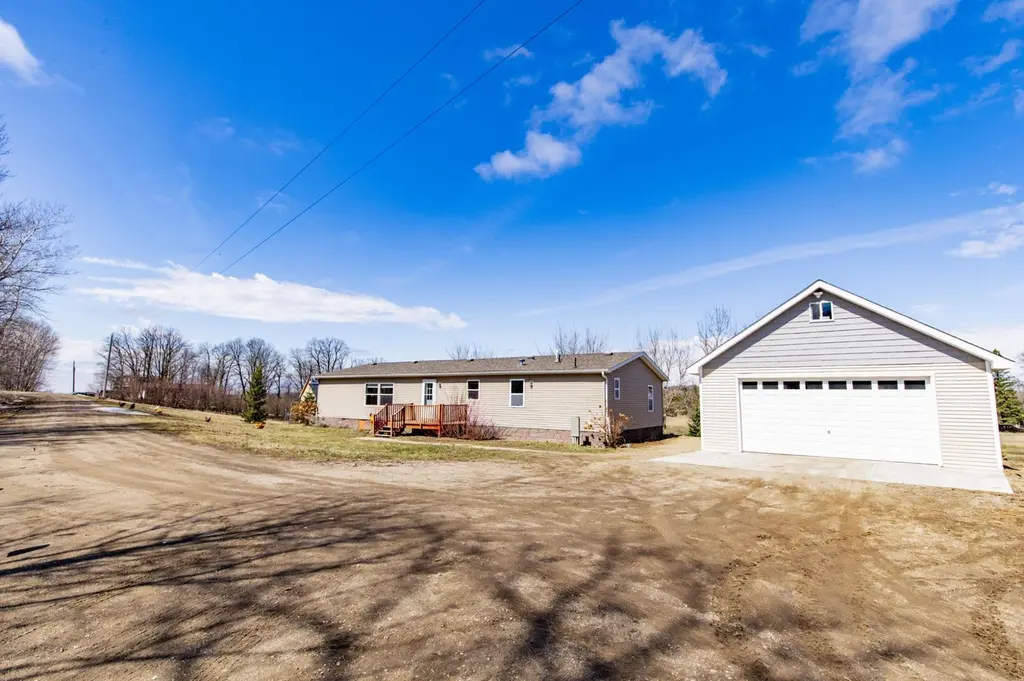
Discover the perfect blend of country and convenience! Available is this 2.5 acre 1792 sq ft home with 3 bedrooms + office, 2 bathrooms, unattached 768 sq ft garage with in-floor heat, floor drain, insulated, w/ office and storage space above. A deck at each entry with the back deck providing a view of the beautiful, peaceful pond. Additionally, this property includes a quaint chicken coop in an ideal location on a dead-end road tarred to the driveway all within 6 miles from Detroit Lakes. This is a well cared for home, built in 2004, and is in immaculate condition. A new well was drilled in 2025, a new garage/storage/office built in 2023, a new septic system added in 2022, new furnace in
Key facts
- 2.5 acre lot
- 2 garage spots
- Built 2004
Neighborhood map
What this means for you Summary
Snapshot
- This is a 3-bed/2.0-bath manufactured listed at $295k.
Deal economics
- At list price, monthly cash flow is $420 ($5k/yr) — positive.
- The deal already cash-flows at list — no discount required.
- To meet the 1% rule (rent ≥ 1% of price), the offer needs to be $279k (5.3% below list).
- Recommended offer: $279k (5.3% below list) — sets the bar for 1% rule.
Location & tenants
- Location reads: area grade C — affects rentability + tenant quality, not the cash-flow math above.
- Detroit Lakes Public School District (town): math 44% / reading 50% proficiency, ranked #155 of 301 in MN (top 52%) — families likely to look elsewhere, expect single-tenant / working-renter base with shorter leases.
- Market conditions: 301 active listings in the ZIP; 156 units permitted in Becker County in 2024 (0 in 5+ unit buildings).
Forward outlook
- Local home prices are declining (-3.0%/yr); year-one equity from $2k of loan paydown is wiped out by about $9k of value loss. Plan a longer hold.
- Becker County population projected at +4% by 2050 — modest demand growth; plan on rents tracking national, not racing it.
Negotiation context
- Only 7 days on market — expect competitive offers; lowballing is unlikely to land.
- 3 sale attempts since 12y ago with the ask held roughly flat each time — persistent listings suggest the price (not the market) is what's stuck; bring a comps-based counter.
- Current owner paid $240k; 23% above their basis — modest negotiation headroom, anchor on the comps not their cost.
Risks & watch-outs
- Climate carrying-cost: major wildfire risk — expect insurance premiums to compound above CPI over the hold.
Questions for the listing agent
- Is there a deadline driving the sale (1031 exchange, divorce, estate, relocation)? That informs how much negotiation room exists.
- What's the average days-on-market for RENTAL listings here right now (not sales)? A rising rental-DOM trend means longer vacancies and softer asking-rent achievability than the comps imply.
- What's the recent tenant-quality profile in this submarket — average credit score on applications, eviction rate, late-payment / NSF rate, and stable-employment percentage? A property-management company in the area should have these aggregated.
- How much new for-sale + rental construction is in the pipeline within 1–3 miles? Heavy new supply typically softens prices + rents 12–24 months out; constrained supply supports both.
Investment metrics
- 1% rule
- 0.95% ✗
- Cap rate
- 8.00%
- Cash-on-cash
- 6.10%
- DSCR
- 1.27
- GRM
- 8.8
CMA / ARV
No comps found within radius.
Projected returns pro-forma
-3.0% appreciation · 3.0% rent growth · sell at horizon
- IRR
- -6.9%
- Equity multiple
- 0.74×
- Total profit
- $-21,161
- Equity at exit
- $43,971
- IRR
- 2.6%
- Equity multiple
- 1.19×
- Total profit
- $15,544
- Equity at exit
- $25,498
Cash invested: $82,572 (down + closing). Projections, not guarantees.
Landlord ↔ Tenant lean methodology
- Overall (STATE)
- 46 Balanced
- State Minnesota
- 46 Balanced · D+2
- County
- — inherits STATE
- City
- — inherits STATE
ZIP-level market 56501
- Active inventory
- 301
- Price-to-rent
- 8.8×
Monthly cashflow live
- Estimated rent
- $2,792 medium interval (Pro) →
- Mortgage (P&I)
- −$1,546
- Tax from tax record
- −$117 /mo · $1,400/yr
- Insurance
- −$123
- HOA
- −$0
- Vacancy / Maint / Mgmt
- −$586
- Net cashflow
- $420
Break-even live
UW: 25.0% down · 7.5% · 30yr · 1.5% tax · 5.0% vac · 8.0% maint · 8.0% mgmt
Financing live
Cash to close
- Down payment
- $73,725
- Closing costs
- $8,847
- Reserves months
- —
- Total cash needed
- —
Loan-product check · same deal, 3 products live
Conventional
25% down · 7.5% · 30yr
- Down + closing
- —
- Monthly P&I
- —
- Monthly cashflow
- —
- DSCR
- —
- Eligible?
- —
Personal DTI + credit; lowest rate.
DSCR
20% down · 8.5% · 30yr
- Down + closing
- —
- Monthly P&I
- —
- Monthly cashflow
- —
- DSCR
- —
- Eligible?
- —
No personal income docs; deal must DSCR.
Hard money
10% down · 12.0% · 12mo
- Down + closing
- —
- Monthly P&I
- —
- Monthly cashflow
- —
- DSCR
- —
- Eligible?
- —
Short-term bridge; refi at stabilization.
Listing history 9 events
-
2026-04-27status Pending
-
2026-04-22historical Contingent - Inspection
-
2026-04-18$294,900 Active
-
2022-08-30soldstatus $239,900
-
2019-02-02historical
-
2014-09-09$317,000
-
2014-09-01price $317,000
-
2014-08-25$317,000
-
2010-06-03soldstatus $39,900
ⓘ Source: listings_history table (triggers on properties + properties_extension) + one-shot
backfill from property_details.listing_events for pre-trigger history.
Tax reassessment forecast MN · Partial reset (capped growth)
- Current annual tax
- $1,400 · $117/mo
- Projected year-2 tax
- $2,351 · $196/mo
- Expected delta
- +$951/yr (+$79/mo · 68.0%)
ⓘ Screening estimate from a state-policy table — verify with the county assessor before closing.
Climate risk First Street
- Flood 1/10 Low 0% chance over 30 yrs
- Wildfire 6/10 Major
- Heat 1/10 Low 7 d/yr ≥94°F today · 12 d/yr by 30 yrs out
- Wind 1/10 Low
- Air quality 2/10 Low 2 unhealthy d/yr today · 2 by 30 yrs out
Nearby sold comps map
Loading sold comps map…
Walkable amenities ~0.75 mi
Loading nearby amenities…
Taxation est. · year 1
- Rental income
- $33,506
- − Mortgage interest
- −$16,519
- − Property taxes
- −$1,400
- − Insurance
- −$1,474
- − Repairs & maintenance
- −$2,681
- − Management
- −$2,681
- − Depreciation
- −$8,579
- Taxable income
- $173
- Est. tax owed @ 24.0%
- −$42
- After-tax cash flow
- $4,996/yr
For passive investors: Depreciation is non-cash, so a rental often shows a tax loss while cash-flowing — sheltering income. Rental losses are passive: they offset passive income freely, and up to $25,000/yr can offset ordinary (W-2) income if you actively participate and your MAGI is under $100k (phasing out to $0 by $150k); unused losses carry forward. On sale, claimed depreciation is recaptured at up to 25%, and gains may owe capital-gains tax (a 1031 exchange can defer both). Figures are a year-1 estimate at your 24.0% rate — not tax advice; consult a CPA.
Schools (NCES district)
- District
- Detroit Lakes Public School District
- NCES district ID
- 2710230
- Math proficiency
- 44% ▼ -11.00%
- Reading proficiency
- 50% ▼ -11.00%
- Median HH income
- $50,571
- Composite
- 40.33/100
- National rank
- #3746
- State rank
- #155 of 301 in MN
Livability — Erie
No livability data for this city. (Only ~50 U.S. cities are tracked.)
Census & demographics
- Population (ZIP)
- 18,239
Population outlook (Becker County) Hauer SSP2
- Today (2025)
- 34,604 people
- By 2030
- 35,095 · +1.4%
- By 2040
- 35,691 · +3.1%
- By 2050
- 35,869 · +3.7%
- By 2075
- 36,103 · +4.3%
- By 2100
- 32,798 · -5.2%
Race, ethnicity, and origin ACS 2023
- Neighborhood character
- Predominantly White (91%)
- Race & ethnicity
- White 91% Two or more races 5% Native American 2%
- Common ancestry
- Portuguese 25% Scottish 4% Lithuanian 3%
- Foreign-born
- 1% · Canada
- Languages at home
- 98% English-only · Spanish 1%
Political lean MEDSL · Becker
- 2024 margin
- Solid R (+33.1) · D 32.7% · R 65.8% · Other 1.5%
- 2008→2024 swing
- -26.3pp toward R · 2008: -6.9pp · 2024: -33.1pp
- All cycles
- 2024: R+33.1 2020: R+30.1 2016: R+33.2 2012: R+14.6 2008: R+6.9
Not yet ingested
- Civics
- —
Market trends
- HPI YoY
- ▼ -222.40%
- Current HPI
- 217.4973
- Rent YoY
- —
- Metro
- —
- State GDP YoY
- ▲ 2.41%
- F500 in state
- 34
Industry mix (Fortune 500 HQ in MN)
| Industry | F500 HQs | Revenue |
|---|---|---|
| Healthcare | 2 | $407B |
|
||
| Retail | 2 | $150B |
|
||
| Consumer Goods | 2 | $32B |
|
||
| Industrial Machinery | 2 | $6B |
|
||
| Agriculture | 1 | $40B |
|
||
| Healthcare / Medical Devices | 1 | $32B |
|
||
Price history
+639.1% since first listed9 events — show timeline
- 2026-04-27 Pending — NORTHSTARMLS as Distributed by MLS Grid
- 2026-04-22 Contingent — NORTHSTARMLS as Distributed by MLS Grid
- 2026-04-18 Listed $294,900 NORTHSTARMLS as Distributed by MLS Grid
- 2022-08-30 Sold (Public Records) $239,900 Public Records
- 2019-02-02 Listing Removed — NORTHSTARMLS as Distributed by MLS Grid
- 2014-09-09 Listed $317,000 NORTHSTARMLS as Distributed by MLS Grid
- 2014-09-01 Price Changed $317,000 NORTHSTARMLS as Distributed by MLS Grid
- 2014-08-25 Listed $317,000 NORTHSTARMLS as Distributed by MLS Grid
- 2010-06-03 Sold (Public Records) $39,900 Public Records
Property tax history
+8.1%/yrLatest (2025): $1,400 · +37.0% YoY. Source: county tax records.
Cash-flow waterfall
monthlySold comps — $/sqft
last 12 mo · ≤1 miLoading sold comps…