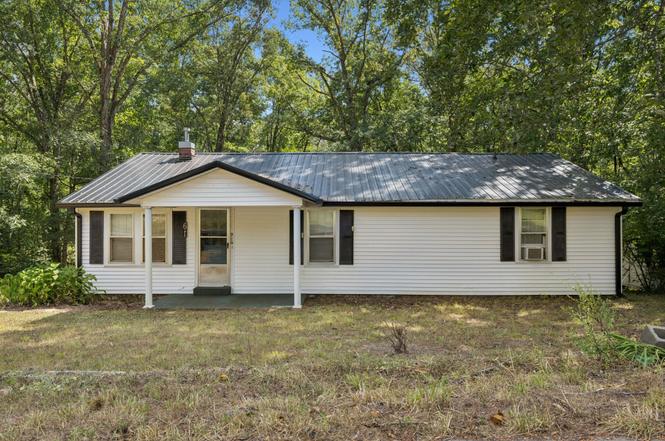
61 Brazzle Rd · Waverly, TN
Flood risk 1/10 · Minimal
- FEMA flood zone
- X (unshaded)
- Chance of flooding over 30 yrs
- 0.0%
- Est. flood insurance / yr
- $507 – $1,088
Fire risk 5/10 · Moderate
- Est. fire insurance / yr
- $949 – $1,763
Heat risk 5/10 · Moderate
- Hot days now (above 107°F)
- 7 days/yr
- Hot days in 30 yrs
- 20 days/yr
Wind risk 4/10 · Minor
- Chance of severe wind over 30 yrs
- 12.0%
Air-quality risk 1/10 · Minimal
- Unhealthy air days now
- 0 days/yr
- Unhealthy air days in 30 yrs
- 0 days/yr
Risk factors via First Street. Map © Google.
Why this score? — see what drove the B+ grade
The composite is a weighted blend of 9 inputs, each scored 0–100. Each bar is that input's sub-score; the figure is the points it added to the 100-point composite (weight × sub-score).
- Cash flow +30.0/30.0
- ARV discount +15.0/15.0
- 1% rule +10.0/10.0
- DSCR +10.0/10.0
- Livability +3.1/5.0
- Appreciation +2.8/10.0
- Rent growth +2.5/5.0
- Condition / age +2.5/5.0
- Schools +1.9/10.0
$99,999
🖨 Deal sheet 📄 Offer letter ✓ Due diligence
Listing remarks
* * * INVESTORS ALERT * * * FIXER * * * THIS IS EXACTLY WHAT YOU HAVE BEEN LOOKING FOR! MAKE IT YOUR OWN. ALSO, NOT ONLY DOES THIS PROPERTY HAVE THE ABILITY TO FLIP BUT, IN ADDITION THERE IS A POSSIBILITY OF A LOT SPLIT WITH ROAD FRONTAGE OF 478'. THE COVERED DECK OFFERS PRIVACY, SECLUSION, PEACE!, AND QUIET! PROPERTY HAS A UTILITY/LAUNDRY ROOM. DEFINITELY REMINDS YOU OF AN OLD COUNTRY HOME WITH A LARGE EAT IN KITCHEN. THERE IS A NICE SHED INCLUDED. CONVENIENTLY LOCATED ONLY MINUTES TO KENTUCKY LAKE, HWY 13 & HWY 70. A DIAMOND IN THE ROUGH ON ALMOST 2 ACRES AND ONLY MINUTES TO TOWN. CITY WATER AVAILABLE ACROSS THE STREET. WELL HAS BEEN DISCONNECTED. ON SEPTIC, CHECK WITH THE C
Key facts
- Covered deck
- Lot split
- Large eat in kitchen
Tags
Neighborhood map
What this means for you Summary
Snapshot
- This is a 4-bed/1.0-bath single-family listed at $100k.
Deal economics
- At list price, monthly cash flow is $605 ($7k/yr) — positive.
- The deal already cash-flows at list — no discount required.
- Meets the 1% rule at list price ($2k rent vs $100k).
- Recommended offer: $88k (12.0% below list) — sets the bar for market timing.
- Cap rate 13.6% vs local median 2.8% in Waverly — top-decile yield for the area; either an underpriced asset or a hidden risk that comps aren't pricing in. Stress-test before assuming the spread holds.
Location & tenants
- Location reads 62/100 on livability (#209 in TN) — a middle-class / working-renter tenant base. Strengths: crime A+, cost of living A+, housing A; Watch: amenities F, commute F, employment F.
- Humphreys County (rural): math 21% / reading 24% proficiency, ranked #103 of 139 in TN (top 74%) — low school quality limits family demand, transient renter base, plan for 1-2y turnover.
- Zoned schools: Waverly Elementary (math 47% / reading 37%, grade F, #191 of 952 statewide, top 22%, 359 students, 0% FRL); Waverly Central High School (math 8% / reading 37%, grade F, #156 of 332 statewide, top 49%, 503 students, 0% FRL) — zoned schools average 0% FRL vs 49% district-wide (49 pts lower); this property's tenant base skews higher-income than the district average.
- Market conditions: 155 active listings in the ZIP; 39 units permitted in Humphreys County in 2024 (0 in 5+ unit buildings).
Forward outlook
- Local home prices are declining (-3.0%/yr); year-one equity from $691 of loan paydown is wiped out by about $3k of value loss. Plan a longer hold.
- Humphreys County population projected at -18% by 2050 — secular population decline; favor cash flow + early exit over multi-decade hold.
- At projected returns (-3.0% appreciation + 3.0% rent growth), your $28k cash investment doubles in ~5 years — after that, you're playing with house money.
Negotiation context
- It's been on market 202 days — a 12% lower offer ($88k) is reasonable based on typical stale-listing flexibility.
- Current owner paid $75k; 33% above their basis — modest negotiation headroom, anchor on the comps not their cost.
Risks & watch-outs
- Watch-outs: built in 1956 — expect roof / HVAC / electrical / plumbing capex.
- Climate carrying-cost: moderate wildfire risk; extreme-heat days projected 7→20/yr by 2055 (HVAC capex compounding) — expect insurance premiums to compound above CPI over the hold.
Questions for the listing agent
- It's been on market 202 days. Have you received any prior offers? Is the seller open to a 12% concession, seller financing, or rate buy-down credit?
- Built in 1956 — when were the roof, HVAC, electrical panel, plumbing, and water heater last replaced?
- Why hasn't it sold? Are there any deal-killer items the seller is aware of (foundation, flood, title, zoning, code violations)?
- Is there a deadline driving the sale (1031 exchange, divorce, estate, relocation)? That informs how much negotiation room exists.
- Schools are D-rated, which usually means shorter tenancies and higher turnover. Who's the typical renter profile here, and what's been the actual vacancy rate?
- What's the average days-on-market for RENTAL listings here right now (not sales)? A rising rental-DOM trend means longer vacancies and softer asking-rent achievability than the comps imply.
- What's the recent tenant-quality profile in this submarket — average credit score on applications, eviction rate, late-payment / NSF rate, and stable-employment percentage? A property-management company in the area should have these aggregated.
- How much new for-sale + rental construction is in the pipeline within 1–3 miles? Heavy new supply typically softens prices + rents 12–24 months out; constrained supply supports both.
Investment metrics
- 1% rule
- 1.52% ✓
- Cap rate
- 13.55%
- Cash-on-cash
- 25.92%
- DSCR
- 2.15
- GRM
- 5.5
CMA / ARV
- ARV (on-the-fly)
- $176,250
- Comps found
- 3
Show comp detail 3 sales within ~0.75 mi
| Address | Dist | Beds/Ba | Sqft | Sold | Price | $/sf | Match |
|---|---|---|---|---|---|---|---|
| 61 Brazzle Rd | 0.00mi | 4/1.0 | 1,410 (0%) | 1mo | $90,000 | $64 | 100 |
| 457 E Little Richland Rd | 0.22mi | 4/2.0 | 1,560 (+11%) | 6mo | $195,000 | $125 | 63 |
| 105 Eze Ave | 0.72mi | 3/1.0 (-1) | 1,350 (-4%) | 7mo | $199,000 | $147 | 48 |
Match score weights: distance 35% · size 25% · config 20% · recency 20%. Top-matched comps best support the ARV.
Projected returns pro-forma
-3.0% appreciation · 3.0% rent growth · sell at horizon
- IRR
- 19.6%
- Equity multiple
- 1.80×
- Total profit
- $22,287
- Equity at exit
- $14,910
- IRR
- 27.8%
- Equity multiple
- 3.46×
- Total profit
- $68,871
- Equity at exit
- $8,646
Cash invested: $28,000 (down + closing). Projections, not guarantees.
Landlord ↔ Tenant lean methodology
- Overall (STATE)
- 87 Strongly Landlord-Friendly
- State Tennessee
- 87 Strongly Landlord-Friendly · R+13
- County
- — inherits STATE
- City
- — inherits STATE
ZIP-level market 37185
- Home prices YoY
- -1.3%
- Active inventory
- 155
- Price-to-rent
- 5.5×
Monthly cashflow live
- Estimated rent
- $1,520 medium interval (Pro) →
- Mortgage (P&I)
- −$524
- Tax from tax record
- −$30 /mo · $359/yr
- Insurance
- −$42
- HOA
- −$0
- Vacancy / Maint / Mgmt
- −$319
- Net cashflow
- $605
Break-even live
UW: 25.0% down · 7.5% · 30yr · 1.5% tax · 5.0% vac · 8.0% maint · 8.0% mgmt
Financing live
Cash to close
- Down payment
- $25,000
- Closing costs
- $3,000
- Reserves months
- —
- Total cash needed
- —
Loan-product check · same deal, 3 products live
Conventional
25% down · 7.5% · 30yr
- Down + closing
- —
- Monthly P&I
- —
- Monthly cashflow
- —
- DSCR
- —
- Eligible?
- —
Personal DTI + credit; lowest rate.
DSCR
20% down · 8.5% · 30yr
- Down + closing
- —
- Monthly P&I
- —
- Monthly cashflow
- —
- DSCR
- —
- Eligible?
- —
No personal income docs; deal must DSCR.
Hard money
10% down · 12.0% · 12mo
- Down + closing
- —
- Monthly P&I
- —
- Monthly cashflow
- —
- DSCR
- —
- Eligible?
- —
Short-term bridge; refi at stabilization.
Listing history 4 events
-
2026-03-06status Pending
-
2026-01-14price $99,999
-
2025-08-15$104,900 Active
-
2023-07-10soldstatus $75,000
ⓘ Source: listings_history table (triggers on properties + properties_extension) + one-shot
backfill from property_details.listing_events for pre-trigger history.
Tax reassessment forecast TN · Resets to sale price
- Current annual tax
- $359 · $30/mo
- Projected year-2 tax
- $710 · $59/mo
- Expected delta
- +$351/yr (+$29/mo · 97.8%)
ⓘ Screening estimate from a state-policy table — verify with the county assessor before closing.
Climate risk First Street
- Flood 1/10 Low FEMA zone X (unshaded) · 0% chance over 30 yrs
- Wildfire 5/10 Major
- Heat 5/10 Major 7 d/yr ≥107°F today · 20 d/yr by 30 yrs out
- Wind 4/10 Moderate 12% chance of damaging wind over 30 yrs
- Air quality 1/10 Low 0 unhealthy d/yr today · 0 by 30 yrs out
Nearby sold comps map
Loading sold comps map…
Walkable amenities ~0.75 mi
Loading nearby amenities…
Taxation est. · year 1
- Rental income
- $18,241
- − Mortgage interest
- −$5,601
- − Property taxes
- −$359
- − Insurance
- −$500
- − Repairs & maintenance
- −$1,459
- − Management
- −$1,459
- − Depreciation
- −$2,909
- Taxable income
- $5,953
- Est. tax owed @ 24.0%
- −$1,429
- After-tax cash flow
- $5,830/yr
For passive investors: Depreciation is non-cash, so a rental often shows a tax loss while cash-flowing — sheltering income. Rental losses are passive: they offset passive income freely, and up to $25,000/yr can offset ordinary (W-2) income if you actively participate and your MAGI is under $100k (phasing out to $0 by $150k); unused losses carry forward. On sale, claimed depreciation is recaptured at up to 25%, and gains may owe capital-gains tax (a 1031 exchange can defer both). Figures are a year-1 estimate at your 24.0% rate — not tax advice; consult a CPA.
Schools (NCES district)
- District
- Humphreys County
- NCES district ID
- 4701980
- Math proficiency
- 21% ▼ -14.00%
- Reading proficiency
- 24% ▼ -9.00%
- Median HH income
- $41,248
- Composite
- 19.14/100
- National rank
- #8829
- State rank
- #103 of 139 in TN
Livability — Waverly
- Score
- 62/100
- State rank
- #209
- US rank
- #16116
Category grades
Schools grade is shown separately in the Schools card above.
Census & demographics
- Population (ZIP)
- 9,120
Population outlook (Humphreys County) Hauer SSP2
- Today (2025)
- 17,256 people
- By 2030
- 16,654 · -3.5%
- By 2040
- 15,437 · -10.5%
- By 2050
- 14,238 · -17.5%
- By 2075
- 11,971 · -30.6%
- By 2100
- 10,575 · -38.7%
Race, ethnicity, and origin ACS 2023
- Neighborhood character
- Predominantly White (88%)
- Race & ethnicity
- White 88% Two or more races 5% Black 3% Hispanic / Latino 3%
- Common ancestry
- Slovak 4% Romanian 2% English 1%
- Foreign-born
- 3% · Canada
- Languages at home
- 98% English-only · Spanish 1% Tagalog/Filipino 1%
Political lean MEDSL · Humphreys
- 2024 margin
- Solid R (+56.1) · D 21.4% · R 77.4% · Other 1.2%
- 2008→2024 swing
- -53.2pp toward R · 2008: -2.9pp · 2024: -56.1pp
- All cycles
- 2024: R+56.1 2020: R+49.8 2016: R+41.5 2012: R+13.5 2008: R+2.9
Not yet ingested
- Civics
- —
Market trends
- HPI YoY
- ▼ -4.36%
- Current HPI
- 335.9664
- Rent YoY
- —
- Metro
- —
- State GDP YoY
- ▲ 2.78%
- F500 in state
- 22
Industry mix (Fortune 500 HQ in TN)
| Industry | F500 HQs | Revenue |
|---|---|---|
| Healthcare | 3 | $91B |
|
||
| Retail | 3 | $72B |
|
||
| Transportation / Logistics | 1 | $88B |
|
||
| Paper / Packaging | 1 | $19B |
|
||
| Insurance | 1 | $13B |
|
||
| Energy | 1 | $12B |
|
||
Price history
+33.3% since first listed4 events — show timeline
- 2026-03-06 Pending — REALTRACS as Distributed by MLS Grid
- 2026-01-14 Price Changed $99,999 REALTRACS as Distributed by MLS Grid
- 2025-08-15 Listed $104,900 REALTRACS as Distributed by MLS Grid
- 2023-07-10 Sold (Public Records) $75,000 Public Records
Property tax history
+6.0%/yrLatest (2025): $359 · +0.0% YoY. Source: county tax records.
Cash-flow waterfall
monthlySold comps — $/sqft
last 12 mo · ≤1 miLoading sold comps…