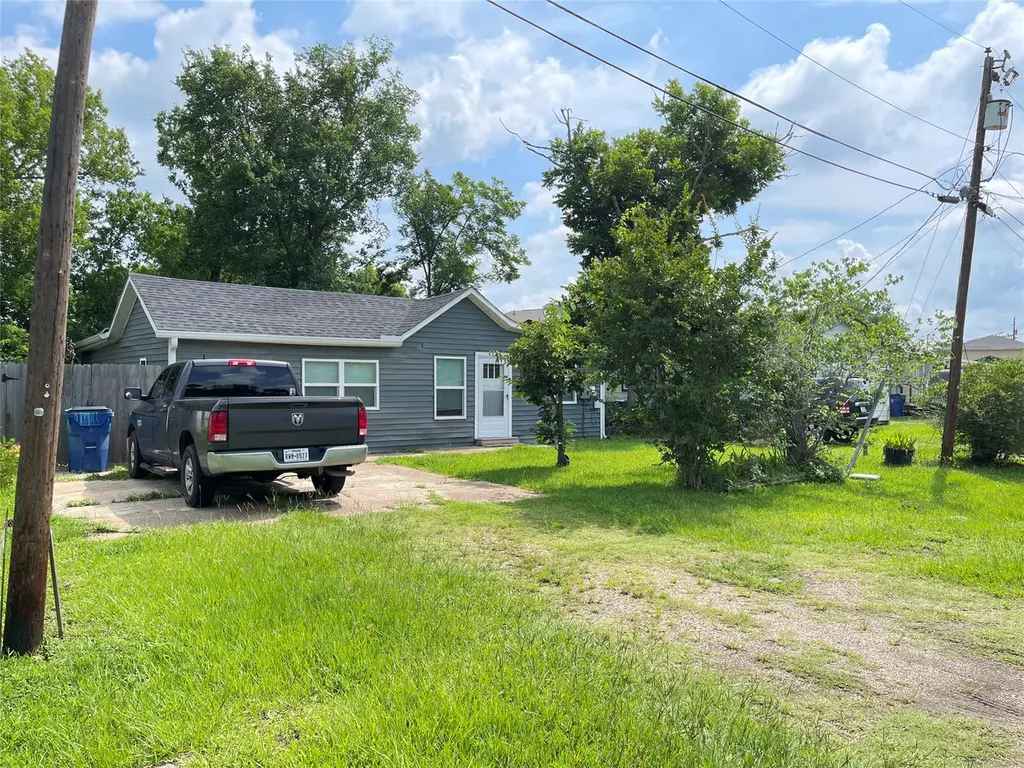
103 Prewitt Ln · West Columbia, TX
Flood risk 6/10 · Moderate
- FEMA flood zone
- X (unshaded)
- Chance of flooding over 30 yrs
- 0.71%
- Est. flood insurance / yr
- $507 – $1,088
Fire risk 4/10 · Minor
- Est. fire insurance / yr
- $1,222 – $2,270
Heat risk 9/10 · Severe
- Hot days now (above 109°F)
- 7 days/yr
- Hot days in 30 yrs
- 25 days/yr
Wind risk 9/10 · Severe
- Chance of severe wind over 30 yrs
- 99.0%
Air-quality risk 2/10 · Minimal
- Unhealthy air days now
- 2 days/yr
- Unhealthy air days in 30 yrs
- 2 days/yr
Risk factors via First Street. Map © Google.
Why this score? — see what drove the B- grade
The composite is a weighted blend of 9 inputs, each scored 0–100. Each bar is that input's sub-score; the figure is the points it added to the 100-point composite (weight × sub-score).
- Cash flow +21.5/30.0
- ARV discount +15.0/15.0
- Appreciation +8.8/10.0
- DSCR +6.9/10.0
- 1% rule +6.1/10.0
- Livability +3.5/5.0
- Schools +3.0/10.0
- Rent growth +2.5/5.0
- Condition / age +2.5/5.0
$120,000
🖨 Deal sheet 📄 Offer letter ✓ Due diligence
Listing remarks MLS
Cute 3-bedroom 1-bath home in West Columbia. Home boasts open concept, kitchen and bath have been updated. The roof is 2 years old, new energy-efficient windows, water heater is 2 years old, HVAC is 1.5 years old and the sewer line has been replaced all the way to the meter. The home was recently fully fenced in the back and has lots of privacy. The home sits within walking distance to HEB and other shopping in town. Schedule your showing today while you still can!! This one will not last long.
Key facts
- Updated bath
- Open concept
- New hvac
Tags
Neighborhood map
What this means for you Summary
Snapshot
- This is a 3-bed/1.0-bath single-family listed at $120k.
Deal economics
- At list price, monthly cash flow is $180 ($2k/yr) — positive.
- The deal already cash-flows at list — no discount required.
- Meets the 1% rule at list price ($1k rent vs $120k).
- Recommended offer: $106k (12.0% below list) — sets the bar for market timing.
- Cap rate 8.1% vs local median 4.4% in West Columbia — top-decile yield for the area; either an underpriced asset or a hidden risk that comps aren't pricing in. Stress-test before assuming the spread holds.
Location & tenants
- Location reads 70/100 on livability (#375 in TX) — a middle-class / working-renter tenant base. Strengths: cost of living A+, housing A+, health & safety B+; Watch: schools D, amenities F, commute F.
- Columbia-Brazoria ISD (town): math 35% / reading 33% proficiency, ranked #513 of 826 in TX (top 62%) — families likely to look elsewhere, expect single-tenant / working-renter base with shorter leases.
- Market conditions: 145 active listings in the ZIP; 5 comparable units currently listed for rent nearby; rentals lingering (median 44d on market — plan ~5-8 weeks vacancy on turnover, expect pricing pressure); 60% of comp listings sitting > 30 days — soft ceiling on asking rent; 3,960 units permitted in Brazoria County in 2024 (593 in 5+ unit buildings).
Forward outlook
- In year one you build about $10k of equity ($830 loan paydown + $9k appreciation (7.6% local appreciation)).
- Brazoria County population projected at +44% by 2050 — long-run rental-demand tailwind backs the buy-and-hold thesis.
- At projected returns (7.6% appreciation + 3.0% rent growth), your $34k cash investment doubles in ~3 years — after that, you're playing with house money.
- By year 4, paydown + projected appreciation supports a ~$34k cash-out refi (75% LTV) — recoverable capital for the next deal without selling this one.
Negotiation context
- It's been on market 379 days — a 12% lower offer ($106k) is reasonable based on typical stale-listing flexibility.
- 3 sale attempts since 3y ago with the ask held roughly flat each time — persistent listings suggest the price (not the market) is what's stuck; bring a comps-based counter.
Risks & watch-outs
- Watch-outs: built in 1946 — expect roof / HVAC / electrical / plumbing capex.
- Climate carrying-cost: major flood risk; severe wind risk, 99% chance of damaging wind over 30y; extreme-heat days projected 7→25/yr by 2055 (HVAC capex compounding) — expect insurance premiums to compound above CPI over the hold.
Questions for the listing agent
- It's been on market 379 days. Have you received any prior offers? Is the seller open to a 12% concession, seller financing, or rate buy-down credit?
- Built in 1946 — when were the roof, HVAC, electrical panel, plumbing, and water heater last replaced?
- Why hasn't it sold? Are there any deal-killer items the seller is aware of (foundation, flood, title, zoning, code violations)?
- Is there a deadline driving the sale (1031 exchange, divorce, estate, relocation)? That informs how much negotiation room exists.
- Schools are D-rated, which usually means shorter tenancies and higher turnover. Who's the typical renter profile here, and what's been the actual vacancy rate?
- What's the average days-on-market for RENTAL listings here right now (not sales)? A rising rental-DOM trend means longer vacancies and softer asking-rent achievability than the comps imply.
- What's the recent tenant-quality profile in this submarket — average credit score on applications, eviction rate, late-payment / NSF rate, and stable-employment percentage? A property-management company in the area should have these aggregated.
- How much new for-sale + rental construction is in the pipeline within 1–3 miles? Heavy new supply typically softens prices + rents 12–24 months out; constrained supply supports both.
Investment metrics
- 1% rule
- 1.11% ✓
- Cap rate
- 8.10%
- Cash-on-cash
- 6.44%
- DSCR
- 1.29
- GRM
- 7.5
CMA / ARV
- ARV (median comp)
- $173,010
- List price
- $120,000
- Delta
- -30.64%
- Verdict
- UNDERPRICED
- Comps
- 20 within 1.0 mi
Show comp detail 12 sales within ~0.75 mi
| Address | Dist | Beds/Ba | Sqft | Sold | Price | $/sf | Match |
|---|---|---|---|---|---|---|---|
| 425 W Brazos Ave | 0.46mi | 2/1.0 (-1) | 1,246 (+2%) | 4mo | $75,000 | $60 | 66 |
| 104 Prewitt Ln | 0.03mi | 2/1.0 (-1) | 1,120 (-8%) | 18mo | $72,000 | $64 | 66 |
| 701 Blair St | 0.67mi | 3/1.0 | 1,240 (+2%) | 2mo | $99,497 | $80 | 64 |
| 624 Houston St | 0.42mi | 3/1.0 | 1,136 (-7%) | 8mo | $155,000 | $136 | 63 |
| 114 N 15th St | 0.32mi | 2/1.0 (-1) | 1,107 (-9%) | 4mo | $60,000 | $54 | 62 |
| 621 Humble St | 0.73mi | 3/2.0 | 1,203 (-1%) | 4mo | $215,900 | $179 | 56 |
| 141 Shady Ln | 0.62mi | 3/2.0 | 1,240 (+2%) | 10mo | $240,000 | $194 | 55 |
| 147 Ellis Ln | 0.27mi | 3/2.0 | 1,303 (+7%) | 20mo | $239,900 | $184 | 54 |
| 440 W Brazos Ave | 0.47mi | 3/2.0 | 1,034 (-15%) | 2mo | $173,900 | $168 | 48 |
| 610 S Gray Ave | 0.74mi | 2/1.0 (-1) | 1,187 (-2%) | 11mo | $159,000 | $134 | 47 |
| 100 S 12 Th St | 0.58mi | 3/2.0 | 1,367 (+12%) | 6mo | $225,000 | $165 | 43 |
| 158 Shady Ln | 0.62mi | 3/1.5 | 1,340 (+10%) | 17mo | $125,000 | $93 | 38 |
Match score weights: distance 35% · size 25% · config 20% · recency 20%. Top-matched comps best support the ARV.
Projected returns pro-forma
7.63% appreciation · 3.0% rent growth · sell at horizon
- IRR
- 24.2%
- Equity multiple
- 2.73×
- Total profit
- $58,131
- Equity at exit
- $88,155
- IRR
- 22.1%
- Equity multiple
- 5.77×
- Total profit
- $160,188
- Equity at exit
- $172,190
Cash invested: $33,600 (down + closing). Projections, not guarantees.
Landlord ↔ Tenant lean methodology
- Overall (STATE)
- 87 Strongly Landlord-Friendly
- State Texas
- 87 Strongly Landlord-Friendly · R+5
- County
- — inherits STATE
- City
- — inherits STATE
ZIP-level market 77486
- Home prices YoY
- 2.4%
- Active inventory
- 145
- Price-to-rent
- 7.5×
Monthly cashflow live
- Estimated rent
- $1,333 high interval (Pro) →
- Mortgage (P&I)
- −$629
- Tax from tax record
- −$193 /mo · $2,320/yr
- Insurance
- −$50
- HOA
- −$0
- Vacancy / Maint / Mgmt
- −$280
- Net cashflow
- $180
Break-even live
UW: 25.0% down · 7.5% · 30yr · 1.5% tax · 5.0% vac · 8.0% maint · 8.0% mgmt
Financing live
Cash to close
- Down payment
- $30,000
- Closing costs
- $3,600
- Reserves months
- —
- Total cash needed
- —
Loan-product check · same deal, 3 products live
Conventional
25% down · 7.5% · 30yr
- Down + closing
- —
- Monthly P&I
- —
- Monthly cashflow
- —
- DSCR
- —
- Eligible?
- —
Personal DTI + credit; lowest rate.
DSCR
20% down · 8.5% · 30yr
- Down + closing
- —
- Monthly P&I
- —
- Monthly cashflow
- —
- DSCR
- —
- Eligible?
- —
No personal income docs; deal must DSCR.
Hard money
10% down · 12.0% · 12mo
- Down + closing
- —
- Monthly P&I
- —
- Monthly cashflow
- —
- DSCR
- —
- Eligible?
- —
Short-term bridge; refi at stabilization.
Rent comps 5 comps
| Address | Beds | Baths | Sqft | Rent | $/sqft | DOM | Units | Dist |
|---|---|---|---|---|---|---|---|---|
| 136 Ellis Ln Unit C West Columbia, TX | 2.0 | 2.0 | 900 | $1,350 | $1.50 | 11d | 1 | 0.29mi |
| 136 Ellis Ln Unit C West Columbia, TX | 2.0 | 2.0 | 900 | $1,350 | $1.50 | 7d | 1 | 0.29mi |
| 1106 S Columbia Dr Apt B West Columbia, TX | 2.0 | 2.0 | 1000 | $1,350 | $1.35 | 43d | 1 | 1.22mi |
| 1106 S Columbia Dr West Columbia, TX | 2.0 | 2.0 | 1000 | $1,250 | $1.25 | 43d | 1 | 1.22mi |
| 1224 County Road 449 West Columbia, TX | 2.0 | 1.0 | 850 | $1,250 | $1.47 | 43d | 1 | 1.32mi |
Listing history 28 events
-
2026-06-18days on market $120,000 Active 379 DOM
-
2026-06-17days on market $120,000 Active 378 DOM
-
2026-06-16days on market $120,000 Active 377 DOM
-
2026-06-15days on market $120,000 Active 376 DOM
-
2026-06-13days on market $120,000 Active 374 DOM
-
2026-06-13days on market $120,000 Active 373 DOM
-
2026-06-09days on market $120,000 Active 370 DOM
-
2026-06-08days on market $120,000 Active 369 DOM
-
2026-06-07days on market $120,000 Active 368 DOM
-
2026-06-04days on market $120,000 Active 365 DOM
-
2026-06-03days on market $120,000 Active 364 DOM
-
2026-06-02days on market $120,000 Active 363 DOM
-
2026-06-01days on market $120,000 Active 362 DOM
-
2026-05-31days on market $120,000 Active 361 DOM
-
2025-06-02$120,000 Active 499-char remark
Show marketing remark (499 chars)
Cute 3-bedroom 1-bath home in West Columbia. Home boasts open concept, kitchen and bath have been updated. The roof is 2 years old, new energy-efficient windows, water heater is 2 years old, HVAC is 1.5 years old and the sewer line has been replaced all the way to the meter. The home was recently fully fenced in the back and has lots of privacy. The home sits within walking distance to HEB and other shopping in town. Schedule your showing today while you still can!! This one will not last long.
-
2025-02-28historical
-
2025-01-10price $129,900
-
2024-10-25price $134,900
-
2024-08-29$139,999 Active
-
2024-01-03soldstatus
-
2023-12-29soldstatus Sold
-
2023-12-08status Pending
-
2023-11-28status Option Pending
-
2023-07-26$127,500 Active
-
2022-09-07soldstatus
-
2022-09-07soldstatus
-
2022-08-17soldstatus
-
2022-08-16soldstatus
ⓘ Source: listings_history table (triggers on properties + properties_extension) + one-shot
backfill from property_details.listing_events for pre-trigger history.
Tax reassessment forecast TX · Resets to sale price
- Current annual tax
- $2,320 · $193/mo
- Projected year-2 tax
- $2,320 · $193/mo
- Expected delta
- $0/yr ($0/mo · 0.0%)
ⓘ Screening estimate from a state-policy table — verify with the county assessor before closing.
Climate risk First Street
- Flood 6/10 Major FEMA zone X (unshaded) · 71% chance over 30 yrs
- Wildfire 4/10 Moderate
- Heat 9/10 Extreme 7 d/yr ≥109°F today · 25 d/yr by 30 yrs out
- Wind 9/10 Extreme 99% chance of damaging wind over 30 yrs
- Air quality 2/10 Low 2 unhealthy d/yr today · 2 by 30 yrs out
Nearby sold comps map
Loading sold comps map…
Walkable amenities ~0.75 mi
Loading nearby amenities…
Taxation est. · year 1
- Rental income
- $15,994
- − Mortgage interest
- −$6,722
- − Property taxes
- −$2,320
- − Insurance
- −$600
- − Repairs & maintenance
- −$1,280
- − Management
- −$1,280
- − Depreciation
- −$3,491
- Taxable income
- $302
- Est. tax owed @ 24.0%
- −$72
- After-tax cash flow
- $2,091/yr
For passive investors: Depreciation is non-cash, so a rental often shows a tax loss while cash-flowing — sheltering income. Rental losses are passive: they offset passive income freely, and up to $25,000/yr can offset ordinary (W-2) income if you actively participate and your MAGI is under $100k (phasing out to $0 by $150k); unused losses carry forward. On sale, claimed depreciation is recaptured at up to 25%, and gains may owe capital-gains tax (a 1031 exchange can defer both). Figures are a year-1 estimate at your 24.0% rate — not tax advice; consult a CPA.
Schools (NCES district)
- District
- Columbia-Brazoria ISD
- NCES district ID
- 4814670
- Math proficiency
- 35% ▼ -4.00%
- Reading proficiency
- 33% ▼ -1.00%
- Median HH income
- $57,256
- Composite
- 30.23/100
- National rank
- #6297
- State rank
- #513 of 826 in TX
Livability — West Columbia
- Score
- 70/100
- State rank
- #375
- US rank
- #7954
Category grades
Schools grade is shown separately in the Schools card above.
Census & demographics
- Census place
- West Columbia, TX
- Population (ZIP)
- 7,330
Population outlook (Brazoria County) Hauer SSP2
- Today (2025)
- 420,414 people
- By 2030
- 457,585 · +8.8%
- By 2040
- 532,232 · +26.6%
- By 2050
- 605,399 · +44.0%
- By 2075
- 779,358 · +85.4%
- By 2100
- 883,759 · +110.2%
Race, ethnicity, and origin ACS 2023
- Neighborhood character
- Majority White (61%)
- Race & ethnicity
- White 61% Hispanic / Latino 27% Two or more races 13% Black 10% Native American 1%
- Hispanic origin (detail)
- Mexican 23%
- Common ancestry
- Italian 5% Slovak 3% Lithuanian 2%
- Foreign-born
- 5% · Canada
- Languages at home
- 86% English-only · Spanish 12% German/W. Germanic 1%
Political lean MEDSL · Brazoria
- 2024 margin
- R (+19.7) · D 39.5% · R 59.2% · Other 1.3%
- 2008→2024 swing
- +9.9pp toward D · 2008: -29.6pp · 2024: -19.7pp
- All cycles
- 2024: R+19.7 2020: R+18.2 2016: R+24.6 2012: R+34.2 2008: R+29.6
Not yet ingested
- Civics
- —
Market trends
- HPI YoY
- ▲ 7.63%
- Current HPI
- 320.7967
- Rent YoY
- —
- Metro
- —
- State GDP YoY
- ▲ 3.95%
- F500 in state
- 110
Industry mix (Fortune 500 HQ in TX)
| Industry | F500 HQs | Revenue |
|---|---|---|
| Energy | 16 | $1,198B |
|
||
| Technology | 5 | $198B |
|
||
| Engineering / Construction | 4 | $72B |
|
||
| Energy Services | 3 | $60B |
|
||
| Utilities | 3 | $41B |
|
||
| Healthcare | 2 | $330B |
|
||
Price history
-5.9% since first listed14 events — show timeline
- 2025-06-02 Listed $120,000 HARMLS
- 2025-02-28 Listing Removed — HARMLS
- 2025-01-10 Price Changed $129,900 HARMLS
- 2024-10-25 Price Changed $134,900 HARMLS
- 2024-08-29 Listed $139,999 HARMLS
- 2024-01-03 Sold (Public Records) — Public Records
- 2023-12-29 Sold (MLS) — HARMLS
- 2023-12-08 Pending — HARMLS
- 2023-11-28 Pending — HARMLS
- 2023-07-26 Listed $127,500 HARMLS
- 2022-09-07 Sold (Public Records) — Public Records
- 2022-09-07 Sold (Public Records) — Public Records
- 2022-08-17 Sold (Public Records) — Public Records
- 2022-08-16 Sold (Public Records) — Public Records
Property tax history
+5.4%/yrLatest (2025): $2,320 · -29.4% YoY. Source: county tax records.
Cash-flow waterfall
monthlySold comps — $/sqft
last 12 mo · ≤1 miLoading sold comps…