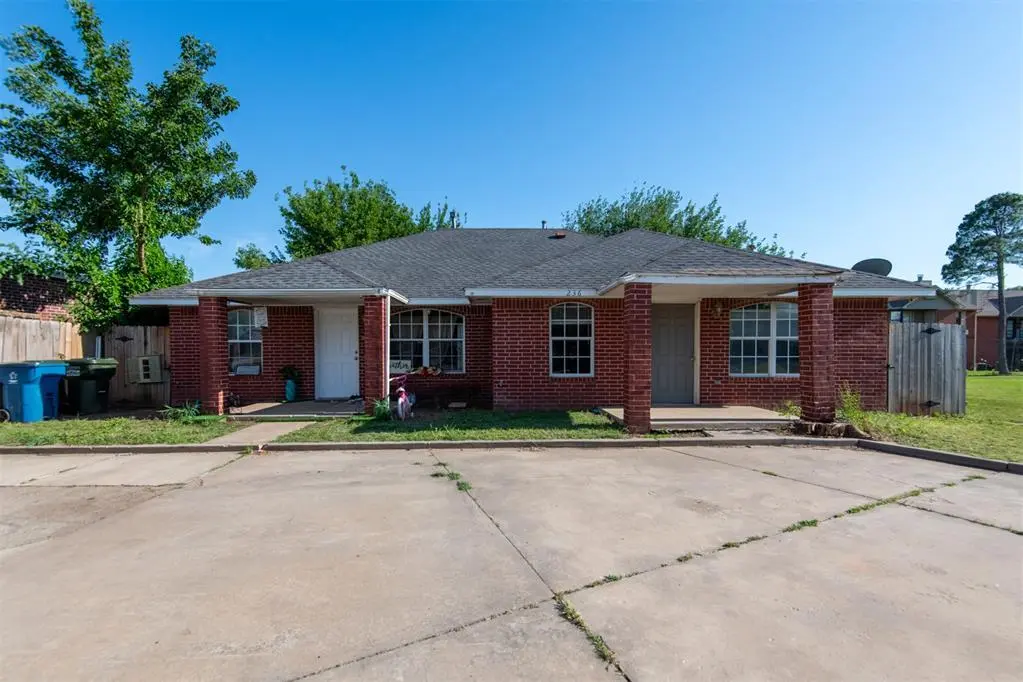
 Duplex
None · Edmond, OK
Flood risk No data
- FEMA flood zone
- —
- Chance of flooding over 30 yrs
- —
- Est. flood insurance / yr
- —
Fire risk No data
- Est. fire insurance / yr
- —
Heat risk No data
- Hot days now (above threshold)
- —
- Hot days in 30 yrs
- —
Wind risk No data
- Chance of severe wind over 30 yrs
- —
Air-quality risk No data
- Unhealthy air days now
- —
- Unhealthy air days in 30 yrs
- —
Risk factors via First Street. Map © Google.
Why this score? — see what drove the C grade
The composite is a weighted blend of 9 inputs, each scored 0–100. Each bar is that input's sub-score; the figure is the points it added to the 100-point composite (weight × sub-score).
- Cash flow +23.7/30.0
- DSCR +7.6/10.0
- ARV discount +7.5/15.0
- 1% rule +5.0/10.0
- Livability +3.9/5.0
- Schools +3.6/10.0
- Rent growth +3.3/5.0
- Condition / age +2.5/5.0
- Appreciation +0.0/10.0
$265,000
🖨 Deal sheet 📄 Offer letter ✓ Due diligence
Multi-family units
County records classify this as Multi-Family (2-4 Unit). Listing-text estimate: 2 units. confirmed
Listing remarks MLS
Back on market. failed1 contract. 1 year old, Dallas styled dulex. Leased for 1 year. Small privacy fenced yards. 3 bed, 2 bath & 2 bed, 2 bath. Eat in kitchens. 2 bed has stackable W/D & refrig - tenants pay utilities. Please do not disturb tenants. tenants pay utilities.
Key facts
- Versatile duplex
- Exceptional location
- Built 2003
Tags
Property features AI
Finance
- Other: Living area reported as 1,893 (assessor)
- Financial info: Listed price $265,000
- HOA & community: No mandatory association dues
Exterior
- Home design: Residential income duplex; Existing property
- Construction: Brick construction; Composition roof; Slab foundation; Built (existing)
- Exterior features: Corner lot
Interior
- Bedrooms: 5 total bedrooms
- Bathrooms: 4 full bathrooms
- Interior features: Multi-unit property (duplex); Currently occupied
Neighborhood map
What this means for you Summary
Snapshot
- This is a 2 × 2-bed/2.0-bath units multifamily listed at $265k.
Deal economics
- At list price, monthly cash flow is $506 ($6k/yr) — positive. Per door: $253/mo.
- The deal already cash-flows at list — no discount required.
- Meets the 1% rule at list price ($3k rent vs $265k).
- Recommended offer: $261k (1.5% below list) — sets the bar for market timing.
- Cap rate 8.6% vs local median 3.4% in Edmond — top-decile yield for the area; either an underpriced asset or a hidden risk that comps aren't pricing in. Stress-test before assuming the spread holds.
Location & tenants
- Location reads 78/100 on livability (#6 in OK, #2,383 nationally) — a middle-class / working-renter tenant base. Strengths: employment A+, housing A+, crime A-; Watch: health & safety C-, commute F.
- Edmond (suburban): math 38% / reading 40% proficiency, ranked #11 of 270 in OK (top 4%) — families likely to look elsewhere, expect single-tenant / working-renter base with shorter leases.
- Zoned schools: Sunset Es (math 18% / reading 18%, grade F, #534 of 845 statewide, top 64%, 670 students, 0% FRL); Memorial Hs (math 44% / reading 56%, grade D+, #4 of 447 statewide, top 1%, 2,605 students, 0% FRL) — zoned schools average 0% FRL vs 22% district-wide (22 pts lower); this property's tenant base skews higher-income than the district average.
- Market conditions: Rents rising (+3.1%/yr); 654 active listings in the ZIP; 40 comparable units currently listed for rent nearby; rentals at typical pace (median 15d on market — plan ~3-4 weeks tenant-placement turnaround); high-income renter base; 5,365 units permitted in Oklahoma County in 2024 (569 in 5+ unit buildings).
Forward outlook
- Local home prices are declining (-3.0%/yr); year-one equity from $2k of loan paydown is wiped out by about $8k of value loss. Plan a longer hold.
- Oklahoma County population projected at +41% by 2050 — long-run rental-demand tailwind backs the buy-and-hold thesis.
Negotiation context
- It's been on market 17 days — a 2% lower offer ($261k) is reasonable based on typical stale-listing flexibility.
- 2 sale attempts since 22y ago with the ask held roughly flat each time — persistent listings suggest the price (not the market) is what's stuck; bring a comps-based counter.
- Current owner paid $138k; list at $265k implies a 92% gain — meaningful room to come down on a strong offer.
Questions for the listing agent
- Can we see the unit-by-unit rent roll, current vacancy, and any below-market leases? What's the average tenancy length?
- What capital expenditures (roof, boiler, parking lot, exteriors) have been made in the last 5 years, and what's planned in the next 2?
- Is there a deadline driving the sale (1031 exchange, divorce, estate, relocation)? That informs how much negotiation room exists.
- Schools are A-rated — typically a magnet for longer-tenancy family renters. What's the average tenant stay here, and is there a school-zone premium baked into asking?
- What's the average days-on-market for RENTAL listings here right now (not sales)? A rising rental-DOM trend means longer vacancies and softer asking-rent achievability than the comps imply.
- What's the recent tenant-quality profile in this submarket — average credit score on applications, eviction rate, late-payment / NSF rate, and stable-employment percentage? A property-management company in the area should have these aggregated.
- How much new apartment / multifamily construction is in the pipeline within 1–3 miles? Heavy new supply (>2% of stock underway) typically softens rents 12–24 months out; light construction supports rent growth.
Investment metrics
- 1% rule
- 1.00% ✓
- Cap rate
- 8.59%
- Cash-on-cash
- 8.19%
- DSCR
- 1.36
- GRM
- 8.3
CMA / ARV
No comps found within radius.
Projected returns pro-forma
-3.0% appreciation · 3.14% rent growth · sell at horizon
- IRR
- -3.7%
- Equity multiple
- 0.86×
- Total profit
- $-10,432
- Equity at exit
- $39,512
- IRR
- 6.0%
- Equity multiple
- 1.45×
- Total profit
- $33,544
- Equity at exit
- $22,912
Cash invested: $74,200 (down + closing). Projections, not guarantees.
Landlord ↔ Tenant lean methodology
- Overall (STATE)
- 83 Strongly Landlord-Friendly
- State Oklahoma
- 83 Strongly Landlord-Friendly · R+20
- County
- — inherits STATE
- City
- — inherits STATE
ZIP-level market 73013
- Rents YoY
- 3.1%
- Active inventory
- 654
- Price-to-rent
- 16.6×
Monthly cashflow live
- Estimated rent
- $2,658 high interval (Pro) →
- Mortgage (P&I)
- −$1,390
- Tax from tax record
- −$94 /mo · $1,122/yr
- Insurance
- −$110
- HOA
- −$0
- Vacancy / Maint / Mgmt
- −$558
- Net cashflow
- $506
Break-even live
2-unit breakdown (identical units grouped — click to expand)
| Units | Beds | Baths | Est. rent |
|---|---|---|---|
| 2× units | 2 | 2 | $2,658 |
| #1 | 2 | 2 | $1,329 |
| #2 | 2 | 2 | $1,329 |
| Total (2 units) | $2,658 | ||
UW: 25.0% down · 7.5% · 30yr · 1.5% tax · 5.0% vac · 8.0% maint · 8.0% mgmt
Financing live
Cash to close
- Down payment
- $66,250
- Closing costs
- $7,950
- Reserves months
- —
- Total cash needed
- —
Loan-product check · same deal, 3 products live
Conventional
25% down · 7.5% · 30yr
- Down + closing
- —
- Monthly P&I
- —
- Monthly cashflow
- —
- DSCR
- —
- Eligible?
- —
Personal DTI + credit; lowest rate.
DSCR
20% down · 8.5% · 30yr
- Down + closing
- —
- Monthly P&I
- —
- Monthly cashflow
- —
- DSCR
- —
- Eligible?
- —
No personal income docs; deal must DSCR.
Hard money
10% down · 12.0% · 12mo
- Down + closing
- —
- Monthly P&I
- —
- Monthly cashflow
- —
- DSCR
- —
- Eligible?
- —
Short-term bridge; refi at stabilization.
Rent comps 40 comps
| Address | Beds | Baths | Sqft | Rent | $/sqft | DOM | Units | Dist |
|---|---|---|---|---|---|---|---|---|
| 1028 Mollie Rausch Ln Edmond, OK | 3.0 | 2.0 | 1495 | $1,650 | $1.10 | 23d | 1 | 0.13mi |
| 575 S Fretz Ave Edmond, OK | 3.0 | 2.5 | 1530 | $2,000 | $1.31 | 2d | 1 | 0.51mi |
| 808 Mars Cir Unit 1 Edmond, OK | 3.0 | 1.0 | 1401 | $1,375 | $0.98 | 19d | 1 | 0.52mi |
| 541 S Fretz Ave Edmond, OK | 2.0 | 2.5 | 1682 | $1,795 | $1.07 | 23d | 1 | 0.54mi |
| 616 Abadan Dr Edmond, OK | 3.0 | 3.5 | 2412 | $2,400 | $1.00 | 14d | 1 | 0.57mi |
| 609 Abadan Dr Edmond, OK | 3.0 | 3.5 | 2292 | $2,500 | $1.09 | 1d | 1 | 0.58mi |
| 463 S Fretz Ave Edmond, OK | 2.0 | 2.0 | 1550 | $1,695 | $1.09 | 14d | 1 | 0.61mi |
| 1820 Chelsea Dr Edmond, OK | 3.0 | 2.0 | 1749 | $1,695 | $0.97 | 1d | 1 | 0.63mi |
| 1809 Courtney Ln Edmond, OK | 3.0 | 2.0 | 1633 | $1,795 | $1.10 | 11d | 1 | 0.64mi |
| 612 W 2nd St Unit 100 Edmond, OK | 3.0 | 2.5 | 1414 | $1,895 | $1.34 | 21d | 1 | 0.81mi |
| 401 E 7th St Edmond, OK | 3.0 | 2.0 | 1255 | $1,450 | $1.16 | 23d | 1 | 0.86mi |
| 645 W 2nd St Edmond, OK | 3.0 | 2.0 | 1660 | $1,975 | $1.19 | 14d | 1 | 0.87mi |
| 1504 Apollo Rd Edmond, OK | 3.0 | 2.0 | 1435 | $1,475 | $1.03 | 11d | 1 | 0.89mi |
| 345 Travis Cir Edmond, OK | 3.0 | 2.0 | 1325 | $1,495 | $1.13 | 1d | 1 | 0.89mi |
| 1404 S Gemini Rd Edmond, OK | 3.0 | 2.0 | 1267 | $1,650 | $1.30 | 23d | 1 | 0.94mi |
| 1404 S Gemini Rd Edmond, OK | 3.0 | 2.0 | 1267 | $1,650 | $1.30 | 21d | 1 | 0.94mi |
| 16 N Walnut St Edmond, OK | 3.0 | 2.5 | 1650 | $2,395 | $1.45 | 14d | 1 | 0.97mi |
| 101 W Main St Edmond, OK | 3.0 | 1.0–2.0 | 991 | $1,959 | $1.98 | 1d | 111 | 0.99mi |
| 777 E 15th St Edmond, OK | 1.0–3.0 | 1.0–2.0 | 1135 | $1,468 | $1.29 | 1d | 23 | 0.99mi |
| 1024 Carpe Diem Ct Edmond, OK | 3.0 | 2.0 | 1700 | $1,895 | $1.11 | 2d | 1 | 1.12mi |
| 637 Redstone Ave Edmond, OK | 3.0 | 1.5 | 1228 | $1,450 | $1.18 | 14d | 1 | 1.15mi |
| 1129 Carpe Diem Ct Edmond, OK | 3.0 | 2.0 | 1250 | $1,595 | $1.28 | 3d | 1 | 1.18mi |
| 205 E 30th St Unit 1 Edmond, OK | 3.0 | 2.0 | 1400 | $1,450 | $1.04 | 23d | 1 | 1.21mi |
| 1909 Fountain Vw Edmond, OK | 3.0 | 2.0 | 1506 | $1,999 | $1.33 | 1d | 1 | 1.23mi |
| 425 Chalk Hill Ct Edmond, OK | 3.0 | 2.0 | 1243 | $1,550 | $1.25 | 14d | 1 | 1.24mi |
| 436 Chalk Hill Ct Edmond, OK | 3.0 | 2.0 | 1274 | $2,850 | $2.24 | 21d | 1 | 1.25mi |
| 436 Chalk Hill Ct Edmond, OK | 3.0 | 2.0 | 1274 | $2,850 | $2.24 | 23d | 1 | 1.25mi |
| 313 Dooley Creek Ln Edmond, OK | 3.0 | 2.0 | 1295 | $1,595 | $1.23 | 23d | 1 | 1.32mi |
| 317 Dooley Creek Ln Edmond, OK | 3.0 | 2.0 | 1295 | $1,595 | $1.23 | 14d | 1 | 1.34mi |
| 504 N Boulevard Edmond, OK | 3.0 | 2.0 | 1250 | $2,595 | $2.08 | 14d | 1 | 1.39mi |
| 2116 Camino del Plaza Ln Edmond, OK | 3.0 | 2.0 | 1396 | $1,645 | $1.18 | 23d | 1 | 1.40mi |
| 2108 Buena Vida Ln Edmond, OK | 3.0 | 2.5 | 1357 | $1,640 | $1.21 | 23d | 1 | 1.41mi |
| 2125 Buena Vida Ln Edmond, OK | 3.0 | 2.5 | 1458 | $1,699 | $1.17 | 1d | 1 | 1.41mi |
| 2149 Buena Vida Ln Edmond, OK | 3.0 | 2.5 | 1300 | $1,645 | $1.27 | 1d | 1 | 1.43mi |
| 2172 Camino del Plaza Ln Edmond, OK | 3.0 | 2.0 | 1274 | $1,600 | $1.26 | 23d | 1 | 1.44mi |
| 2172 Camino del Plaza Ln Edmond, OK | 3.0 | 2.0 | 1287 | $1,600 | $1.24 | 3d | 1 | 1.44mi |
| 2013 Vanishing Trl Edmond, OK | 3.0 | 2.0 | 1555 | $1,705 | $1.10 | 14d | 1 | 1.45mi |
| 3518 Wynn Cir Edmond, OK | 3.0 | 2.5 | 1595 | $1,475 | $0.92 | 23d | 1 | 1.45mi |
| 3611 Wynn Cir Unit 1 Edmond, OK | 3.0 | 2.5 | 1737 | $1,495 | $0.86 | 3d | 1 | 1.47mi |
| 3617 Wynn Cir Edmond, OK | 3.0 | 2.5 | 1706 | $1,350 | $0.79 | 23d | 1 | 1.47mi |
Listing history 11 events
-
2026-06-18days on market $265,000 Active 17 DOM
-
2026-06-17days on market $265,000 Active 16 DOM
-
2026-06-16days on market $265,000 Active 15 DOM
-
2026-06-15days on market $265,000 Active 14 DOM
-
2026-06-13days on market $265,000 Active 12 DOM
-
2026-06-09days on market $265,000 Active 8 DOM
-
2026-06-08days on market $265,000 Active 7 DOM
-
2026-06-07days on market $265,000 Active 6 DOM
-
2026-06-03days on market $265,000 Active 2 DOM
-
2026-06-01remarks 699-char remark
-
2026-06-01$265,000 Active 1 DOM
ⓘ Source: listings_history table (triggers on properties + properties_extension) + one-shot
backfill from property_details.listing_events for pre-trigger history.
Tax reassessment forecast OK · Resets to sale price
- Current annual tax
- $1,122 · $94/mo
- Projected year-2 tax
- $2,385 · $199/mo
- Expected delta
- +$1,263/yr (+$105/mo · 112.6%)
ⓘ Screening estimate from a state-policy table — verify with the county assessor before closing.
Nearby sold comps map
Loading sold comps map…
Walkable amenities ~0.75 mi
Loading nearby amenities…
Taxation est. · year 1
- Rental income
- $31,896
- − Mortgage interest
- −$14,844
- − Property taxes
- −$1,122
- − Insurance
- −$1,325
- − Repairs & maintenance
- −$2,552
- − Management
- −$2,552
- − Depreciation
- −$7,709
- Taxable income
- $1,792
- Est. tax owed @ 24.0%
- −$430
- After-tax cash flow
- $5,644/yr
For passive investors: Depreciation is non-cash, so a rental often shows a tax loss while cash-flowing — sheltering income. Rental losses are passive: they offset passive income freely, and up to $25,000/yr can offset ordinary (W-2) income if you actively participate and your MAGI is under $100k (phasing out to $0 by $150k); unused losses carry forward. On sale, claimed depreciation is recaptured at up to 25%, and gains may owe capital-gains tax (a 1031 exchange can defer both). Figures are a year-1 estimate at your 24.0% rate — not tax advice; consult a CPA.
Schools (NCES district)
- District
- Edmond
- NCES district ID
- 4010590
- Math proficiency
- 38% ▼ -12.00%
- Reading proficiency
- 40% ▼ -12.00%
- Median HH income
- $73,212
- Composite
- 35.88/100
- National rank
- #4814
- State rank
- #11 of 270 in OK
Livability — Edmond
- Score
- 78/100
- State rank
- #6
- US rank
- #2383
Category grades
Schools grade is shown separately in the Schools card above.
Census & demographics
- Census place
- Edmond, OK
- County
- Oklahoma County · 771,644 people
- City population
- 177,083
- Metro
- Oklahoma City, OK
- Population (ZIP)
- 58,023
- Household income
- $113,870
- Rent vs Own
- Severe rent burden
- 1313.0
Population outlook (Oklahoma County) Hauer SSP2
- Today (2025)
- 911,875 people
- By 2030
- 982,413 · +7.7%
- By 2040
- 1,130,468 · +24.0%
- By 2050
- 1,288,422 · +41.3%
- By 2075
- 1,711,482 · +87.7%
- By 2100
- 2,088,448 · +129.0%
Race, ethnicity, and origin ACS 2023
- Neighborhood character
- Predominantly White (67%)
- Race & ethnicity
- White 67% Two or more races 11% Black 9% Asian 7% Hispanic / Latino 5% Native American 2%
- Hispanic origin (detail)
- Mexican 2%
- Common ancestry
- Slovak 3% Italian 2% Lithuanian 2%
- Foreign-born
- 7% · Canada, Vietnam
- Languages at home
- 91% English-only · Other Indo-European 3% Spanish 2% Vietnamese 1%
Political lean MEDSL · Oklahoma
- 2024 margin
- Toss-up / Even · D 48.0% · R 49.7% · Other 2.3%
- 2008→2024 swing
- +15.1pp toward D · 2008: -16.8pp · 2024: -1.7pp
- All cycles
- 2024: R+1.7 2020: R+1.1 2016: R+10.5 2012: R+16.7 2008: R+16.8
Not yet ingested
- Civics
- —
Market trends
- HPI YoY
- ▼ -201.41%
- Current HPI
- 214.2251
- Rent YoY
- ▲ 3.14%
- Metro
- Oklahoma City, OK
- State GDP YoY
- ▲ 1.55%
- F500 in state
- 6
Industry mix (Fortune 500 HQ in OK)
| Industry | F500 HQs | Revenue |
|---|---|---|
| Energy | 3 | $48B |
|
||
Price history
+76.8% since first listed5 events — show timeline
- 2026-06-01 Listed $265,000 MLSOK
- 2005-12-08 Sold (Public Records) $138,000 Public Records
- 2005-11-29 Sold (MLS) $138,000 MLSOK
- 2004-12-09 Listing Removed — MLSOK
- 2004-12-08 Listed $149,900 MLSOK
Property tax history
-3.0%/yrLatest (2025): $1,122 · -35.5% YoY. Source: county tax records.
Cash-flow waterfall
monthlySold comps — $/sqft
last 12 mo · ≤1 miLoading sold comps…