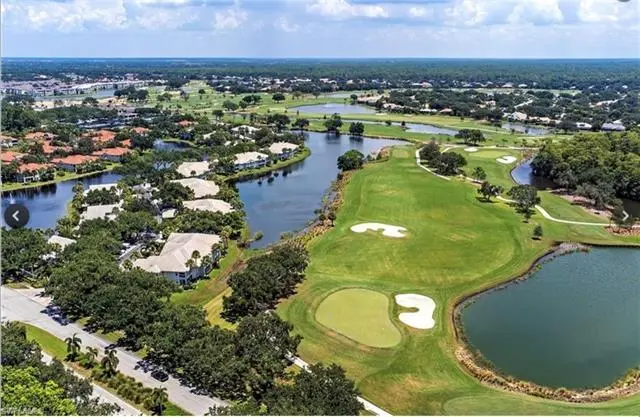
 🌊 Lakefront
6225 Bellerive Ave #1501 · Vineyards, FL
Flood risk 3/10 · Minor
- FEMA flood zone
- X (unshaded)
- Chance of flooding over 30 yrs
- 0.2%
- Est. flood insurance / yr
- $507 – $1,088
Fire risk 4/10 · Minor
- Est. fire insurance / yr
- $947 – $1,759
Heat risk 9/10 · Severe
- Hot days now (above 107°F)
- 6 days/yr
- Hot days in 30 yrs
- 24 days/yr
Wind risk 10/10 · Severe
- Chance of severe wind over 30 yrs
- 99.0%
Air-quality risk 2/10 · Minimal
- Unhealthy air days now
- 2 days/yr
- Unhealthy air days in 30 yrs
- 2 days/yr
Risk factors via First Street. Map © Google.
Why this score? — see what drove the D- grade
The composite is a weighted blend of 9 inputs, each scored 0–100. Each bar is that input's sub-score; the figure is the points it added to the 100-point composite (weight × sub-score).
- Cash flow +11.6/30.0
- ARV discount +7.5/15.0
- Schools +5.0/10.0
- 1% rule +4.6/10.0
- DSCR +3.4/10.0
- Livability +3.2/5.0
- Condition / age +2.5/5.0
- Rent growth +1.9/5.0
- Appreciation +0.0/10.0
$520,000
🖨 Deal sheet 📄 Offer letter ✓ Due diligence
Listing remarks
Welcome to this beautifully updated residence in Bellerive at The Vineyards offering peaceful lake and fountain views in one of Naples’ most sought-after gated communities. This light-filled 3-bedroom, 2-bath end unit features an ideal open layout with recent improvements including renovated kitchen and baths, updated flooring, and fresh interior paint throughout. Large windows and the desirable end-unit positioning allow natural light to pour into the living spaces, while the charming bay-window dining area creates an inviting setting for everyday living and entertaining alike. The screened lanai overlooks the water and fountain and includes storm protection for added convenience and
Key facts
- Fountain views
- Lake views
- Renovated baths
Tags
Property features AI
Finance
- Other: Part of a 4-unit building with 1 unit per floor and only 1 floor for this unit
- Financial info: Total annual recurring fees listed
- HOA & community: Mandatory HOA; Professional management; Master HOA fee charged quarterly; Condo fee charged quarterly; Maintenance covers cable, insurance, internet/Wi-Fi, irrigation water, lawn/land maintenance, legal/accounting, manager, master association fee, exterior pest control, recreation facilities, repairs, reserves, security, sewer, street lights, street maintenance, trash removal and water; Community amenities include clubhouse, community pool, community spa/hot tub, bike and jog path; Gated community with golf and tennis (golf is non-equity)
Exterior
- Parking: 1 assigned covered space; Detached 1-car carport; Deeded parking; Guest parking available
- Utilities: Central water; Central sewer; Cable available
- Home design: Residential property; Low-rise building (1–3 stories); Built in 1992; Located in The Vineyards development
- Construction: Concrete block construction
- Exterior features: Tile roof; Stucco exterior; Single-hung and sliding windows; Manual storm shutters; Lake view; Lake frontage/waterfront; Cul-de-sac lot; Irrigation with reclaimed water; Lot unit 1501; End-unit; Rear exposure facing northwest; Restrictions: Architectural, Deeded, No RV
Interior
- Kitchen: Dishwasher; Range; Microwave; Refrigerator
- Bedrooms: 3 bedrooms
- Bathrooms: 2 full bathrooms; Master bathroom with shower (no tub)
- Heating & cooling: Central electric heat; Central electric air conditioning; Ceiling fans
- Interior features: Cable prewire; High-speed internet available; Great room floor plan; Breakfast bar and breakfast room; Guest bath and guest room; Screened lanai/porch
- Laundry & utility: Washer and dryer in residence; Smoke detector
Neighborhood map
What this means for you Summary
Snapshot
- This is a 3-bed/2.0-bath condo listed at $520k.
Deal economics
- At list price, monthly cash flow is $-160 ($-2k/yr) — negative.
- To cash-flow at today's rent, offer at most $492k (5.4% below list).
- To meet the 1% rule (rent ≥ 1% of price), the offer needs to be $502k (3.5% below list).
- Recommended offer: $492k (5.4% below list) — sets the bar for cash-flow.
Location & tenants
- Location reads 64/100 on livability (#679 in FL) — a middle-class / working-renter tenant base. Strengths: crime A+, employment A+, housing A-; Watch: health & safety D, amenities F, commute F.
- Collier (suburban): math 60% / reading 56% proficiency, ranked #16 of 73 in FL (top 22%) — acceptable for families but not a draw, mixed tenant base, ~2y average lease.
- Market conditions: Rents soft (-2.5%/yr); 586 active listings in the ZIP; 40 comparable units currently listed for rent nearby; rentals at typical pace (median 23d on market — plan ~3-4 weeks tenant-placement turnaround); high-income renter base; 3,520 units permitted in Collier County in 2024 (959 in 5+ unit buildings).
- At $5,016/mo this rent would consume 53% of the median local household income ($113k/yr) (locally 741% of renters already pay >50% of income on rent) — very limited rent-growth headroom before tenants either downsize or default.
Forward outlook
- Local home prices are declining (-3.0%/yr); year-one equity from $4k of loan paydown is wiped out by about $16k of value loss. Plan a longer hold.
- Collier County population projected at +30% by 2050 — long-run rental-demand tailwind backs the buy-and-hold thesis.
Negotiation context
- It's been on market 37 days — a 3% lower offer ($504k) is reasonable based on typical stale-listing flexibility.
- 10 sale attempts since 13y ago with the ask held roughly flat each time — persistent listings suggest the price (not the market) is what's stuck; bring a comps-based counter.
- Current owner paid $170k; list at $520k implies a 206% gain — meaningful room to come down on a strong offer.
Risks & watch-outs
- Climate carrying-cost: severe wind risk, 99% chance of damaging wind over 30y; extreme-heat days projected 6→24/yr by 2055 (HVAC capex compounding) — expect insurance premiums to compound above CPI over the hold.
Questions for the listing agent
- What do current leases actually rent for vs. the listed asking? Can we see a recent rent roll and the last 12 months of T-12 income?
- It's been on market 37 days. Have you received any prior offers? Is the seller open to a 5% concession, seller financing, or rate buy-down credit?
- What does the HOA fee cover, when was the last increase, and are there any pending special assessments or reserve-fund shortfalls?
- Any open or pending special assessments — roof, HVAC, plumbing, elevator, façade? What's the per-unit balance and payoff schedule, and is the seller paying it off at close or rolling it to the buyer?
- Is there a deadline driving the sale (1031 exchange, divorce, estate, relocation)? That informs how much negotiation room exists.
- The area grade is low — what's the realistic commute time and amenity access for the typical tenant pool here? Any planned neighborhood developments (good or bad) we should know about?
- This sits on a lake — are riparian / water-frontage rights deeded with the parcel? Any dock permits, shoreline easements, or HOA water-use restrictions?
- What's the documented flood / surge / shoreline-erosion history here (FEMA AND non-FEMA — e.g., storm surge, creek backup, septic-field saturation)?
- Any water-quality or seasonal algae-bloom issues that affect tenant satisfaction or short-term-rental demand?
- What's the average days-on-market for RENTAL listings here right now (not sales)? A rising rental-DOM trend means longer vacancies and softer asking-rent achievability than the comps imply.
- What's the recent tenant-quality profile in this submarket — average credit score on applications, eviction rate, late-payment / NSF rate, and stable-employment percentage? A property-management company in the area should have these aggregated.
- How much new apartment / multifamily construction is in the pipeline within 1–3 miles? Heavy new supply (>2% of stock underway) typically softens rents 12–24 months out; light construction supports rent growth.
Investment metrics
- 1% rule
- 0.96% ✗
- Cap rate
- 5.92%
- Cash-on-cash
- -1.32%
- DSCR
- 0.94
- GRM
- 8.6
CMA / ARV
No comps found within radius.
Projected returns pro-forma
-3.0% appreciation · 0.0% rent growth · sell at horizon
- IRR
- -22.3%
- Equity multiple
- 0.25×
- Total profit
- $-108,774
- Equity at exit
- $77,534
- IRR
- -28.7%
- Equity multiple
- -0.12×
- Total profit
- $-163,051
- Equity at exit
- $44,960
Cash invested: $145,600 (down + closing). Projections, not guarantees.
Landlord ↔ Tenant lean methodology
- Overall (STATE)
- 87 Strongly Landlord-Friendly
- State Florida
- 87 Strongly Landlord-Friendly · R+3
- County
- — inherits STATE
- City
- — inherits STATE
ZIP-level market 34119
- Rents YoY
- -2.5%
- Active inventory
- 586
- Price-to-rent
- 8.6×
Monthly cashflow live
- Estimated rent
- $5,016 high interval (Pro) →
- Mortgage (P&I)
- −$2,727
- Tax from tax record
- −$278 /mo · $3,331/yr
- Insurance
- −$217
- HOA
- −$902
- Vacancy / Maint / Mgmt
- −$1,053
- Net cashflow
- $-160
Break-even live
UW: 25.0% down · 7.5% · 30yr · 1.5% tax · 5.0% vac · 8.0% maint · 8.0% mgmt
Financing live
Cash to close
- Down payment
- $130,000
- Closing costs
- $15,600
- Reserves months
- —
- Total cash needed
- —
Loan-product check · same deal, 3 products live
Conventional
25% down · 7.5% · 30yr
- Down + closing
- —
- Monthly P&I
- —
- Monthly cashflow
- —
- DSCR
- —
- Eligible?
- —
Personal DTI + credit; lowest rate.
DSCR
20% down · 8.5% · 30yr
- Down + closing
- —
- Monthly P&I
- —
- Monthly cashflow
- —
- DSCR
- —
- Eligible?
- —
No personal income docs; deal must DSCR.
Hard money
10% down · 12.0% · 12mo
- Down + closing
- —
- Monthly P&I
- —
- Monthly cashflow
- —
- DSCR
- —
- Eligible?
- —
Short-term bridge; refi at stabilization.
Rent comps 40 comps
| Address | Beds | Baths | Sqft | Rent | $/sqft | DOM | Units | Dist |
|---|---|---|---|---|---|---|---|---|
| 6260 Bellerive Ave #402 Naples, FL | 3.0 | 2.0 | 1708 | $7,000 | $4.10 | 21d | 1 | 0.09mi |
| 271 Perignon Pl Unit 16-1 Naples, FL | 2.0 | 2.0 | 1449 | $2,700 | $1.86 | 23d | 1 | 0.28mi |
| 57 Silver Oaks Cir #13103 Naples, FL | 2.0 | 2.0 | 1373 | $5,000 | $3.64 | 21d | 1 | 0.35mi |
| 515 Laguna Royale Blvd #102 Naples, FL | 3.0 | 2.0 | 1900 | $2,995 | $1.58 | 13d | 1 | 0.36mi |
| 224 Via Perignon Unit 5-4 Naples, FL | 2.0 | 2.5 | 2085 | $6,000 | $2.88 | 21d | 1 | 0.36mi |
| 56 Silver Oaks Cir Unit 102 Naples, FL | 2.0 | 2.0 | 1373 | $4,500 | $3.28 | 13d | 1 | 0.40mi |
| 89 Silver Oaks Cir #5103 Naples, FL | 2.0 | 2.0 | 1373 | $2,800 | $2.04 | 21d | 1 | 0.40mi |
| 575 El Camino Real Unit 6 Naples, FL | 2.0 | 2.0 | 2050 | $3,700 | $1.80 | 13d | 1 | 0.43mi |
| 200 Vintage Cir Unit D304 Naples, FL | 3.0 | 2.0 | 1492 | $2,800 | $1.88 | 13d | 1 | 0.45mi |
| 580 El Camino Real #3805 Naples, FL | 2.0 | 2.0 | 1772 | $13,500 | $7.62 | 23d | 1 | 0.46mi |
| 210 Vintage Cir Unit C401 Naples, FL | 3.0 | 2.0 | 1520 | $6,500 | $4.28 | 13d | 1 | 0.48mi |
| 230 Vintage Cir Unit A-404 Naples, FL | 2.0 | 2.0 | 1290 | $5,000 | $3.88 | 13d | 1 | 0.54mi |
| 152 Napa Ridge Way Naples, FL | 3.0 | 2.0 | 1775 | $7,000 | $3.94 | 23d | 1 | 0.54mi |
| 172 Vintage Cir #202 Naples, FL | 3.0 | 2.0 | 1774 | $5,195 | $2.93 | 13d | 1 | 0.54mi |
| 155 Vintage Cir #103 Naples, FL | 2.0 | 2.0 | 1500 | $5,000 | $3.33 | 13d | 1 | 0.57mi |
| 102 Tuscana Ct #901 Naples, FL | 2.0 | 2.0 | 1631 | $2,300 | $1.41 | 23d | 1 | 0.64mi |
| 106 Siena Way #1508 Naples, FL | 2.0 | 2.0 | 1414 | $4,500 | $3.18 | 23d | 1 | 0.65mi |
| 5950 Almaden Dr Naples, FL | 3.0 | 2.0 | 1762 | $6,500 | $3.69 | 23d | 1 | 0.66mi |
| 103 Tuscana Ct #1107 Naples, FL | 2.0 | 2.0 | 1412 | $5,000 | $3.54 | 23d | 1 | 0.66mi |
| 104 Siena Way #1407 Naples, FL | 2.0 | 2.0 | 1450 | $7,000 | $4.83 | 23d | 1 | 0.67mi |
| 734 Regency Reserve Cir #2701 Naples, FL | 2.0 | 2.0 | 2058 | $7,900 | $3.84 | 23d | 1 | 0.70mi |
| 730 Regency Reserve Cir #2802 Naples, FL | 2.0 | 2.0 | 2050 | $8,000 | $3.90 | 23d | 1 | 0.71mi |
| 116 Fountain Cir Naples, FL | 3.0 | 2.0 | 1561 | $4,500 | $2.88 | 23d | 1 | 0.73mi |
| 6025 Chardonnay Ln Unit 1Unit 102 Naples, FL | 2.0 | 2.0 | 1414 | $2,195 | $1.55 | 23d | 1 | 0.74mi |
| 713 Regency Reserve Cir #5902 Naples, FL | 3.0 | 2.0 | 2050 | $7,200 | $3.51 | 23d | 1 | 0.80mi |
| 713 Regency Reserve Cir #5901 Naples, FL | 2.0 | 2.0 | 2050 | $3,295 | $1.61 | 13d | 1 | 0.80mi |
| 801 Regency Reserve Cir #4301 Naples, FL | 3.0 | 2.0 | 2050 | $6,800 | $3.32 | 23d | 1 | 0.82mi |
| 817 Regency Reserve Cir #3901 Naples, FL | 2.0 | 2.0 | 2058 | $7,000 | $3.40 | 13d | 1 | 0.86mi |
| 817 Regency Reserve Cir #3901 Naples, FL | 2.0 | 2.0 | 2058 | $7,000 | $3.40 | 23d | 1 | 0.86mi |
| 4681 Rio Poco Ct Naples, FL | 3.0 | 2.0 | 1547 | $3,000 | $1.94 | 23d | 1 | 0.98mi |
| 6941 Hunters Rd Naples, FL | 4.0 | 2.0 | 1866 | $7,500 | $4.02 | 23d | 1 | 1.05mi |
| 1190 Reserve Way #304 Naples, FL | 2.0 | 2.0 | 1059 | $2,900 | $2.74 | 23d | 1 | 1.19mi |
| 1180 Reserve Way Naples, FL | 1.0–2.0 | 1.0–2.0 | 912 | $1,990 | $2.18 | 13d | 3 | 1.20mi |
| 1180 Reserve Way Naples, FL | 1.0–2.0 | 1.0–2.0 | 954 | $2,000 | $2.10 | 23d | 2 | 1.20mi |
| 1220 Reserve Way #305 Naples, FL | 2.0 | 2.0 | 1059 | $1,950 | $1.84 | 23d | 1 | 1.23mi |
| 1154 Augusta Falls Way Unit 1520030P Naples, FL | 3.0 | 2.0 | 1819 | $4,426 | $2.43 | 13d | 1 | 1.23mi |
| 3687 El Segundo Ct Naples, FL | 2.0 | 2.0 | 1680 | $5,000 | $2.98 | 23d | 1 | 1.25mi |
| 1205 Reserve Way #302 Naples, FL | 3.0 | 2.0 | 1239 | $2,300 | $1.86 | 13d | 1 | 1.30mi |
| 3664 El Segundo Ct Naples, FL | 2.0 | 2.0 | 1680 | $5,500 | $3.27 | 23d | 1 | 1.31mi |
| 1303 Verde Dr Unit 1603 Naples, FL | 3.0 | 2.0 | 1877 | $2,500 | $1.33 | 13d | 1 | 1.41mi |
HOA detail condo
- Monthly dues
- $902 · $10,824/yr
- Likely covers
- watersecurity
- Assessments
- None detected in remarks — confirm with the listing agent.
Listing history 41 events
-
2026-06-18days on market $520,000 Active 37 DOM
-
2026-06-17days on market $520,000 Active 36 DOM
-
2026-06-16days on market $520,000 Active 35 DOM
-
2026-06-15days on market $520,000 Active 34 DOM
-
2026-06-14days on market $520,000 Active 32 DOM
-
2026-06-10days on market $520,000 Active 29 DOM
-
2026-06-09days on market $520,000 Active 28 DOM
-
2026-06-08days on market $520,000 Active 27 DOM
-
2026-06-07days on market $520,000 Active 26 DOM
-
2026-06-03days on market $520,000 Active 22 DOM
-
2026-06-02days on market $520,000 Active 21 DOM
-
2026-06-01days on market $520,000 Active 20 DOM
-
2026-05-31days on market $520,000 Active 19 DOM
-
2026-05-30days on market $520,000 Active 18 DOM
-
2026-05-12$520,000 Active
-
2026-01-08$3,500
-
2026-01-08historical $3,500
-
2025-07-18$3,500
-
2025-07-14historical $3,300
-
2025-07-14historical
-
2025-05-13$3,300
-
2025-04-17historical $3,300
-
2024-10-17price $3,300
-
2024-07-31$600,000 Active
-
2024-07-25$3,500
-
2024-04-17historical
-
2024-02-29$575,000 Active
-
2017-09-28historical
-
2017-08-18price $227,500
-
2017-06-16price $229,500
-
2017-06-16status Active
-
2017-06-16historical
-
2017-05-29price $239,500
-
2017-03-28price $245,000
-
2017-01-25price $259,900
-
2016-05-13price $270,000
-
2015-12-31$285,000 Active
-
2013-03-20soldstatus $170,000
-
2013-03-20soldstatus $170,000
-
2013-01-15$179,000
-
1993-04-27soldstatus $156,500
ⓘ Source: listings_history table (triggers on properties + properties_extension) + one-shot
backfill from property_details.listing_events for pre-trigger history.
Tax reassessment forecast FL · Resets to sale price
- Current annual tax
- $3,331 · $278/mo
- Projected year-2 tax
- $4,316 · $360/mo
- Expected delta
- +$985/yr (+$82/mo · 29.6%)
ⓘ Screening estimate from a state-policy table — verify with the county assessor before closing.
Climate risk First Street
- Flood 3/10 Moderate FEMA zone X (unshaded) · 20% chance over 30 yrs
- Wildfire 4/10 Moderate
- Heat 9/10 Extreme 6 d/yr ≥107°F today · 24 d/yr by 30 yrs out
- Wind 10/10 Extreme 99% chance of damaging wind over 30 yrs
- Air quality 2/10 Low 2 unhealthy d/yr today · 2 by 30 yrs out
Nearby sold comps map
Loading sold comps map…
Walkable amenities ~0.75 mi
Loading nearby amenities…
Taxation est. · year 1
- Rental income
- $60,195
- − Mortgage interest
- −$29,128
- − Property taxes
- −$3,331
- − Insurance
- −$2,600
- − Repairs & maintenance
- −$4,816
- − Management
- −$4,816
- − HOA
- −$10,824
- − Depreciation
- −$15,127
- Taxable loss
- −$10,446
- Est. tax savings @ 24.0%
- +$2,507
- After-tax cash flow
- $583/yr
For passive investors: Depreciation is non-cash, so a rental often shows a tax loss while cash-flowing — sheltering income. Rental losses are passive: they offset passive income freely, and up to $25,000/yr can offset ordinary (W-2) income if you actively participate and your MAGI is under $100k (phasing out to $0 by $150k); unused losses carry forward. On sale, claimed depreciation is recaptured at up to 25%, and gains may owe capital-gains tax (a 1031 exchange can defer both). Figures are a year-1 estimate at your 24.0% rate — not tax advice; consult a CPA.
Schools (NCES district)
- District
- Collier
- NCES district ID
- 1200330
- Math proficiency
- 60% ▼ -4.00%
- Reading proficiency
- 56% ▼ -2.00%
- Median HH income
- $58,275
- Composite
- 50.23/100
- National rank
- #1892
- State rank
- #16 of 73 in FL
Livability — Vineyards
- Score
- 64/100
- State rank
- #679
- US rank
- #14101
Category grades
Schools grade is shown separately in the Schools card above.
Census & demographics
- Census place
- Vineyards, FL
- County
- Collier County · 396,295 people
- Metro
- Naples-Marco Island, FL
- Population (ZIP)
- 36,807
- Household income
- $113,391
- Rent vs Own
- Severe rent burden
- 741.0
Population outlook (Collier County) Hauer SSP2
- Today (2025)
- 420,858 people
- By 2030
- 450,054 · +6.9%
- By 2040
- 502,232 · +19.3%
- By 2050
- 544,932 · +29.5%
- By 2075
- 627,203 · +49.0%
- By 2100
- 659,015 · +56.6%
Race, ethnicity, and origin ACS 2023
- Neighborhood character
- Predominantly White (74%)
- Race & ethnicity
- White 74% Hispanic / Latino 20% Two or more races 14% Black 1%
- Hispanic origin (detail)
- Mexican 6% Puerto Rican 2% Cuban 4% Dominican 2%
- Common ancestry
- Romanian 4% Lithuanian 2% Italian 2%
- Foreign-born
- 17% · Canada, Jamaica, Dominican Republic
- Languages at home
- 78% English-only · Spanish 15% Other Indo-European 3% Russian/Polish/Slavic 1%
Political lean MEDSL · Collier
- 2024 margin
- Solid R (+33.1) · D 33.1% · R 66.2%
- 2008→2024 swing
- -10.6pp toward R · 2008: -22.5pp · 2024: -33.1pp
- All cycles
- 2024: R+33.1 2020: R+24.7 2016: R+26.0 2012: R+30.1 2008: R+22.5
Not yet ingested
- Civics
- —
Market trends
- HPI YoY
- ▼ -243.12%
- Current HPI
- 269.3208
- Rent YoY
- ▼ -2.51%
- Metro
- Naples-Marco Island, FL
- State GDP YoY
- ▲ 3.28%
- F500 in state
- 36
Industry mix (Fortune 500 HQ in FL)
| Industry | F500 HQs | Revenue |
|---|---|---|
| Industrial Technology | 2 | $29B |
|
||
| Insurance | 2 | $17B |
|
||
| Retail | 1 | $60B |
|
||
| Technology Distribution | 1 | $58B |
|
||
| Homebuilding | 1 | $35B |
|
||
| Technology Manufacturing | 1 | $35B |
|
||
Price history
+232.3% since first listed27 events — show timeline
- 2026-05-12 Listed $520,000 NAPLESMLS
- 2026-01-08 Listed for Rent $3,500 FGCMLS
- 2026-01-08 Rental Removed $3,500 NAPLESMLS
- 2025-07-18 Listed for Rent $3,500 NAPLESMLS
- 2025-07-14 Rental Removed $3,300 NAPLESMLS
- 2025-07-14 Listing Removed — NAPLESMLS
- 2025-05-13 Listed for Rent $3,300 NAPLESMLS
- 2025-04-17 Rental Removed $3,300 NAPLESMLS
- 2024-10-17 Price Changed $3,300 NAPLESMLS
- 2024-07-31 Listed $600,000 NAPLESMLS
- 2024-07-25 Listed for Rent $3,500 NAPLESMLS
- 2024-04-17 Listing Removed — NAPLESMLS
- 2024-02-29 Listed $575,000 NAPLESMLS
- 2017-09-28 Listing Removed — NAPLESMLS
- 2017-08-18 Price Changed $227,500 NAPLESMLS
- 2017-06-16 Price Changed $229,500 NAPLESMLS
- 2017-06-16 Relisted — NAPLESMLS
- 2017-06-16 Listing Removed — NAPLESMLS
- 2017-05-29 Price Changed $239,500 NAPLESMLS
- 2017-03-28 Price Changed $245,000 NAPLESMLS
- 2017-01-25 Price Changed $259,900 NAPLESMLS
- 2016-05-13 Price Changed $270,000 NAPLESMLS
- 2015-12-31 Listed $285,000 NAPLESMLS
- 2013-03-20 Sold (Public Records) $170,000 Public Records
- 2013-03-20 Sold (MLS) $170,000 NAPLESMLS
- 2013-01-15 Listed $179,000 NAPLESMLS
- 1993-04-27 Sold (Public Records) $156,500 Public Records
Property tax history
+6.1%/yrLatest (2025): $3,331 · +3.9% YoY. Source: county tax records.
Cash-flow waterfall
monthlySold comps — $/sqft
last 12 mo · ≤1 miLoading sold comps…