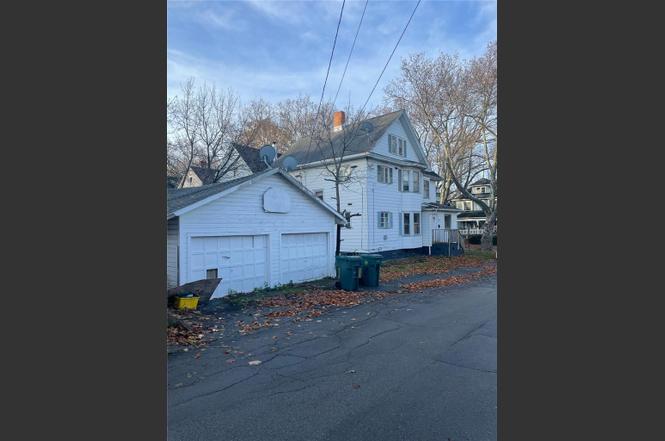
26-28 Lakeview Ter · Rochester, NY
Flood risk 1/10 · Minimal
- FEMA flood zone
- X (unshaded)
- Chance of flooding over 30 yrs
- 0.0%
- Est. flood insurance / yr
- $473 – $860
Fire risk 1/10 · Minimal
- Est. fire insurance / yr
- $691 – $1,283
Heat risk 2/10 · Minimal
- Hot days now (above 95°F)
- 7 days/yr
- Hot days in 30 yrs
- 14 days/yr
Wind risk 1/10 · Minimal
- Chance of severe wind over 30 yrs
- —
Air-quality risk 2/10 · Minimal
- Unhealthy air days now
- 1 days/yr
- Unhealthy air days in 30 yrs
- 2 days/yr
Risk factors via First Street. Map © Google.
Why this score? — see what drove the B grade
The composite is a weighted blend of 9 inputs, each scored 0–100. Each bar is that input's sub-score; the figure is the points it added to the 100-point composite (weight × sub-score).
- Cash flow +29.1/30.0
- ARV discount +15.0/15.0
- DSCR +10.0/10.0
- 1% rule +7.7/10.0
- Livability +3.8/5.0
- Rent growth +2.5/5.0
- Condition / age +2.5/5.0
- Appreciation +2.2/10.0
- Schools +1.9/10.0
$135,000
🖨 Deal sheet (PDF) 📄 Offer letter ✓ Due diligence
Listing remarks
Discover this cash-flowing 4/3 duplex in Rochester's Historic Maplewood District—a versatile duplex offering multiple pathways to real estate success. Whether you're seeking an income-producing investment with a possible double-digit cap rate or dreaming of mortgage-free living in an owner-occupied arrangement, this property delivers exceptional value in today's market. Each spacious unit functions independently, allowing for streamlined management and predictable expenses. The Maplewood District location can't be beat. Stroll along tree-lined sidewalks in this established neighborhood where community pride is evident. Enjoy the convenience: Minutes from Route 104 for easy commuting,
Key facts
- Cash flowing duplex
- Strong rental demand
- 2 garage spots
Tags
Neighborhood map
What this means for you Summary
Snapshot
- This is a 6-bed/2.0-bath townhouse listed at $135k.
Deal economics
- At list price, monthly cash flow is $465 ($6k/yr) — positive.
- The deal already cash-flows at list — no discount required.
- Meets the 1% rule at list price ($2k rent vs $135k).
- Recommended offer: $127k (6.0% below list) — sets the bar for market timing.
Location & tenants
- Location reads 76/100 on livability (#222 in NY, #3,482 nationally) — a middle-class / working-renter tenant base. Strengths: commute A+, cost of living A+, housing A+; Watch: schools D+, crime F, employment F.
- Rochester City School District (urban): math 21% / reading 26% proficiency, ranked #589 of 590 in NY (top 100%) — low school quality limits family demand, transient renter base, plan for 1-2y turnover; 82% free/reduced lunch — lower-income household profile, screen leases tightly.
- Market conditions: 71 active listings in the ZIP; 1,169 units permitted in Monroe County in 2024 (591 in 5+ unit buildings).
Forward outlook
- Local home prices are declining (-3.0%/yr); year-one equity from $933 of loan paydown is wiped out by about $4k of value loss. Plan a longer hold.
- Monroe County population projected to shrink 6% by 2050 — rents likely to lag national; underwrite the cash flow, not the appreciation.
- At projected returns (-3.0% appreciation + 3.0% rent growth), your $38k cash investment doubles in ~8 years — after that, you're playing with house money.
Negotiation context
- It's been on market 66 days — a 6% lower offer ($127k) is reasonable based on typical stale-listing flexibility.
- Current owner paid $72k; list at $135k implies a 88% gain — meaningful room to come down on a strong offer.
Risks & watch-outs
- Watch-outs: built in 1900 — expect roof / HVAC / electrical / plumbing capex.
Questions for the listing agent
- It's been on market 66 days. Have you received any prior offers? Is the seller open to a 6% concession, seller financing, or rate buy-down credit?
- Built in 1900 — when were the roof, HVAC, electrical panel, plumbing, and water heater last replaced?
- Why hasn't it sold? Are there any deal-killer items the seller is aware of (foundation, flood, title, zoning, code violations)?
- Is there a deadline driving the sale (1031 exchange, divorce, estate, relocation)? That informs how much negotiation room exists.
- Schools are D-rated, which usually means shorter tenancies and higher turnover. Who's the typical renter profile here, and what's been the actual vacancy rate?
- Crime grade is F in this area — have there been break-ins, vandalism, or insurance claims at this property in the last 3 years? What carrier currently insures it and at what premium?
- What's the average days-on-market for RENTAL listings here right now (not sales)? A rising rental-DOM trend means longer vacancies and softer asking-rent achievability than the comps imply.
- What's the recent tenant-quality profile in this submarket — average credit score on applications, eviction rate, late-payment / NSF rate, and stable-employment percentage? A property-management company in the area should have these aggregated.
- How much new for-sale + rental construction is in the pipeline within 1–3 miles? Heavy new supply typically softens prices + rents 12–24 months out; constrained supply supports both.
Investment metrics
- 1% rule
- 1.27% ✓
- Cap rate
- 10.42%
- Cash-on-cash
- 14.75%
- DSCR
- 1.66
- GRM
- 6.5
CMA / ARV
- ARV (on-the-fly)
- $170,024
- Comps found
- 5
Show comp detail 5 sales within ~0.75 mi
| Address | Dist | Beds/Ba | Sqft | Sold | Price | $/sf | Match |
|---|---|---|---|---|---|---|---|
| 62 Raines Park | 0.06mi | 6/2.0 | 3,236 (+1%) | 8mo | $183,000 | $57 | 89 |
| 1538 St Paul St | 0.57mi | 6/2.0 | 2,912 (-9%) | 10mo | $169,900 | $58 | 50 |
| 442 Driving Park Ave | 0.41mi | 6/2.5 | 2,832 (-12%) | 13mo | $113,000 | $40 | 49 |
| 115-117 Electric Ave #115 | 0.42mi | 6/2.0 | 2,776 (-14%) | 13mo | $147,550 | $53 | 48 |
| 84 Avenue B | 0.71mi | 7/3.0 (+1) | 2,766 (-14%) | 2mo | $102,000 | $37 | 33 |
Match score weights: distance 35% · size 25% · config 20% · recency 20%. Top-matched comps best support the ARV.
Projected returns pro-forma
-3.0% appreciation · 3.0% rent growth · sell at horizon
- IRR
- 5.3%
- Equity multiple
- 1.20×
- Total profit
- $7,725
- Equity at exit
- $20,129
- IRR
- 14.7%
- Equity multiple
- 2.19×
- Total profit
- $44,850
- Equity at exit
- $11,672
Cash invested: $37,800 (down + closing). Projections, not guarantees.
Landlord ↔ Tenant lean methodology
- Overall (STATE)
- 15 Strongly Tenant-Friendly
- State New York
- 15 Strongly Tenant-Friendly · D+10
- County
- — inherits STATE
- City
- — inherits STATE
ZIP-level market 14613
- Home prices YoY
- -2.0%
- Active inventory
- 71
- Price-to-rent
- 6.5×
Monthly cashflow live
- Estimated rent
- $1,721 medium interval (Pro) →
- Mortgage (P&I)
- −$708
- Tax from tax record
- −$131 /mo · $1,566/yr
- Insurance
- −$56
- HOA
- −$0
- Vacancy / Maint / Mgmt
- −$361
- Net cashflow
- $465
Break-even live
Sensitivity live
| Price | -10% $541 | -5% $503 | +0% $465 | +5% $427 | +10% $388 |
|---|---|---|---|---|---|
| Rent | -10% $329 | -5% $397 | +0% $465 | +5% $533 | +10% $601 |
| Rate | -1.0pp $533 | -0.5pp $499 | base $465 | +0.5pp $430 | +1.0pp $394 |
UW: 25.0% down · 7.5% · 30yr · 1.5% tax · 5.0% vac · 8.0% maint · 8.0% mgmt
Financing live
Cash to close
- Down payment
- $33,750
- Closing costs
- $4,050
- Reserves months
- —
- Total cash needed
- —
Loan-product check · same deal, 3 products live
Conventional
25% down · 7.5% · 30yr
- Down + closing
- —
- Monthly P&I
- —
- Monthly cashflow
- —
- DSCR
- —
- Eligible?
- —
Personal DTI + credit; lowest rate.
DSCR
20% down · 8.5% · 30yr
- Down + closing
- —
- Monthly P&I
- —
- Monthly cashflow
- —
- DSCR
- —
- Eligible?
- —
No personal income docs; deal must DSCR.
Hard money
10% down · 12.0% · 12mo
- Down + closing
- —
- Monthly P&I
- —
- Monthly cashflow
- —
- DSCR
- —
- Eligible?
- —
Short-term bridge; refi at stabilization.
Listing history 5 events
-
2026-01-19status Pending
-
2025-11-14$135,000 Active
-
2016-08-05soldstatus $72,000
-
2008-08-04soldstatus $78,000
-
2001-07-23soldstatus $47,000
ⓘ Source: listings_history table (triggers on properties + properties_extension) + one-shot
backfill from property_details.listing_events for pre-trigger history.
Tax reassessment forecast NY · Partial reset (capped growth)
- Current annual tax
- $1,566 · $131/mo
- Projected year-2 tax
- $1,924 · $160/mo
- Expected delta
- +$358/yr (+$30/mo · 22.8%)
ⓘ Screening estimate from a state-policy table — verify with the county assessor before closing.
Climate risk First Street
- Flood 1/10 Low FEMA zone X (unshaded) · 0% chance over 30 yrs
- Wildfire 1/10 Low
- Heat 2/10 Low 7 d/yr ≥95°F today · 14 d/yr by 30 yrs out
- Wind 1/10 Low
- Air quality 2/10 Low 1 unhealthy d/yr today · 2 by 30 yrs out
Nearby sold comps map
Loading sold comps map…
Walkable amenities ~0.75 mi
Loading nearby amenities…
Taxation est. · year 1
- Rental income
- $20,650
- − Mortgage interest
- −$7,562
- − Property taxes
- −$1,566
- − Insurance
- −$675
- − Repairs & maintenance
- −$1,652
- − Management
- −$1,652
- − Depreciation
- −$3,927
- Taxable income
- $3,615
- Est. tax owed @ 24.0%
- −$868
- After-tax cash flow
- $4,709/yr
For passive investors: Depreciation is non-cash, so a rental often shows a tax loss while cash-flowing — sheltering income. Rental losses are passive: they offset passive income freely, and up to $25,000/yr can offset ordinary (W-2) income if you actively participate and your MAGI is under $100k (phasing out to $0 by $150k); unused losses carry forward. On sale, claimed depreciation is recaptured at up to 25%, and gains may owe capital-gains tax (a 1031 exchange can defer both). Figures are a year-1 estimate at your 24.0% rate — not tax advice; consult a CPA.
Schools (NCES district)
- District
- Rochester City School District
- NCES district ID
- 3624750
- Math proficiency
- 21% ▬ 0.00%
- Reading proficiency
- 26% ▲ 4.00%
- Median HH income
- $30,923
- Composite
- 18.98/100
- National rank
- #8850
- State rank
- #589 of 590 in NY
Livability — Rochester
- Score
- 76/100
- State rank
- #222
- US rank
- #3482
Category grades
Schools grade is shown separately in the Schools card above.
Census & demographics
- Census place
- Rochester, NY
- City population
- 432,803
- Population (ZIP)
- 14,740
Population outlook (Monroe County) Hauer SSP2
- Today (2025)
- 759,460 people
- By 2030
- 757,154 · -0.3%
- By 2040
- 740,644 · -2.5%
- By 2050
- 714,443 · -5.9%
- By 2075
- 645,883 · -15.0%
- By 2100
- 547,084 · -28.0%
Race, ethnicity, and origin ACS 2023
- Neighborhood character
- Highly diverse neighborhood (Simpson 0.70)
- Race & ethnicity
- Black 45% White 22% Hispanic / Latino 20% Two or more races 10% Asian 8% Pacific Islander 1%
- Hispanic origin (detail)
- Puerto Rican 16% Dominican 3%
- Common ancestry
- British 2% Serbian 1% Romanian 1%
- Foreign-born
- 13% · Canada, India, Philippines
- Languages at home
- 79% English-only · Spanish 12% Other Asian/Pacific 5% Other Indo-European 3%
Political lean MEDSL · Monroe
- 2024 margin
- D (+19.1) · D 59.5% · R 40.5%
- 2008→2024 swing
- +1.4pp toward D · 2008: 17.7pp · 2024: 19.1pp
- All cycles
- 2024: D+19.1 2020: D+21.0 2016: D+14.1 2012: D+17.4 2008: D+17.7
Not yet ingested
- Civics
- —
Market trends
- HPI YoY
- ▼ -5.56%
- Current HPI
- 274.2485
- Rent YoY
- —
- Metro
- —
- State GDP YoY
- ▲ 2.60%
- F500 in state
- 92
Industry mix (Fortune 500 HQ in NY)
| Industry | F500 HQs | Revenue |
|---|---|---|
| Financial Services | 10 | $950B |
|
||
| Consumer Goods | 9 | $162B |
|
||
| Insurance | 4 | $225B |
|
||
| Telecommunications | 2 | $144B |
|
||
| Pharmaceuticals | 2 | $112B |
|
||
| Media / Entertainment | 2 | $69B |
|
||
Price history
+187.2% since first listed5 events — show timeline
- 2026-01-19 Pending — UNYREIS
- 2025-11-14 Listed $135,000 UNYREIS
- 2016-08-05 Sold (Public Records) $72,000 Public Records
- 2008-08-04 Sold (Public Records) $78,000 Public Records
- 2001-07-23 Sold (Public Records) $47,000 Public Records
Property tax history
+3.6%/yrLatest (2025): $1,566 · +0.0% YoY. Source: county tax records.
Cash-flow waterfall
monthlySold comps — $/sqft
last 12 mo · ≤1 miLoading sold comps…