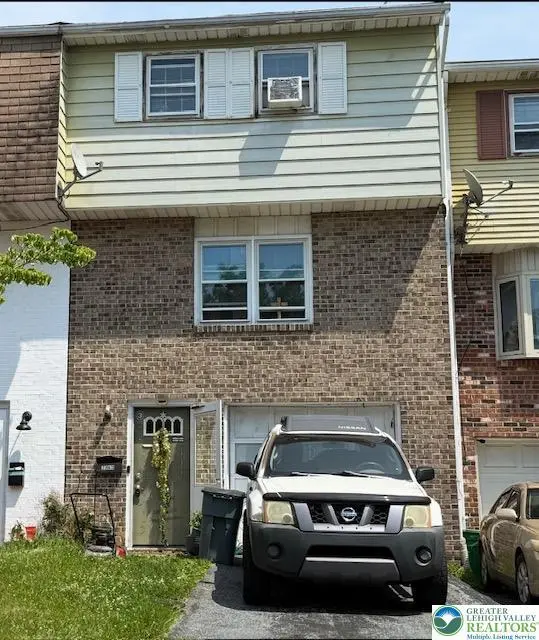
2860 Huron St · Allentown, PA
Flood risk 1/10 · Minimal
- FEMA flood zone
- X (unshaded)
- Chance of flooding over 30 yrs
- 0.0%
- Est. flood insurance / yr
- $473 – $860
Fire risk 5/10 · Moderate
- Est. fire insurance / yr
- $511 – $949
Heat risk 5/10 · Moderate
- Hot days now (above 99°F)
- 7 days/yr
- Hot days in 30 yrs
- 15 days/yr
Wind risk 4/10 · Minor
- Chance of severe wind over 30 yrs
- 16.0%
Air-quality risk 3/10 · Minor
- Unhealthy air days now
- 3 days/yr
- Unhealthy air days in 30 yrs
- 4 days/yr
Risk factors via First Street. Map © Google.
Why this score? — see what drove the D+ grade
The composite is a weighted blend of 9 inputs, each scored 0–100. Each bar is that input's sub-score; the figure is the points it added to the 100-point composite (weight × sub-score).
- Cash flow +14.8/30.0
- ARV discount +11.6/15.0
- DSCR +4.5/10.0
- Rent growth +4.3/5.0
- 1% rule +4.1/10.0
- Livability +4.0/5.0
- Condition / age +2.5/5.0
- Schools +1.2/10.0
- Appreciation +0.0/10.0
$220,000
🖨 Deal sheet (PDF) 📄 Offer letter ✓ Due diligence
Listing remarks
This townhouse is located on a private cul-de-sac street. The home offers a kitchen with a dining room off to the side that leads to the rear deck, and a relaxing living room on the second floor. The three bedrooms and full bath are on the third level. A dropdown stair for easy storage access. The main level has a one car garage with an area to finish off for a family room/Rec room/Den or Office. This home also features off and on street parking. Close to all of your everyday conveniences. Home does need some TLC however, is priced accordingly.
Key facts
- Garage
- Built 1973
- Listed 11 days
Property features AI
Exterior
- Parking: One-car garage; Built-in parking with driveway, off-street and on-street parking available
- Utilities: 100 amp electrical service with circuit breakers; Public water; Public sewer
- Home design: Three-story home; Aluminum siding and brick exterior
- Construction: Built on a slab foundation; Asphalt/fiberglass roof
- Exterior features: Public water and public sewer; Lot approximately 0.05 acres (about 2,191 sq ft); Zoned R-Mh (Medium High Density)
Interior
- Kitchen: Kitchen located on the second level; Electric oven and electric range
- Bedrooms: Three bedrooms on the third level; Bedroom sizes approximately 14 x 12, 12 x 8, and 9 x 8 (third level)
- Bathrooms: One full bathroom (third level); One half bathroom (first level)
- Heating & cooling: Electric heating with heat pump
- Interior features: Dining area and formal separate dining room; Rec room / family room / office / den (first level)
- Laundry & utility: Electric water heater
Neighborhood map
What this means for you Summary
Snapshot
- This is a 3-bed/1.5-bath townhouse listed at $220k.
Deal economics
- At list price, monthly cash flow is $62 ($740/yr) — positive.
- The deal already cash-flows at list — no discount required.
- To meet the 1% rule (rent ≥ 1% of price), the offer needs to be $200k (8.9% below list).
- Recommended offer: $200k (8.9% below list) — sets the bar for 1% rule.
- Cap rate 6.6% vs local median 5.3% in Allentown — meaningfully above typical; check what's discounted (condition, days-on-market, listing class) to confirm the premium yield is real.
Location & tenants
- Location reads 81/100 on livability (#171 in PA, #1,440 nationally) — a professional / high-income tenant draw. Strengths: commute A+, cost of living A+, housing A+; Watch: employment D.
- Allentown City SD (urban): math 10% / reading 20% proficiency, ranked #513 of 539 in PA (top 95%) — low school quality limits family demand, transient renter base, plan for 1-2y turnover; 73% free/reduced lunch — lower-income household profile, screen leases tightly.
- Zoned schools: Lehigh Parkway El Sch (math 22%, 278 students, 100% FRL); South Mountain Ms (math 3% / reading 15%, grade F, #502 of 512 statewide, top 98%, 1,007 students, 100% FRL); William Allen Hs (math 29% / reading 10%, grade F, #392 of 437 statewide, top 90%, 2,852 students, 87% FRL) — zoned schools average 96% FRL vs 73% district-wide (23 pts higher); higher-poverty schools than district average — tighter screening recommended.
- Market conditions: Rents rising fast (+7.0%/yr); 165 active listings in the ZIP; 11 comparable units currently listed for rent nearby; rentals at typical pace (median 16d on market — plan ~3-4 weeks tenant-placement turnaround); 765 units permitted in Lehigh County in 2024 (286 in 5+ unit buildings).
- This rent runs 33% of the median local income ($73k/yr) — at the standard rent-burdened threshold; future hikes will face affordability resistance.
Forward outlook
- Local home prices are declining (-3.0%/yr); year-one equity from $2k of loan paydown is wiped out by about $7k of value loss. Plan a longer hold.
- Lehigh County population projected at +21% by 2050 — long-run rental-demand tailwind backs the buy-and-hold thesis.
Negotiation context
- Only 12 days on market — expect competitive offers; lowballing is unlikely to land.
- Current owner paid $48k; list at $220k implies a 359% gain — meaningful room to come down on a strong offer.
Risks & watch-outs
- Climate carrying-cost: moderate wildfire risk; extreme-heat days projected 7→15/yr by 2055 (HVAC capex compounding) — expect insurance premiums to compound above CPI over the hold.
Questions for the listing agent
- Built in 1973 — when were the roof, HVAC, electrical panel, plumbing, and water heater last replaced?
- Is there a deadline driving the sale (1031 exchange, divorce, estate, relocation)? That informs how much negotiation room exists.
- Schools are D-rated, which usually means shorter tenancies and higher turnover. Who's the typical renter profile here, and what's been the actual vacancy rate?
- The area grade is low — what's the realistic commute time and amenity access for the typical tenant pool here? Any planned neighborhood developments (good or bad) we should know about?
- What's the average days-on-market for RENTAL listings here right now (not sales)? A rising rental-DOM trend means longer vacancies and softer asking-rent achievability than the comps imply.
- What's the recent tenant-quality profile in this submarket — average credit score on applications, eviction rate, late-payment / NSF rate, and stable-employment percentage? A property-management company in the area should have these aggregated.
- How much new for-sale + rental construction is in the pipeline within 1–3 miles? Heavy new supply typically softens prices + rents 12–24 months out; constrained supply supports both.
Investment metrics
- 1% rule
- 0.91% ✗
- Cap rate
- 6.63%
- Cash-on-cash
- 1.20%
- DSCR
- 1.05
- GRM
- 9.1
CMA / ARV
- ARV (on-the-fly)
- $242,208
- Comps found
- 8
Show comp detail 8 sales within ~0.75 mi
| Address | Dist | Beds/Ba | Sqft | Sold | Price | $/sf | Match |
|---|---|---|---|---|---|---|---|
| 2835 Ithaca St | 0.05mi | 3/1.5 | 1,044 (0%) | 13mo | $228,000 | $218 | 87 |
| 2833 Huron St | 0.05mi | 3/1.5 | 1,080 (+3%) | 13mo | $250,470 | $232 | 81 |
| 2612 Mountain Ln | 0.11mi | 3/1.5 | 1,080 (+3%) | 10mo | $261,453 | $242 | 80 |
| 2823 Ithaca St | 0.06mi | 3/1.5 | 1,044 (0%) | 21mo | $220,000 | $211 | 80 |
| 2621 Arch St SW | 0.15mi | 3/1.5 | 1,080 (+3%) | 11mo | $248,000 | $230 | 78 |
| 2960 Klein St | 0.23mi | 3/2.0 | 1,080 (+3%) | 10mo | $260,000 | $241 | 74 |
| 2636 Arch St SW | 0.19mi | 3/1.5 | 1,080 (+3%) | 20mo | $255,000 | $236 | 69 |
| 2622 Mountain Ln | 0.12mi | 3/1.5 | 1,152 (+10%) | 23mo | $256,000 | $222 | 58 |
Match score weights: distance 35% · size 25% · config 20% · recency 20%. Top-matched comps best support the ARV.
Projected returns pro-forma
-3.0% appreciation · 7.05% rent growth · sell at horizon
- IRR
- -9.9%
- Equity multiple
- 0.62×
- Total profit
- $-23,189
- Equity at exit
- $32,803
- IRR
- 4.3%
- Equity multiple
- 1.37×
- Total profit
- $22,917
- Equity at exit
- $19,022
Cash invested: $61,600 (down + closing). Projections, not guarantees.
Landlord ↔ Tenant lean methodology
- Overall (STATE)
- 62 Landlord-Friendly
- State Pennsylvania
- 62 Landlord-Friendly · EVEN
- County
- — inherits STATE
- City
- — inherits STATE
ZIP-level market 18103
- Rents YoY
- 7.0%
- Active inventory
- 165
- Price-to-rent
- 9.1×
Monthly cashflow live
- Estimated rent
- $2,004 high interval (Pro) →
- Mortgage (P&I)
- −$1,154
- Tax from tax record
- −$276 /mo · $3,318/yr
- Insurance
- −$92
- HOA
- −$0
- Vacancy / Maint / Mgmt
- −$421
- Net cashflow
- $62
Break-even live
Sensitivity live
| Price | -10% $186 | -5% $124 | +0% $62 | +5% $-1 | +10% $-63 |
|---|---|---|---|---|---|
| Rent | -10% $-97 | -5% $-17 | +0% $62 | +5% $141 | +10% $220 |
| Rate | -1.0pp $172 | -0.5pp $118 | base $62 | +0.5pp $5 | +1.0pp $-53 |
UW: 25.0% down · 7.5% · 30yr · 1.5% tax · 5.0% vac · 8.0% maint · 8.0% mgmt
Financing live
Cash to close
- Down payment
- $55,000
- Closing costs
- $6,600
- Reserves months
- —
- Total cash needed
- —
Loan-product check · same deal, 3 products live
Conventional
25% down · 7.5% · 30yr
- Down + closing
- —
- Monthly P&I
- —
- Monthly cashflow
- —
- DSCR
- —
- Eligible?
- —
Personal DTI + credit; lowest rate.
DSCR
20% down · 8.5% · 30yr
- Down + closing
- —
- Monthly P&I
- —
- Monthly cashflow
- —
- DSCR
- —
- Eligible?
- —
No personal income docs; deal must DSCR.
Hard money
10% down · 12.0% · 12mo
- Down + closing
- —
- Monthly P&I
- —
- Monthly cashflow
- —
- DSCR
- —
- Eligible?
- —
Short-term bridge; refi at stabilization.
Rent comps 11 comps
| Address | Beds | Baths | Sqft | Rent | $/sqft | DOM | Units | Dist |
|---|---|---|---|---|---|---|---|---|
| 2908 Fernor St Allentown, PA | 1.0–3.0 | 1.0–1.5 | 1005 | $2,069 | $2.06 | 4d | 19 | 0.08mi |
| 2414 Prospect Ave Allentown, PA | 1.0–2.0 | 1.0–1.5 | 750 | $1,855 | $2.47 | 4d | 20 | 0.16mi |
| 2647 30th St SW Allentown, PA | 1.0–2.0 | 1.0 | 795 | $1,935 | $2.43 | 4d | 9 | 0.18mi |
| 2415 Allenbrook Dr Allentown, PA | 1.0–2.0 | 1.0–2.0 | 717 | $1,500 | $2.09 | 4d | 7 | 0.48mi |
| 3129 Moravian Ave Allentown, PA | 3.0 | 1.0 | 1175 | $2,200 | $1.87 | 16d | 1 | 0.73mi |
| 1143 Lova Ln Allentown, PA | 3.0 | 2.5 | 1404 | $2,500 | $1.78 | 16d | 1 | 1.08mi |
| 1013 Devonshire Rd Allentown, PA | 2.0 | 1.5 | 1200 | $1,650 | $1.38 | 45d | 1 | 1.11mi |
| 2112 S Lumber St Unit 1 Allentown, PA | 2.0 | 1.0 | 870 | $1,395 | $1.60 | 25d | 1 | 1.28mi |
| 1975 Mack Blvd Unit 2031-1 Allentown, PA | 2.0 | 2.0 | 980 | $1,550 | $1.58 | 16d | 1 | 1.29mi |
| 749 Benton St Allentown, PA | 3.0 | 1.0 | 1152 | $1,950 | $1.69 | 16d | 1 | 1.38mi |
| 2074 Baker Dr Allentown, PA | 3.0 | 1.0 | 1462 | $2,195 | $1.50 | 45d | 1 | 1.39mi |
Listing history 8 events
-
2026-06-22days on market $220,000 Active 12 DOM
-
2026-06-18days on market $220,000 Active 9 DOM
-
2026-06-17days on market $220,000 Active 8 DOM
-
2026-06-16days on market $220,000 Active 7 DOM
-
2026-06-15days on market $220,000 Active 6 DOM
-
2026-06-14days on market $220,000 Active 4 DOM
-
2026-06-10remarks 550-char remark
-
2026-06-10$220,000 Active 1 DOM
ⓘ Source: listings_history table (triggers on properties + properties_extension) + one-shot
backfill from property_details.listing_events for pre-trigger history.
Tax reassessment forecast PA · Partial reset (capped growth)
- Current annual tax
- $3,318 · $276/mo
- Projected year-2 tax
- $3,397 · $283/mo
- Expected delta
- +$79/yr (+$7/mo · 2.4%)
ⓘ Screening estimate from a state-policy table — verify with the county assessor before closing.
Climate risk First Street
- Flood 1/10 Low FEMA zone X (unshaded) · 0% chance over 30 yrs
- Wildfire 5/10 Major
- Heat 5/10 Major 7 d/yr ≥99°F today · 15 d/yr by 30 yrs out
- Wind 4/10 Moderate 16% chance of damaging wind over 30 yrs
- Air quality 3/10 Moderate 3 unhealthy d/yr today · 4 by 30 yrs out
Nearby sold comps map
Loading sold comps map…
Walkable amenities ~0.75 mi
Loading nearby amenities…
Taxation est. · year 1
- Rental income
- $24,054
- − Mortgage interest
- −$12,323
- − Property taxes
- −$3,318
- − Insurance
- −$1,100
- − Repairs & maintenance
- −$1,924
- − Management
- −$1,924
- − Depreciation
- −$6,400
- Taxable loss
- −$2,936
- Est. tax savings @ 24.0%
- +$705
- After-tax cash flow
- $1,445/yr
For passive investors: Depreciation is non-cash, so a rental often shows a tax loss while cash-flowing — sheltering income. Rental losses are passive: they offset passive income freely, and up to $25,000/yr can offset ordinary (W-2) income if you actively participate and your MAGI is under $100k (phasing out to $0 by $150k); unused losses carry forward. On sale, claimed depreciation is recaptured at up to 25%, and gains may owe capital-gains tax (a 1031 exchange can defer both). Figures are a year-1 estimate at your 24.0% rate — not tax advice; consult a CPA.
Schools (NCES district)
- District
- Allentown City SD
- NCES district ID
- 4202280
- Math proficiency
- 10% ▼ -10.00%
- Reading proficiency
- 20% ▼ -15.00%
- Median HH income
- $36,337
- Composite
- 12.43/100
- National rank
- #9630
- State rank
- #513 of 539 in PA
Livability — Allentown
- Score
- 81/100
- State rank
- #171
- US rank
- #1440
Category grades
Schools grade is shown separately in the Schools card above.
Census & demographics
- Census place
- Allentown, PA
- County
- Lehigh County · 333,019 people
- City population
- 172,996
- Metro
- Allentown-Bethlehem-Easton, PA-NJ
- Population (ZIP)
- 48,746
- Household income
- $72,895
- Rent vs Own
- Severe rent burden
- 1792.0
Population outlook (Lehigh County) Hauer SSP2
- Today (2025)
- 392,957 people
- By 2030
- 408,319 · +3.9%
- By 2040
- 440,007 · +12.0%
- By 2050
- 475,940 · +21.1%
- By 2075
- 590,448 · +50.3%
- By 2100
- 690,314 · +75.7%
Race, ethnicity, and origin ACS 2023
- Neighborhood character
- Diverse neighborhood (Simpson 0.63)
- Race & ethnicity
- White 46% Hispanic / Latino 38% Two or more races 15% Black 9% Asian 3% Native American 1%
- Hispanic origin (detail)
- Mexican 4% Puerto Rican 15% Dominican 13%
- Common ancestry
- Romanian 3% Polish 3% Iranian 1%
- Foreign-born
- 19% · Canada, Jamaica, Vietnam
- Languages at home
- 64% English-only · Spanish 30% Other Indo-European 1% Other Asian/Pacific 1%
Political lean MEDSL · Lehigh
- 2024 margin
- Toss-up / Even · D 50.7% · R 48.0% · Other 1.2%
- 2008→2024 swing
- -12.9pp toward R · 2008: 15.6pp · 2024: 2.7pp
- All cycles
- 2024: D+2.7 2020: D+7.6 2016: D+4.4 2012: D+7.5 2008: D+15.6
Not yet ingested
- Civics
- —
Market trends
- HPI YoY
- ▼ -358.28%
- Current HPI
- 298.1512
- Rent YoY
- ▲ 7.05%
- Metro
- Allentown-Bethlehem-Easton, PA-NJ
- State GDP YoY
- ▲ 1.68%
- F500 in state
- 34
Industry mix (Fortune 500 HQ in PA)
| Industry | F500 HQs | Revenue |
|---|---|---|
| Healthcare | 2 | $309B |
|
||
| Insurance | 2 | $27B |
|
||
| Telecommunications / Media | 1 | $124B |
|
||
| Industrial Distribution | 1 | $22B |
|
||
| Financial Services | 1 | $20B |
|
||
| Chemicals / Materials | 1 | $18B |
|
||
Price history
+441.9% since first listed3 events — show timeline
- 2026-06-10 Listed $220,000 GLVRMLS
- 1986-09-16 Sold (Public Records) $47,900 Public Records
- 1982-12-30 Sold (Public Records) $40,600 Public Records
Property tax history
-1.9%/yrLatest (2026): $3,318 · +0.7% YoY. Source: county tax records.
Cash-flow waterfall
monthlySold comps — $/sqft
last 12 mo · ≤1 miLoading sold comps…