 Multi-family
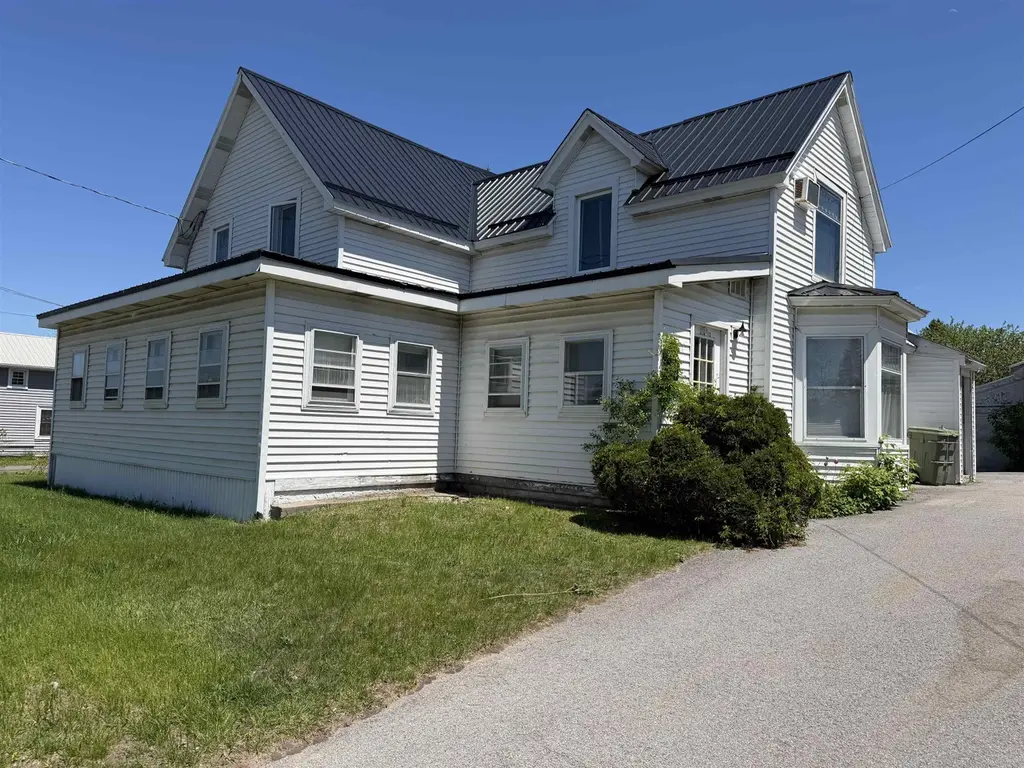
21 South Main St · Norfolk, NY
Flood risk 1/10 · Minimal
- FEMA flood zone
- X
- Chance of flooding over 30 yrs
- 0.0%
- Est. flood insurance / yr
- $473 – $860
Fire risk 3/10 · Minor
- Est. fire insurance / yr
- $691 – $1,283
Heat risk 2/10 · Minimal
- Hot days now (above 93°F)
- 7 days/yr
- Hot days in 30 yrs
- 15 days/yr
Wind risk 1/10 · Minimal
- Chance of severe wind over 30 yrs
- —
Air-quality risk 1/10 · Minimal
- Unhealthy air days now
- 0 days/yr
- Unhealthy air days in 30 yrs
- 0 days/yr
Risk factors via First Street. Map © Google.
Why this score? — see what drove the C+ grade
The composite is a weighted blend of 9 inputs, each scored 0–100. Each bar is that input's sub-score; the figure is the points it added to the 100-point composite (weight × sub-score).
- Cash flow +24.2/30.0
- DSCR +7.8/10.0
- ARV discount +7.5/15.0
- 1% rule +6.3/10.0
- Appreciation +4.9/10.0
- Livability +3.2/5.0
- Schools +2.8/10.0
- Rent growth +2.5/5.0
- Condition / age +2.2/5.0
$179,000
🖨 Deal sheet 📄 Offer letter ✓ Due diligence
Multi-family units
County records classify this as Multi-Family (2-4 Unit). Listing-text estimate: 1 unit. estimate disagrees with records
Listing remarks
INVESTMENT OPPORTUNITY IN NORFOLK! This two-unit home offers plenty of space, flexibility and potential for owner occupancy or rental income. Conveniently located close to Norwood, Potsdam, Madrid, Raymondville and Canton, with restaurants, shopping and other amenities nearby. The owner had a new roof put on in 2021 and a new boiler and domestic water heater installed in 2025. The electricity was updated to 200 amp and there is a hookup for a generator for your convenience ~ the generator is negotiable. The larger apartment features a spacious living room, an eat-in kitchen with a laundry area, a sitting room off the living room, a main floor bathroom, other additional downstairs rooms that
Key facts
- New boiler
- Enclosed back porch
- Generator hookup
Tags
Property features AI
Exterior
- Parking: Detached paved garage with 1 garage space
- Utilities: Public water; Public sewer; Cable available; Natural gas available
- Home design: Duplex residential income property; 2 stories
- Construction: Vinyl siding
- Exterior features: Metal roof
Interior
- Bathrooms: 2 full bathrooms
- Heating & cooling: Natural gas hot water heating
- Interior features: Gas water heater; Partial basement
- Laundry & utility: Laundry on main level
Neighborhood map
What this means for you Summary
Snapshot
- This is a 4-bed/2.0-bath multifamily listed at $179k. Condition is rated fair.
Deal economics
- At list price, monthly cash flow is $358 ($4k/yr) — positive.
- The deal already cash-flows at list — no discount required.
- Meets the 1% rule at list price ($2k rent vs $179k).
- Recommended offer: $176k (1.5% below list) — sets the bar for market timing.
Location & tenants
- Location reads 64/100 on livability (#737 in NY) — a middle-class / working-renter tenant base. Strengths: cost of living A+, housing A+; Watch: health & safety C-, schools D, crime F.
- Norwood-Norfolk Central School District (rural): math 30% / reading 36% proficiency, ranked #568 of 590 in NY (top 96%) — families likely to look elsewhere, expect single-tenant / working-renter base with shorter leases.
- Market conditions: 30 active listings in the ZIP; 215 units permitted in St. Lawrence County in 2024 (0 in 5+ unit buildings).
Forward outlook
- In year one you build about $919 of equity ($1k loan paydown + $-319 appreciation (-0.2% local appreciation)).
- St. Lawrence County population projected at -14% by 2050 — secular population decline; favor cash flow + early exit over multi-decade hold.
- At projected returns (-0.2% appreciation + 3.0% rent growth), your $50k cash investment doubles in ~8 years — after that, you're playing with house money.
Negotiation context
- It's been on market 21 days — a 2% lower offer ($176k) is reasonable based on typical stale-listing flexibility.
Risks & watch-outs
- Watch-outs: built in 1938 — expect roof / HVAC / electrical / plumbing capex.
Questions for the listing agent
- Have any recent inspections been done? Can we get a copy of the seller's disclosures and any deferred-maintenance estimates?
- Built in 1938 — when were the roof, HVAC, electrical panel, plumbing, and water heater last replaced?
- Is there a deadline driving the sale (1031 exchange, divorce, estate, relocation)? That informs how much negotiation room exists.
- Schools are D-rated, which usually means shorter tenancies and higher turnover. Who's the typical renter profile here, and what's been the actual vacancy rate?
- Crime grade is F in this area — have there been break-ins, vandalism, or insurance claims at this property in the last 3 years? What carrier currently insures it and at what premium?
- What's the average days-on-market for RENTAL listings here right now (not sales)? A rising rental-DOM trend means longer vacancies and softer asking-rent achievability than the comps imply.
- What's the recent tenant-quality profile in this submarket — average credit score on applications, eviction rate, late-payment / NSF rate, and stable-employment percentage? A property-management company in the area should have these aggregated.
- How much new apartment / multifamily construction is in the pipeline within 1–3 miles? Heavy new supply (>2% of stock underway) typically softens rents 12–24 months out; light construction supports rent growth.
Investment metrics
- 1% rule
- 1.13% ✓
- Cap rate
- 8.69%
- Cash-on-cash
- 8.57%
- DSCR
- 1.38
- GRM
- 7.4
CMA / ARV
No comps found within radius.
Projected returns pro-forma
-0.18% appreciation · 3.0% rent growth · sell at horizon
- IRR
- 6.8%
- Equity multiple
- 1.32×
- Total profit
- $16,100
- Equity at exit
- $50,387
- IRR
- 12.1%
- Equity multiple
- 2.30×
- Total profit
- $65,312
- Equity at exit
- $59,313
Cash invested: $50,120 (down + closing). Projections, not guarantees.
Landlord ↔ Tenant lean methodology
- Overall (STATE)
- 15 Strongly Tenant-Friendly
- State New York
- 15 Strongly Tenant-Friendly · D+10
- County
- — inherits STATE
- City
- — inherits STATE
ZIP-level market 13667
- Home prices YoY
- -0.1%
- Active inventory
- 30
- Price-to-rent
- 14.8×
Monthly cashflow live
- Estimated rent
- $2,019 medium interval (Pro) →
- Mortgage (P&I)
- −$939
- Tax est. 1.5%
- −$224 /mo · $2,685/yr
- Insurance
- −$75
- HOA
- −$0
- Vacancy / Maint / Mgmt
- −$424
- Net cashflow
- $358
Break-even live
2-unit breakdown (identical units grouped — click to expand)
| Units | Beds | Baths | Est. rent |
|---|---|---|---|
| 2× units | 2 | 1 | $2,020 |
| #1 | 2 | 1 | $1,010 |
| #2 | 2 | 1 | $1,010 |
| Total (2 units) | $2,019 | ||
UW: 25.0% down · 7.5% · 30yr · 1.5% tax · 5.0% vac · 8.0% maint · 8.0% mgmt
Financing live
Cash to close
- Down payment
- $44,750
- Closing costs
- $5,370
- Reserves months
- —
- Total cash needed
- —
Loan-product check · same deal, 3 products live
Conventional
25% down · 7.5% · 30yr
- Down + closing
- —
- Monthly P&I
- —
- Monthly cashflow
- —
- DSCR
- —
- Eligible?
- —
Personal DTI + credit; lowest rate.
DSCR
20% down · 8.5% · 30yr
- Down + closing
- —
- Monthly P&I
- —
- Monthly cashflow
- —
- DSCR
- —
- Eligible?
- —
No personal income docs; deal must DSCR.
Hard money
10% down · 12.0% · 12mo
- Down + closing
- —
- Monthly P&I
- —
- Monthly cashflow
- —
- DSCR
- —
- Eligible?
- —
Short-term bridge; refi at stabilization.
Listing history 15 events
-
2026-06-18days on market $179,000 Active 21 DOM
-
2026-06-17days on market $179,000 Active 20 DOM
-
2026-06-16days on market $179,000 Active 19 DOM
-
2026-06-15days on market $179,000 Active 18 DOM
-
2026-06-13days on market $179,000 Active 16 DOM
-
2026-06-12days on market $179,000 Active 15 DOM
-
2026-06-09days on market $179,000 Active 12 DOM
-
2026-06-08days on market $179,000 Active 11 DOM
-
2026-06-07days on market $179,000 Active 10 DOM
-
2026-06-07days on market $179,000 Active 9 DOM
-
2026-06-04days on market $179,000 Active 6 DOM
-
2026-06-02days on market $179,000 Active 5 DOM
-
2026-06-01days on market $179,000 Active 4 DOM
-
2026-05-31days on market $179,000 Active 3 DOM
-
2026-05-28$179,000 Active
ⓘ Source: listings_history table (triggers on properties + properties_extension) + one-shot
backfill from property_details.listing_events for pre-trigger history.
Climate risk First Street
- Flood 1/10 Low FEMA zone X · 0% chance over 30 yrs
- Wildfire 3/10 Moderate
- Heat 2/10 Low 7 d/yr ≥93°F today · 15 d/yr by 30 yrs out
- Wind 1/10 Low
- Air quality 1/10 Low 0 unhealthy d/yr today · 0 by 30 yrs out
Nearby sold comps map
Loading sold comps map…
Walkable amenities ~0.75 mi
Loading nearby amenities…
Taxation est. · year 1
- Rental income
- $24,228
- − Mortgage interest
- −$10,027
- − Property taxes
- −$2,685
- − Insurance
- −$895
- − Repairs & maintenance
- −$1,938
- − Management
- −$1,938
- − Depreciation
- −$5,207
- Taxable income
- $1,537
- Est. tax owed @ 24.0%
- −$369
- After-tax cash flow
- $3,927/yr
For passive investors: Depreciation is non-cash, so a rental often shows a tax loss while cash-flowing — sheltering income. Rental losses are passive: they offset passive income freely, and up to $25,000/yr can offset ordinary (W-2) income if you actively participate and your MAGI is under $100k (phasing out to $0 by $150k); unused losses carry forward. On sale, claimed depreciation is recaptured at up to 25%, and gains may owe capital-gains tax (a 1031 exchange can defer both). Figures are a year-1 estimate at your 24.0% rate — not tax advice; consult a CPA.
Condition & rehab AI · 14 photos
This two-unit home requires moderate repairs and maintenance, including painting and updating bathrooms, to improve its condition and value.
Repairs flagged
- Major Paint — Paint chipping and peeling in multiple areas.
- Moderate Siding — Siding appears weathered and in need of repainting.
Value-add opportunities
- Both Painting and repainting the exterior and interior — Fresh paint will improve curb appeal and interior aesthetics, attracting both buyers and renters.
- Both Floor refinishing — Refinished hardwood floors will enhance the home's value and appeal to potential buyers and renters.
- Both Bathroom updates — Modernizing bathrooms with new fixtures and paint will significantly increase the home's value and attract more buyers and renters.
Renovation cost estimate screening
| Repair item | Severity | Est. cost |
|---|---|---|
| Paint · Paint chipping and peeling in multiple areas. | Major | $15,000–50,000 |
| Siding · Siding appears weathered and in need of repainting. | Moderate | $3,000–15,000 |
| Total estimated repair cost · 2 items | $18,000–65,000 |
Value-add ROI direction
- Both Painting and repainting the exterior and interior — Fresh paint will improve curb appeal and interior aesthetics, attracting both buyers and renters. ↑
- Both Floor refinishing — Refinished hardwood floors will enhance the home's value and appeal to potential buyers and renters. ↑
- Both Bathroom updates — Modernizing bathrooms with new fixtures and paint will significantly increase the home's value and attract more buyers and renters. ↑
ⓘ Cost ranges are severity-bucket heuristics (US national rule-of-thumb). Get contractor quotes + a written scope before underwriting a rehab budget.
Schools (NCES district)
- District
- Norwood-Norfolk Central School District
- NCES district ID
- 3621360
- Math proficiency
- 30% ▼ -8.00%
- Reading proficiency
- 36% ▼ -4.00%
- Median HH income
- $43,492
- Composite
- 28.05/100
- National rank
- #6841
- State rank
- #568 of 590 in NY
Livability — Norfolk
- Score
- 64/100
- State rank
- #737
- US rank
- #14031
Category grades
Schools grade is shown separately in the Schools card above.
Census & demographics
- Census place
- Norfolk, NY
- Population (ZIP)
- 3,460
Population outlook (St. Lawrence County) Hauer SSP2
- Today (2025)
- 110,027 people
- By 2030
- 107,455 · -2.3%
- By 2040
- 100,492 · -8.7%
- By 2050
- 94,254 · -14.3%
- By 2075
- 80,175 · -27.1%
- By 2100
- 63,140 · -42.6%
Race, ethnicity, and origin ACS 2023
- Neighborhood character
- Predominantly White (93%)
- Race & ethnicity
- White 93% Two or more races 5% Native American 2%
- Common ancestry
- Lithuanian 12% Serbian 3% Slovak 1%
- Foreign-born
- 1% · Canada
- Languages at home
- 99% English-only · German/W. Germanic 1%
Political lean MEDSL · St. Lawrence
- 2024 margin
- R (+18.0) · D 41.0% · R 59.0%
- 2008→2024 swing
- -34.3pp toward R · 2008: 16.3pp · 2024: -18.0pp
- All cycles
- 2024: R+18.0 2020: R+11.7 2016: R+10.8 2012: D+16.6 2008: D+16.3
Not yet ingested
- Civics
- —
Market trends
- HPI YoY
- ▼ -0.18%
- Current HPI
- 268.2319
- Rent YoY
- —
- Metro
- —
- State GDP YoY
- ▲ 2.60%
- F500 in state
- 92
Industry mix (Fortune 500 HQ in NY)
| Industry | F500 HQs | Revenue |
|---|---|---|
| Financial Services | 10 | $950B |
|
||
| Consumer Goods | 9 | $162B |
|
||
| Insurance | 4 | $225B |
|
||
| Telecommunications | 2 | $144B |
|
||
| Pharmaceuticals | 2 | $112B |
|
||
| Media / Entertainment | 2 | $69B |
|
||
Price history
1 event — show timeline
- 2026-05-28 Listed $179,000 SLCMLS
Cash-flow waterfall
monthlySold comps — $/sqft
last 12 mo · ≤1 miLoading sold comps…