 Duplex
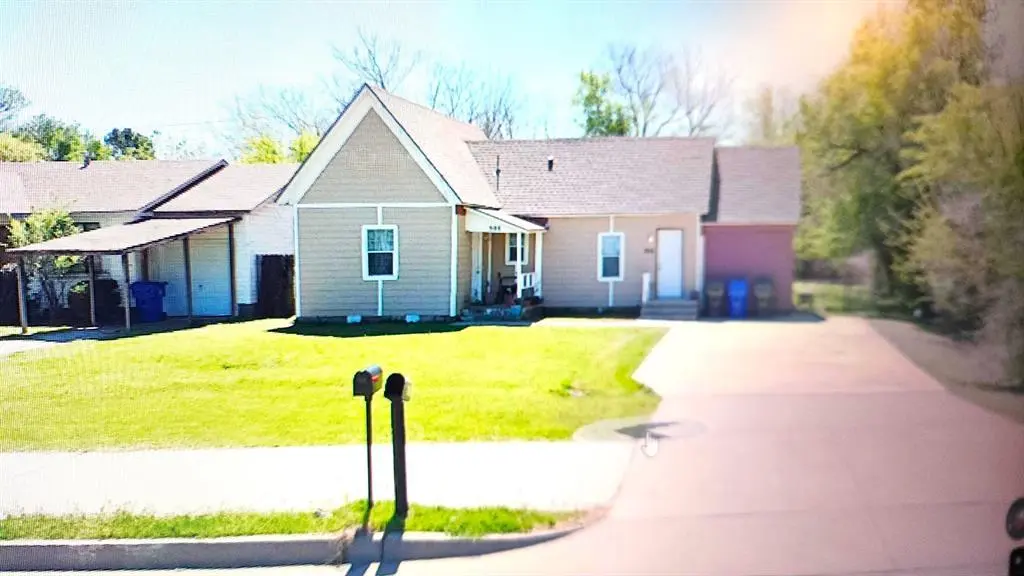
908 E Main St · Norman, OK
Flood risk 1/10 · Minimal
- FEMA flood zone
- X (unshaded)
- Chance of flooding over 30 yrs
- 0.0%
- Est. flood insurance / yr
- $507 – $1,088
Fire risk 4/10 · Minor
- Est. fire insurance / yr
- $2,463 – $4,575
Heat risk 6/10 · Moderate
- Hot days now (above 108°F)
- 7 days/yr
- Hot days in 30 yrs
- 19 days/yr
Wind risk 3/10 · Minor
- Chance of severe wind over 30 yrs
- 5.0%
Air-quality risk 2/10 · Minimal
- Unhealthy air days now
- 1 days/yr
- Unhealthy air days in 30 yrs
- 1 days/yr
Risk factors via First Street. Map © Google.
Why this score? — see what drove the B- grade
The composite is a weighted blend of 9 inputs, each scored 0–100. Each bar is that input's sub-score; the figure is the points it added to the 100-point composite (weight × sub-score).
- Cash flow +30.0/30.0
- DSCR +10.0/10.0
- 1% rule +8.4/10.0
- ARV discount +7.5/15.0
- Livability +4.2/5.0
- Rent growth +3.2/5.0
- Schools +2.6/10.0
- Condition / age +2.5/5.0
- Appreciation +0.0/10.0
$189,000
🖨 Deal sheet 📄 Offer letter ✓ Due diligence
Multi-family units
County records classify this as Multi-Family (2-4 Unit). Listing-text estimate: 2 units. confirmed
Listing remarks
Amazing Price Drop!!! Wow come check out this cute duplex located in the heart of Norman. Minutes from OU Campus and easy access to dining and highways. The duplex is a 1 bed 1 bath, and a 2 bed 1 bath units. Lovely one-story duplex in Norman, Oklahoma. Kitchen has granite countertops, appliances include an electric stove, dishwasher, and refrigerator. Carpet and laminate flooring. The units both have washer and dryer connections. Ample parking and a nice backyard for relaxing. Both units are occupied and will make a nice investment property. Call to take a tour today!!
Key facts
- 0.29 acre lot
- 4 parking spots
- Built 1950
Property features AI
Finance
- Other: Legal addition: 9-2W Tier 1; Lot size approximately 0.29 acres
- Financial info: Listing terms: Cash or Conventional; Assumable financing: No; Occupied and currently rented
- HOA & community: No mandatory association dues
Exterior
- Parking: Parking for 4 vehicles; Concrete parking surface
- Utilities: No flood insurance indicated
- Home design: Duplex residential income property; One-level
- Construction: Frame construction; Composition roof; Conventional foundation; Existing property
- Exterior features: Interior lot
Interior
- Kitchen: Range (2W)
- Bedrooms: 3 bedrooms; Property contains 2 residential units
- Bathrooms: 3 full bathrooms
- Heating & cooling: Electric heating
- Interior features: Dishwasher; Refrigerator
Neighborhood map
What this means for you Summary
Snapshot
- This is a 2 × 3-bed/1.5-bath units multifamily listed at $189k.
Deal economics
- At list price, monthly cash flow is $837 ($10k/yr) — positive. Per door: $419/mo.
- The deal already cash-flows at list — no discount required.
- Meets the 1% rule at list price ($3k rent vs $189k).
- Recommended offer: $178k (6.0% below list) — sets the bar for market timing.
Location & tenants
- Location reads 85/100 on livability (#1 in OK, #557 nationally) — a professional / high-income tenant draw. Strengths: amenities A+, commute A+, cost of living A+.
- Norman (suburban): math 27% / reading 32% proficiency, ranked #61 of 270 in OK (top 23%) — low school quality limits family demand, transient renter base, plan for 1-2y turnover.
- Zoned schools: Jefferson Es (math 32% / reading 32%, grade F, #213 of 845 statewide, top 28%, 368 students, 0% FRL); Norman North Hs (math 45% / reading 57%, grade D+, #2 of 447 statewide, top 0%, 2,401 students, 0% FRL) — zoned schools average 0% FRL vs 39% district-wide (39 pts lower); this property's tenant base skews higher-income than the district average.
- Zoned-school proficiency averages 42% at this address vs 30% district-wide (+12 pts) — the actual schools serving this property are materially stronger than the Norman average implies; a family-tenant draw the district grade alone would hide.
- Market conditions: Rents rising (+2.8%/yr); 350 active listings in the ZIP; 29 comparable units currently listed for rent nearby; rentals at typical pace (median 24d on market — plan ~3-4 weeks tenant-placement turnaround); 592 units permitted in Cleveland County in 2024 (12 in 5+ unit buildings).
Forward outlook
- Local home prices are declining (-3.0%/yr); year-one equity from $1k of loan paydown is wiped out by about $6k of value loss. Plan a longer hold.
- Cleveland County population projected at +40% by 2050 — long-run rental-demand tailwind backs the buy-and-hold thesis.
- At projected returns (-3.0% appreciation + 2.8% rent growth), your $53k cash investment doubles in ~7 years — after that, you're playing with house money.
Negotiation context
- It's been on market 84 days — a 6% lower offer ($178k) is reasonable based on typical stale-listing flexibility.
- 4 sale attempts since 26y ago; this cycle's ask has dropped $18k (9%) from the opening price — seller is motivated, your offer sets the floor, not the list.
- Current owner paid $82k; list at $189k implies a 130% gain — meaningful room to come down on a strong offer.
Risks & watch-outs
- Watch-outs: built in 1950 — expect roof / HVAC / electrical / plumbing capex.
- Climate carrying-cost: extreme-heat days projected 7→19/yr by 2055 (HVAC capex compounding) — expect insurance premiums to compound above CPI over the hold.
Questions for the listing agent
- It's been on market 84 days. Have you received any prior offers? Is the seller open to a 6% concession, seller financing, or rate buy-down credit?
- Can we see the unit-by-unit rent roll, current vacancy, and any below-market leases? What's the average tenancy length?
- What capital expenditures (roof, boiler, parking lot, exteriors) have been made in the last 5 years, and what's planned in the next 2?
- Built in 1950 — when were the roof, HVAC, electrical panel, plumbing, and water heater last replaced?
- Why hasn't it sold? Are there any deal-killer items the seller is aware of (foundation, flood, title, zoning, code violations)?
- Is there a deadline driving the sale (1031 exchange, divorce, estate, relocation)? That informs how much negotiation room exists.
- What's the average days-on-market for RENTAL listings here right now (not sales)? A rising rental-DOM trend means longer vacancies and softer asking-rent achievability than the comps imply.
- What's the recent tenant-quality profile in this submarket — average credit score on applications, eviction rate, late-payment / NSF rate, and stable-employment percentage? A property-management company in the area should have these aggregated.
- How much new apartment / multifamily construction is in the pipeline within 1–3 miles? Heavy new supply (>2% of stock underway) typically softens rents 12–24 months out; light construction supports rent growth.
Investment metrics
- 1% rule
- 1.34% ✓
- Cap rate
- 11.61%
- Cash-on-cash
- 18.98%
- DSCR
- 1.84
- GRM
- 6.2
CMA / ARV
No comps found within radius.
Projected returns pro-forma
-3.0% appreciation · 2.8% rent growth · sell at horizon
- IRR
- 10.6%
- Equity multiple
- 1.42×
- Total profit
- $22,136
- Equity at exit
- $28,181
- IRR
- 19.5%
- Equity multiple
- 2.62×
- Total profit
- $85,651
- Equity at exit
- $16,341
Cash invested: $52,920 (down + closing). Projections, not guarantees.
Landlord ↔ Tenant lean methodology
- Overall (STATE)
- 83 Strongly Landlord-Friendly
- State Oklahoma
- 83 Strongly Landlord-Friendly · R+20
- County
- — inherits STATE
- City
- — inherits STATE
ZIP-level market 73071
- Rents YoY
- 2.8%
- Active inventory
- 350
- Price-to-rent
- 12.5×
Monthly cashflow live
- Estimated rent
- $2,529 high interval (Pro) →
- Mortgage (P&I)
- −$991
- Tax from tax record
- −$91 /mo · $1,090/yr
- Insurance
- −$79
- HOA
- −$0
- Vacancy / Maint / Mgmt
- −$531
- Net cashflow
- $837
Break-even live
2-unit breakdown (identical units grouped — click to expand)
| Units | Beds | Baths | Est. rent |
|---|---|---|---|
| 2× units | 3 | 1.5 | $2,528 |
| #1 | 3 | 1.5 | $1,264 |
| #2 | 3 | 1.5 | $1,264 |
| Total (2 units) | $2,529 | ||
UW: 25.0% down · 7.5% · 30yr · 1.5% tax · 5.0% vac · 8.0% maint · 8.0% mgmt
Financing live
Cash to close
- Down payment
- $47,250
- Closing costs
- $5,670
- Reserves months
- —
- Total cash needed
- —
Loan-product check · same deal, 3 products live
Conventional
25% down · 7.5% · 30yr
- Down + closing
- —
- Monthly P&I
- —
- Monthly cashflow
- —
- DSCR
- —
- Eligible?
- —
Personal DTI + credit; lowest rate.
DSCR
20% down · 8.5% · 30yr
- Down + closing
- —
- Monthly P&I
- —
- Monthly cashflow
- —
- DSCR
- —
- Eligible?
- —
No personal income docs; deal must DSCR.
Hard money
10% down · 12.0% · 12mo
- Down + closing
- —
- Monthly P&I
- —
- Monthly cashflow
- —
- DSCR
- —
- Eligible?
- —
Short-term bridge; refi at stabilization.
Rent comps 29 comps
| Address | Beds | Baths | Sqft | Rent | $/sqft | DOM | Units | Dist |
|---|---|---|---|---|---|---|---|---|
| 101 Maple Ln Norman, OK | 3.0 | 1.0 | 1164 | $1,700 | $1.46 | 23d | 1 | 0.72mi |
| 1413 Buena Vista Cir Norman, OK | 3.0 | 2.0 | 1209 | $1,545 | $1.28 | 23d | 1 | 0.75mi |
| 1505 Shrill Ct Norman, OK | 3.0 | 2.0 | 1818 | $2,195 | $1.21 | 23d | 1 | 0.80mi |
| 241 Emelyn St Norman, OK | 3.0 | 2.0 | 910 | $1,500 | $1.65 | 3d | 1 | 0.86mi |
| 1605 Blessing Ct Norman, OK | 4.0 | 1.5 | 1071 | $1,930 | $1.80 | 23d | 1 | 0.90mi |
| 106 W Mosier St Norman, OK | 4.0 | 2.0 | 1762 | $2,150 | $1.22 | 23d | 1 | 0.94mi |
| 1301 Melisa Dr Norman, OK | 4.0 | 2.0 | 1775 | $2,000 | $1.13 | 11d | 1 | 0.96mi |
| 375 Triad Village Dr Norman, OK | 3.0 | 2.0–2.5 | 1428 | $1,425 | $1.00 | 23d | 2 | 0.98mi |
| 375 Triad Village Dr Norman, OK | 3.0 | 2.0 | 1428 | $1,425 | $1.00 | 21d | 1 | 0.98mi |
| 222 McCullough Norman, OK | 3.0 | 2.0 | 1175 | $3,300 | $2.81 | 23d | 1 | 0.99mi |
| 1612 Claudia Dr Norman, OK | 3.0 | 2.5 | 1200 | $1,350 | $1.12 | 3d | 1 | 1.00mi |
| 1628 Claudia Dr Norman, OK | 3.0 | 2.5 | 1200 | $1,250 | $1.04 | 23d | 1 | 1.01mi |
| 1640 High Cir Norman, OK | 3.0 | 2.0 | 1215 | $1,200 | $0.99 | 14d | 1 | 1.03mi |
| 1712 Jennifer Cir Norman, OK | 3.0 | 1.5 | 1425 | $1,195 | $0.84 | 21d | 1 | 1.05mi |
| 101 E Haddock St Norman, OK | 3.0 | 1.0 | 1146 | $1,425 | $1.24 | 14d | 1 | 1.08mi |
| 203 W Dale St Norman, OK | 3.0 | 2.0 | 997 | $1,395 | $1.40 | 23d | 1 | 1.10mi |
| 517 Coronado Ave Norman, OK | 3.0 | 2.0 | 1207 | $1,465 | $1.21 | 3d | 1 | 1.11mi |
| 418 N Flood Ave Norman, OK | 3.0 | 1.0 | 1200 | $1,600 | $1.33 | 3d | 1 | 1.22mi |
| 227 W Ridge Rd Norman, OK | 3.0 | 2.0 | 1172 | $1,420 | $1.21 | 14d | 1 | 1.27mi |
| 820 Richmond Dr Norman, OK | 3.0 | 2.0 | 1175 | $1,495 | $1.27 | 23d | 1 | 1.27mi |
| 1149 W Brooks St Norman, OK | 1.0–4.0 | 1.0–2.0 | 1025 | $1,402 | $1.37 | 1d | 7 | 1.28mi |
| 821 Russell Cir Unit 821 Norman, OK | 3.0 | 1.5 | 877 | $1,050 | $1.20 | 23d | 1 | 1.31mi |
| 1009 Idaho St Norman, OK | 3.0 | 1.0 | 1508 | $1,500 | $0.99 | 14d | 1 | 1.31mi |
| 1345 Columbia Cir Norman, OK | 4.0 | 2.0 | 1357 | $1,600 | $1.18 | 23d | 1 | 1.33mi |
| 820 Russell Cir Norman, OK | 3.0 | 1.5 | 940 | $1,050 | $1.12 | 23d | 1 | 1.34mi |
| 712 Dakota St Norman, OK | 3.0 | 1.0 | 1353 | $1,395 | $1.03 | 3d | 1 | 1.34mi |
| 751 Iowa St Norman, OK | 3.0 | 1.0 | 1148 | $1,600 | $1.39 | 3d | 1 | 1.34mi |
| 1817 Beaumont Dr Norman, OK | 3.0 | 2.0 | 1100 | $1,200 | $1.09 | 23d | 1 | 1.48mi |
| 532 Lone Oak Dr Norman, OK | 3.0 | 2.0 | 1545 | $1,695 | $1.10 | 23d | 1 | 1.50mi |
Listing history 25 events
-
2026-06-18days on market $189,000 Active 84 DOM
-
2026-06-17days on market $189,000 Active 83 DOM
-
2026-06-16days on market $189,000 Active 82 DOM
-
2026-06-15days on market $189,000 Active 81 DOM
-
2026-06-13days on market $189,000 Active 79 DOM
-
2026-06-09days on market $189,000 Active 75 DOM
-
2026-06-08days on market $189,000 Active 74 DOM
-
2026-06-07days on market $189,000 Active 73 DOM
-
2026-06-05days on market $189,000 Active 70 DOM
-
2026-06-03days on market $189,000 Active 69 DOM
-
2026-06-02days on market $189,000 Active 68 DOM
-
2026-06-01days on market $189,000 Active 67 DOM
-
2026-05-31days on market $189,000 Active 66 DOM
-
2026-04-30price $189,000
-
2026-04-09price $199,000
-
2026-03-26$207,000 Active
-
2025-09-03historical $825
-
2025-08-25price $825
-
2025-07-24$850
-
2023-09-10historical
-
2023-08-17
-
2007-12-19historical
-
2004-01-30soldstatus $82,000
-
2000-11-06$59,000
-
2000-06-08soldstatus $25,000
ⓘ Source: listings_history table (triggers on properties + properties_extension) + one-shot
backfill from property_details.listing_events for pre-trigger history.
Tax reassessment forecast OK · Resets to sale price
- Current annual tax
- $1,090 · $91/mo
- Projected year-2 tax
- $1,701 · $142/mo
- Expected delta
- +$611/yr (+$51/mo · 56.1%)
ⓘ Screening estimate from a state-policy table — verify with the county assessor before closing.
Climate risk First Street
- Flood 1/10 Low FEMA zone X (unshaded) · 0% chance over 30 yrs
- Wildfire 4/10 Moderate
- Heat 6/10 Major 7 d/yr ≥108°F today · 19 d/yr by 30 yrs out
- Wind 3/10 Moderate 5% chance of damaging wind over 30 yrs
- Air quality 2/10 Low 1 unhealthy d/yr today · 1 by 30 yrs out
Nearby sold comps map
Loading sold comps map…
Walkable amenities ~0.75 mi
Loading nearby amenities…
Taxation est. · year 1
- Rental income
- $30,348
- − Mortgage interest
- −$10,587
- − Property taxes
- −$1,090
- − Insurance
- −$945
- − Repairs & maintenance
- −$2,428
- − Management
- −$2,428
- − Depreciation
- −$5,498
- Taxable income
- $7,372
- Est. tax owed @ 24.0%
- −$1,769
- After-tax cash flow
- $8,277/yr
For passive investors: Depreciation is non-cash, so a rental often shows a tax loss while cash-flowing — sheltering income. Rental losses are passive: they offset passive income freely, and up to $25,000/yr can offset ordinary (W-2) income if you actively participate and your MAGI is under $100k (phasing out to $0 by $150k); unused losses carry forward. On sale, claimed depreciation is recaptured at up to 25%, and gains may owe capital-gains tax (a 1031 exchange can defer both). Figures are a year-1 estimate at your 24.0% rate — not tax advice; consult a CPA.
Schools (NCES district)
- District
- Norman
- NCES district ID
- 4021720
- Math proficiency
- 27% ▼ -9.00%
- Reading proficiency
- 32% ▼ -8.00%
- Median HH income
- $48,940
- Composite
- 25.67/100
- National rank
- #7395
- State rank
- #61 of 270 in OK
Livability — Norman
- Score
- 85/100
- State rank
- #1
- US rank
- #557
Category grades
Schools grade is shown separately in the Schools card above.
Census & demographics
- Census place
- Norman, OK
- County
- Cleveland County · 239,547 people
- City population
- 123,141
- Metro
- Oklahoma City, OK
- Population (ZIP)
- 43,798
- Household income
- $64,007
- Rent vs Own
- Severe rent burden
- 1903.0
Population outlook (Cleveland County) Hauer SSP2
- Today (2025)
- 323,621 people
- By 2030
- 349,070 · +7.9%
- By 2040
- 400,168 · +23.7%
- By 2050
- 454,101 · +40.3%
- By 2075
- 602,926 · +86.3%
- By 2100
- 734,485 · +127.0%
Race, ethnicity, and origin ACS 2023
- Neighborhood character
- Predominantly White (68%)
- Race & ethnicity
- White 68% Two or more races 12% Black 8% Hispanic / Latino 8% Asian 3% Native American 3%
- Hispanic origin (detail)
- Mexican 5%
- Common ancestry
- Italian 3% Serbian 3% Lithuanian 2%
- Foreign-born
- 7% · Canada, China
- Languages at home
- 89% English-only · Spanish 5% Other Indo-European 1% Chinese 1%
Political lean MEDSL · Cleveland
- 2024 margin
- R (+14.9) · D 41.4% · R 56.4% · Other 2.2%
- 2008→2024 swing
- +9.1pp toward D · 2008: -24.0pp · 2024: -14.9pp
- All cycles
- 2024: R+14.9 2020: R+14.1 2016: R+21.7 2012: R+25.9 2008: R+24.0
Not yet ingested
- Civics
- —
Market trends
- HPI YoY
- ▼ -187.04%
- Current HPI
- 249.3797
- Rent YoY
- ▲ 2.80%
- Metro
- Oklahoma City, OK
- State GDP YoY
- ▲ 1.55%
- F500 in state
- 6
Industry mix (Fortune 500 HQ in OK)
| Industry | F500 HQs | Revenue |
|---|---|---|
| Energy | 3 | $48B |
|
||
Price history
+656.0% since first listed12 events — show timeline
- 2026-04-30 Price Changed $189,000 MLSOK
- 2026-04-09 Price Changed $199,000 MLSOK
- 2026-03-26 Listed $207,000 MLSOK
- 2025-09-03 Rental Removed $825 APPFOLIO
- 2025-08-25 Price Changed $825 APPFOLIO
- 2025-07-24 Listed for Rent $850 APPFOLIO
- 2023-09-10 Rental Removed — APPFOLIO
- 2023-08-17 Listed for Rent — APPFOLIO
- 2007-12-19 Listing Removed — MLSOK
- 2004-01-30 Sold (Public Records) $82,000 Public Records
- 2000-11-06 Listed $59,000 MLSOK
- 2000-06-08 Sold (Public Records) $25,000 Public Records
Property tax history
+4.9%/yrLatest (2024): $1,090 · +4.7% YoY. Source: county tax records.
Cash-flow waterfall
monthlySold comps — $/sqft
last 12 mo · ≤1 miLoading sold comps…