138 Lost Creek Trl · Abilene, TX
Flood risk No data
- FEMA flood zone
- —
- Chance of flooding over 30 yrs
- —
- Est. flood insurance / yr
- —
Fire risk No data
- Est. fire insurance / yr
- —
Heat risk No data
- Hot days now (above threshold)
- —
- Hot days in 30 yrs
- —
Wind risk No data
- Chance of severe wind over 30 yrs
- —
Air-quality risk No data
- Unhealthy air days now
- —
- Unhealthy air days in 30 yrs
- —
Risk factors via First Street. Map © Google.
Why this score? — see what drove the C grade
The composite is a weighted blend of 9 inputs, each scored 0–100. Each bar is that input's sub-score; the figure is the points it added to the 100-point composite (weight × sub-score).
- Cash flow +23.0/30.0
- ARV discount +7.5/15.0
- DSCR +7.4/10.0
- 1% rule +6.0/10.0
- Rent growth +5.0/5.0
- Condition / age +4.0/5.0
- Livability +3.8/5.0
- Schools +2.8/10.0
- Appreciation +0.0/10.0
$244,990
🖨 Deal sheet 📄 Offer letter ✓ Due diligence
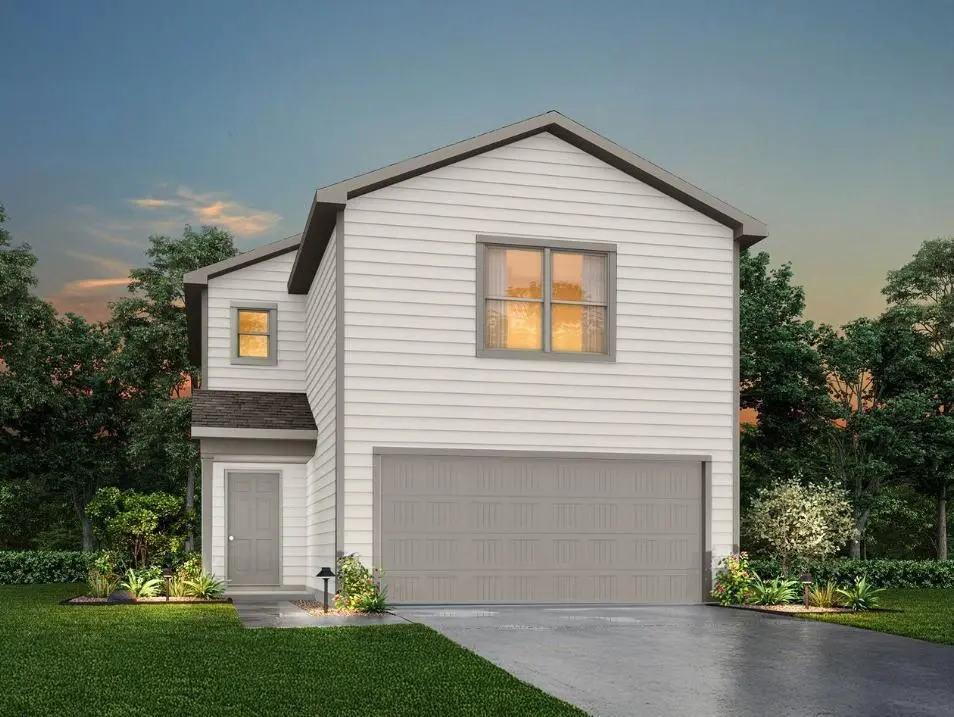
Listing remarks
MLS# 21289149 - Built by NHC - Sep 2026 completion! ~ Model 1600-2 A1 - Glacier The Glacier Plan from our Freedom Series is a thoughtfully designed 2-story home offering 3 bedrooms, 2.5 bathrooms, and 1,600 square feet of living space, complete with a 2-car garage. As you step inside, you’ll pass the staircase to the upper level before arriving at the bright and open family room. This inviting space flows seamlessly into the kitchen and dining area, creating the perfect setting for family time or entertainment. A convenient half bathroom is located just off the kitchen for easy access. The upper level is designed for relaxation and privacy, featuring a spacious primary suite with a w
Key facts
- 4,169 sq ft lot
- 2 garage spots
- Built 2025
Property features AI
Finance
- Other: Builder special listing conditions; Subdivision: Waterside at Cedar Creek; County: Taylor, United States
- Financial info: Treat as clear loan type; No second mortgage
- HOA & community: No association; No association fee
Exterior
- Parking: Attached 2-car garage; Two covered parking spaces; Garage faces front
- Utilities: City water service; City sewer service; No municipal utility district
- Home design: Single family residence (residential); Two stories; New construction (incomplete; year built 2025)
- Construction: Siding exterior; Composition roof; Slab foundation
- Exterior features: City water; City sewer; Condo/Townhome lot
Interior
- Kitchen: Dishwasher; Disposal; Electric range; Microwave
- Bedrooms: Three bedrooms (primary bedroom on level 2 with walk-in closet)
- Flooring: Carpet; Vinyl
- Bathrooms: Two full bathrooms; One half bathroom
- Heating & cooling: Central heating (electric); Central air conditioning (electric)
- Interior features: Eat-in kitchen; Open floorplan; Pantry; One living area; One dining area; Six total rooms; Two levels
Neighborhood map
What this means for you Summary
Snapshot
- This is a 3-bed/2.5-bath single-family listed at $245k. Condition is rated good.
Deal economics
- At list price, monthly cash flow is $433 ($5k/yr) — positive.
- The deal already cash-flows at list — no discount required.
- Meets the 1% rule at list price ($3k rent vs $245k).
- Cap rate 8.4% vs local median 6.7% in Abilene — meaningfully above typical; check what's discounted (condition, days-on-market, listing class) to confirm the premium yield is real.
Location & tenants
- Location reads 75/100 on livability (#142 in TX, #4,037 nationally) — a middle-class / working-renter tenant base. Strengths: cost of living A+, housing A+, health & safety A+; Watch: crime D, commute F.
- Abilene ISD (urban): math 32% / reading 34% proficiency, ranked #575 of 826 in TX (top 70%) — families likely to look elsewhere, expect single-tenant / working-renter base with shorter leases.
- Zoned schools: Alcorta El (math 35% / reading 28%, grade F, #2,396 of 4,322 statewide, top 56%, 451 students, 70% FRL).
- Market conditions: Rents rising fast (+33.5%/yr); 370 active listings in the ZIP; 6 comparable units currently listed for rent nearby; rentals at typical pace (median 21d on market — plan ~3-4 weeks tenant-placement turnaround); solid renter incomes; 508 units permitted in Taylor County in 2024 (0 in 5+ unit buildings).
- This rent runs 36% of the median local income ($90k/yr) — at the standard rent-burdened threshold; future hikes will face affordability resistance.
Forward outlook
- Local home prices are declining (-3.0%/yr); year-one equity from $2k of loan paydown is wiped out by about $7k of value loss. Plan a longer hold.
- Taylor County population projected at +16% by 2050 — long-run rental-demand tailwind backs the buy-and-hold thesis.
- At projected returns (-3.0% appreciation + 8.0% rent growth), your $69k cash investment doubles in ~8 years — after that, you're playing with house money.
Negotiation context
- Only 3 days on market — expect competitive offers; lowballing is unlikely to land.
Questions for the listing agent
- Is there a deadline driving the sale (1031 exchange, divorce, estate, relocation)? That informs how much negotiation room exists.
- Schools are D-rated, which usually means shorter tenancies and higher turnover. Who's the typical renter profile here, and what's been the actual vacancy rate?
- Crime grade is D in this area — have there been break-ins, vandalism, or insurance claims at this property in the last 3 years? What carrier currently insures it and at what premium?
- What's the average days-on-market for RENTAL listings here right now (not sales)? A rising rental-DOM trend means longer vacancies and softer asking-rent achievability than the comps imply.
- What's the recent tenant-quality profile in this submarket — average credit score on applications, eviction rate, late-payment / NSF rate, and stable-employment percentage? A property-management company in the area should have these aggregated.
- How much new for-sale + rental construction is in the pipeline within 1–3 miles? Heavy new supply typically softens prices + rents 12–24 months out; constrained supply supports both.
Investment metrics
- 1% rule
- 1.10% ✓
- Cap rate
- 8.41%
- Cash-on-cash
- 7.57%
- DSCR
- 1.34
- GRM
- 7.6
CMA / ARV
- ARV (on-the-fly)
- $108,800
- Comps found
- 8
Show comp detail 8 sales within ~0.75 mi
| Address | Dist | Beds/Ba | Sqft | Sold | Price | $/sf | Match |
|---|---|---|---|---|---|---|---|
| 1432 N 6th St | 0.42mi | 2/1.0 (-1) | 1,600 (0%) | 11mo | $60,000 | $38 | 60 |
| 1730 N 3rd St | 0.66mi | 3/1.0 | 1,648 (+3%) | 2mo | $209,000 | $127 | 57 |
| 226 Palm St | 0.67mi | 2/2.0 (-1) | 1,512 (-6%) | 3mo | $69,900 | $46 | 50 |
| 1833 N 7th St | 0.74mi | 3/2.0 | 1,516 (-5%) | 5mo | $80,000 | $53 | 50 |
| 1737 N 3rd St | 0.67mi | 3/2.0 | 1,462 (-9%) | 6mo | $165,000 | $113 | 47 |
| 750 Merchant St | 0.73mi | 3/2.0 | 1,728 (+8%) | 7mo | $117,000 | $68 | 45 |
| 1225 S 5th St | 0.72mi | 2/2.0 (-1) | 1,676 (+5%) | 10mo | $175,000 | $104 | 44 |
| 1002 Cedar St | 0.55mi | 3/2.0 | 1,476 (-8%) | 24mo | $45,000 | $30 | 40 |
Match score weights: distance 35% · size 25% · config 20% · recency 20%. Top-matched comps best support the ARV.
Projected returns pro-forma
-3.0% appreciation · 8.0% rent growth · sell at horizon
- IRR
- 0.8%
- Equity multiple
- 1.03×
- Total profit
- $2,143
- Equity at exit
- $36,529
- IRR
- 14.9%
- Equity multiple
- 2.49×
- Total profit
- $102,277
- Equity at exit
- $21,182
Cash invested: $68,597 (down + closing). Projections, not guarantees.
Landlord ↔ Tenant lean methodology
- Overall (STATE)
- 87 Strongly Landlord-Friendly
- State Texas
- 87 Strongly Landlord-Friendly · R+5
- County
- — inherits STATE
- City
- — inherits STATE
ZIP-level market 79602
- Home prices YoY
- -19.6%
- Rents YoY
- 33.5%
- Active inventory
- 370
- Price-to-rent
- 7.6×
Monthly cashflow live
- Estimated rent
- $2,691 high interval (Pro) →
- Mortgage (P&I)
- −$1,285
- Tax est. 1.5%
- −$306 /mo · $3,675/yr
- Insurance
- −$102
- HOA
- −$0
- Vacancy / Maint / Mgmt
- −$565
- Net cashflow
- $433
Break-even live
UW: 25.0% down · 7.5% · 30yr · 1.5% tax · 5.0% vac · 8.0% maint · 8.0% mgmt
Financing live
Cash to close
- Down payment
- $61,248
- Closing costs
- $7,350
- Reserves months
- —
- Total cash needed
- —
Loan-product check · same deal, 3 products live
Conventional
25% down · 7.5% · 30yr
- Down + closing
- —
- Monthly P&I
- —
- Monthly cashflow
- —
- DSCR
- —
- Eligible?
- —
Personal DTI + credit; lowest rate.
DSCR
20% down · 8.5% · 30yr
- Down + closing
- —
- Monthly P&I
- —
- Monthly cashflow
- —
- DSCR
- —
- Eligible?
- —
No personal income docs; deal must DSCR.
Hard money
10% down · 12.0% · 12mo
- Down + closing
- —
- Monthly P&I
- —
- Monthly cashflow
- —
- DSCR
- —
- Eligible?
- —
Short-term bridge; refi at stabilization.
Rent comps 6 comps
| Address | Beds | Baths | Sqft | Rent | $/sqft | DOM | Units | Dist |
|---|---|---|---|---|---|---|---|---|
| 702 N 13th St Abilene, TX | 3.0 | 2.0 | 1334 | $2,200 | $1.65 | 13d | 1 | 0.75mi |
| 1426 Plum St Abilene, TX | 3.0 | 2.0 | 1090 | $2,014 | $1.85 | 13d | 1 | 0.86mi |
| 725 Peach St Abilene, TX | 3.0 | 2.0 | 1618 | $3,500 | $2.16 | 21d | 1 | 0.96mi |
| 1209 Kirkwood St Abilene, TX | 3.0 | 2.0 | 1674 | $2,500 | $1.49 | 21d | 1 | 1.26mi |
| 1638 Merchant St Abilene, TX | 3.0 | 2.0 | 1328 | $2,895 | $2.18 | 13d | 1 | 1.28mi |
| 825 Milford St Abilene, TX | 3.0 | 2.0 | 2068 | $2,895 | $1.40 | 44d | 1 | 1.31mi |
Listing history 3 events
-
2026-06-07statusdays on market $244,990 Pending 3 DOM
-
2026-06-03remarks 693-char remark
-
2026-06-03$244,990 Active 1 DOM
ⓘ Source: listings_history table (triggers on properties + properties_extension) + one-shot
backfill from property_details.listing_events for pre-trigger history.
Nearby sold comps map
Loading sold comps map…
Walkable amenities ~0.75 mi
Loading nearby amenities…
Taxation est. · year 1
- Rental income
- $32,295
- − Mortgage interest
- −$13,723
- − Property taxes
- −$3,675
- − Insurance
- −$1,225
- − Repairs & maintenance
- −$2,584
- − Management
- −$2,584
- − Depreciation
- −$7,127
- Taxable income
- $1,378
- Est. tax owed @ 24.0%
- −$331
- After-tax cash flow
- $4,866/yr
For passive investors: Depreciation is non-cash, so a rental often shows a tax loss while cash-flowing — sheltering income. Rental losses are passive: they offset passive income freely, and up to $25,000/yr can offset ordinary (W-2) income if you actively participate and your MAGI is under $100k (phasing out to $0 by $150k); unused losses carry forward. On sale, claimed depreciation is recaptured at up to 25%, and gains may owe capital-gains tax (a 1031 exchange can defer both). Figures are a year-1 estimate at your 24.0% rate — not tax advice; consult a CPA.
Condition & rehab AI · 5 photos
This home is in excellent condition with a good condition score of 80. It is move-in ready with no visible repairs needed. The highest-ROI updates would be painting the exterior and interior, landscaping improvements, and adding smart home features.
Value-add opportunities
- Both Painting the exterior and interior walls — Fresh paint can enhance curb appeal and interior aesthetics.
- Both Landscaping improvements — Enhanced landscaping can improve curb appeal and attract potential buyers/tenants.
- Resale Upgrading the kitchen appliances — Modern appliances can increase the home's appeal to potential buyers.
- Both Adding smart home features — Smart home features can increase convenience and appeal to both buyers and tenants.
- Both Upgrading the HVAC system — A more efficient HVAC system can improve comfort and reduce energy costs, attracting more buyers/tenants.
- Both Adding a smart thermostat — A smart thermostat can improve energy efficiency and comfort, attracting more buyers/tenants.
Renovation cost estimate screening
Value-add ROI direction
- Both Painting the exterior and interior walls — Fresh paint can enhance curb appeal and interior aesthetics. ↑
- Both Landscaping improvements — Enhanced landscaping can improve curb appeal and attract potential buyers/tenants. ↑
- Resale Upgrading the kitchen appliances — Modern appliances can increase the home's appeal to potential buyers. ↑
- Both Adding smart home features — Smart home features can increase convenience and appeal to both buyers and tenants. ↑
- Both Upgrading the HVAC system — A more efficient HVAC system can improve comfort and reduce energy costs, attracting more buyers/tenants. ↑
- Both Adding a smart thermostat — A smart thermostat can improve energy efficiency and comfort, attracting more buyers/tenants. ↑
ⓘ Cost ranges are severity-bucket heuristics (US national rule-of-thumb). Get contractor quotes + a written scope before underwriting a rehab budget.
Schools (NCES district)
- District
- Abilene ISD
- NCES district ID
- 4807440
- Math proficiency
- 32% ▼ -11.00%
- Reading proficiency
- 34% ▼ -5.00%
- Median HH income
- $39,782
- Composite
- 27.71/100
- National rank
- #6909
- State rank
- #575 of 826 in TX
Livability — Abilene
- Score
- 75/100
- State rank
- #142
- US rank
- #4037
Category grades
Schools grade is shown separately in the Schools card above.
Census & demographics
- Census place
- Abilene, TX
- County
- Taylor County · 136,672 people
- City population
- 136,672
- Metro
- Abilene, TX
- Population (ZIP)
- 27,425
- Household income
- $89,551
- Rent vs Own
- Severe rent burden
- 338.0
Population outlook (Taylor County) Hauer SSP2
- Today (2025)
- 145,270 people
- By 2030
- 150,050 · +3.3%
- By 2040
- 159,417 · +9.7%
- By 2050
- 168,883 · +16.3%
- By 2075
- 194,436 · +33.8%
- By 2100
- 203,163 · +39.9%
Race, ethnicity, and origin ACS 2023
- Neighborhood character
- Majority White (64%)
- Race & ethnicity
- White 64% Hispanic / Latino 22% Two or more races 12% Black 10% Asian 2%
- Hispanic origin (detail)
- Mexican 19%
- Common ancestry
- Romanian 2% Italian 2% Portuguese 2%
- Foreign-born
- 6% · Canada, Vietnam, Jamaica
- Languages at home
- 87% English-only · Spanish 9% Other Asian/Pacific 1% French/Haitian/Cajun 1%
Political lean MEDSL · Taylor
- 2024 margin
- Solid R (+49.8) · D 24.6% · R 74.4% · Other 1.0%
- 2008→2024 swing
- -4.2pp toward R · 2008: -45.6pp · 2024: -49.8pp
- All cycles
- 2024: R+49.8 2020: R+45.3 2016: R+51.1 2012: R+53.6 2008: R+45.6
Not yet ingested
- Civics
- —
Market trends
- HPI YoY
- ▼ -46.04%
- Current HPI
- 189.3098
- Rent YoY
- ▲ 33.46%
- Metro
- Abilene, TX
- State GDP YoY
- ▲ 3.95%
- F500 in state
- 110
Industry mix (Fortune 500 HQ in TX)
| Industry | F500 HQs | Revenue |
|---|---|---|
| Energy | 16 | $1,198B |
|
||
| Technology | 5 | $198B |
|
||
| Engineering / Construction | 4 | $72B |
|
||
| Energy Services | 3 | $60B |
|
||
| Utilities | 3 | $41B |
|
||
| Healthcare | 2 | $330B |
|
||
Price history
1 event — show timeline
- 2026-06-02 Listed $244,990 NTREIS
Cash-flow waterfall
monthlySold comps — $/sqft
last 12 mo · ≤1 miLoading sold comps…