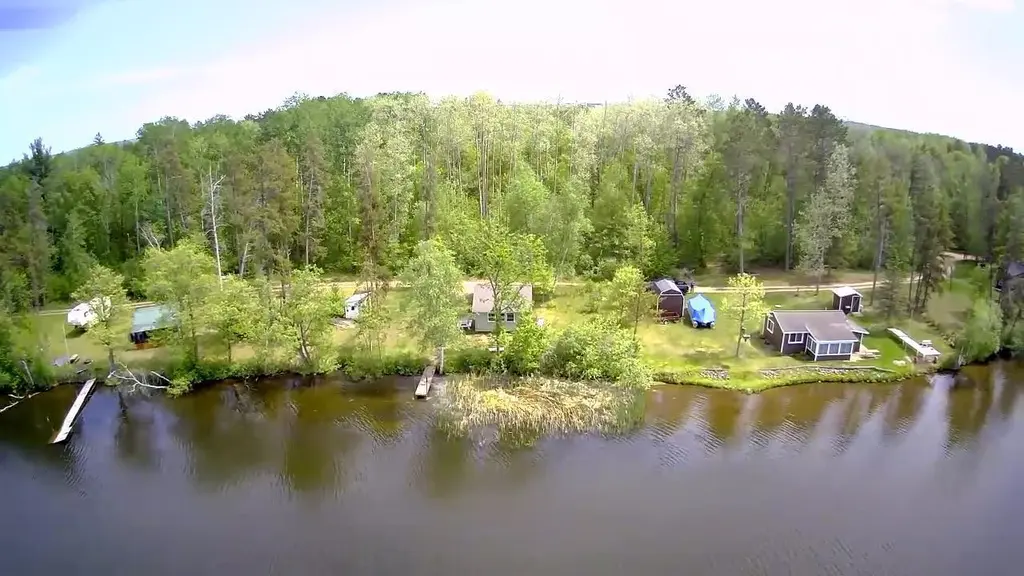
 🌊 Lakefront
38013 Danberry Trl · Pillager, MN
Flood risk 8/10 · Major
- FEMA flood zone
- A
- Chance of flooding over 30 yrs
- 0.99%
- Est. flood insurance / yr
- $872 – $3,168
Fire risk 2/10 · Minimal
- Est. fire insurance / yr
- $888 – $1,650
Heat risk 1/10 · Minimal
- Hot days now (above threshold)
- 7 days/yr
- Hot days in 30 yrs
- 13 days/yr
Wind risk No data
- Chance of severe wind over 30 yrs
- —
Air-quality risk No data
- Unhealthy air days now
- —
- Unhealthy air days in 30 yrs
- —
Risk factors via First Street. Map © Google.
Why this score? — see what drove the B- grade
The composite is a weighted blend of 9 inputs, each scored 0–100. Each bar is that input's sub-score; the figure is the points it added to the 100-point composite (weight × sub-score).
- Cash flow +30.0/30.0
- DSCR +10.0/10.0
- 1% rule +9.0/10.0
- ARV discount +7.5/15.0
- Schools +4.1/10.0
- Livability +3.1/5.0
- Rent growth +2.5/5.0
- Condition / age +2.5/5.0
- Appreciation +0.0/10.0
$99,900
🖨 Deal sheet 📄 Offer letter ✓ Due diligence
Listing remarks
Welcome to your Lake Placid getaway, featuring a sandy shoreline and stunning sunset views. This one-bedroom cabin sits just steps from the water, offering level elevation and easy access to the lake. Inside, you'll find vaulted ceilings, vinyl windows, and low-maintenance vinyl siding. The property also includes a yard shed with a built-in outhouse for added convenience. Located on MN Power leased land, this is a great opportunity to enjoy affordable lake living and start making lasting memories on the water. Schedule your showing and start enjoying lake life today!
Key facts
- Vinyl windows
- Level elevation
- Sunset views
Tags
Property features AI
Finance
- Financial info: $294 annual tax (2025)
- HOA & community: Land is leased (monthly land lease approximately $70.33)
Exterior
- Parking: No designated parking listed
- Utilities: Water from sand point (other); Outhouse sewer; 100 amp electric service (Minnesota Power); Fuel: other
- Home design: Residential property; One story; Entry level on main; Pitched asphalt roof
- Construction: Pillar/post/pier foundation; Asphalt pitched roof
- Exterior features: Vinyl exterior; Private road frontage on a privately maintained road; Dock and lakefront access; Lake bottom: sand and weeds; Approximately 100 feet of waterfront
Interior
- Kitchen: Kitchen on main level — approximately 14 x 6; Range
- Bedrooms: 1 bedroom (Main level) — approximately 13 x 9.5
- Bathrooms: One quarter bath
- Heating & cooling: No heating listed; No cooling listed
- Interior features: Range included; Main floor bedroom
- Laundry & utility: No built-in heating or cooling listed
Neighborhood map
What this means for you Summary
Snapshot
- This is a 1-bed/1.0-bath single-family listed at $100k.
Deal economics
- At list price, monthly cash flow is $347 ($4k/yr) — positive.
- The deal already cash-flows at list — no discount required.
- Meets the 1% rule at list price ($1k rent vs $100k).
Location & tenants
- Location reads 61/100 on livability (#722 in MN) — a middle-class / working-renter tenant base. Strengths: crime A+, cost of living A+, housing A+; Watch: health & safety C-, amenities F, commute F.
- Pillager Public School District (rural): math 43% / reading 51% proficiency, ranked #146 of 301 in MN (top 48%) — families likely to look elsewhere, expect single-tenant / working-renter base with shorter leases.
- Market conditions: 31 active listings in the ZIP; 179 units permitted in Morrison County in 2024 (45 in 5+ unit buildings).
Forward outlook
- Local home prices are declining (-3.0%/yr); year-one equity from $691 of loan paydown is wiped out by about $3k of value loss. Plan a longer hold.
- Morrison County population projected at -20% by 2050 — secular population decline; favor cash flow + early exit over multi-decade hold.
- At projected returns (-3.0% appreciation + 3.0% rent growth), your $28k cash investment doubles in ~8 years — after that, you're playing with house money.
Negotiation context
- Only 12 days on market — expect competitive offers; lowballing is unlikely to land.
Risks & watch-outs
- Watch-outs: flood insurance adds $168/mo; built in 1951 — expect roof / HVAC / electrical / plumbing capex.
- Climate carrying-cost: in FEMA flood zone A (mandatory federal flood insurance) — expect insurance premiums to compound above CPI over the hold.
Questions for the listing agent
- Built in 1951 — when were the roof, HVAC, electrical panel, plumbing, and water heater last replaced?
- What's the actual annual flood-insurance premium (NFIP or private), and is the property in a SFHA with mandatory coverage?
- Is there a deadline driving the sale (1031 exchange, divorce, estate, relocation)? That informs how much negotiation room exists.
- This sits on a lake — are riparian / water-frontage rights deeded with the parcel? Any dock permits, shoreline easements, or HOA water-use restrictions?
- What's the documented flood / surge / shoreline-erosion history here (FEMA AND non-FEMA — e.g., storm surge, creek backup, septic-field saturation)?
- Any water-quality or seasonal algae-bloom issues that affect tenant satisfaction or short-term-rental demand?
- What's the average days-on-market for RENTAL listings here right now (not sales)? A rising rental-DOM trend means longer vacancies and softer asking-rent achievability than the comps imply.
- What's the recent tenant-quality profile in this submarket — average credit score on applications, eviction rate, late-payment / NSF rate, and stable-employment percentage? A property-management company in the area should have these aggregated.
- How much new for-sale + rental construction is in the pipeline within 1–3 miles? Heavy new supply typically softens prices + rents 12–24 months out; constrained supply supports both.
Investment metrics
- 1% rule
- 1.40% ✓
- Cap rate
- 12.48%
- Cash-on-cash
- 22.10%
- DSCR
- 1.98
- GRM
- 6.0
CMA / ARV
No comps found within radius.
Projected returns pro-forma
-3.0% appreciation · 3.0% rent growth · sell at horizon
- IRR
- 5.5%
- Equity multiple
- 1.21×
- Total profit
- $5,966
- Equity at exit
- $14,895
- IRR
- 15.0%
- Equity multiple
- 2.21×
- Total profit
- $33,896
- Equity at exit
- $8,638
Cash invested: $27,972 (down + closing). Projections, not guarantees.
Landlord ↔ Tenant lean methodology
- Overall (STATE)
- 46 Balanced
- State Minnesota
- 46 Balanced · D+2
- County
- — inherits STATE
- City
- — inherits STATE
ZIP-level market 56473
- Home prices YoY
- -18.1%
- Active inventory
- 31
- Price-to-rent
- 6.0×
Monthly cashflow live
- Estimated rent
- $1,399 medium interval (Pro) →
- Mortgage (P&I)
- −$524
- Tax from tax record
- −$24 /mo · $294/yr
- Insurance
- −$42
- Flood insurance flood zone
- −$168 /mo · $2,020/yr
- HOA
- −$0
- Vacancy / Maint / Mgmt
- −$294
- Net cashflow
- $347
Break-even live
UW: 25.0% down · 7.5% · 30yr · 1.5% tax · 5.0% vac · 8.0% maint · 8.0% mgmt
Financing live
Cash to close
- Down payment
- $24,975
- Closing costs
- $2,997
- Reserves months
- —
- Total cash needed
- —
Loan-product check · same deal, 3 products live
Conventional
25% down · 7.5% · 30yr
- Down + closing
- —
- Monthly P&I
- —
- Monthly cashflow
- —
- DSCR
- —
- Eligible?
- —
Personal DTI + credit; lowest rate.
DSCR
20% down · 8.5% · 30yr
- Down + closing
- —
- Monthly P&I
- —
- Monthly cashflow
- —
- DSCR
- —
- Eligible?
- —
No personal income docs; deal must DSCR.
Hard money
10% down · 12.0% · 12mo
- Down + closing
- —
- Monthly P&I
- —
- Monthly cashflow
- —
- DSCR
- —
- Eligible?
- —
Short-term bridge; refi at stabilization.
Listing history 9 events
-
2026-06-12statusdays on market $99,900 Pending 12 DOM
-
2026-06-09days on market $99,900 Active 11 DOM
-
2026-06-08days on market $99,900 Active 10 DOM
-
2026-06-07days on market $99,900 Active 9 DOM
-
2026-06-03days on market $99,900 Active 5 DOM
-
2026-06-02days on market $99,900 Active 4 DOM
-
2026-06-01days on market $99,900 Active 3 DOM
-
2026-05-31days on market $99,900 Active 2 DOM
-
2026-05-29$99,900 Active
ⓘ Source: listings_history table (triggers on properties + properties_extension) + one-shot
backfill from property_details.listing_events for pre-trigger history.
Tax reassessment forecast MN · Partial reset (capped growth)
- Current annual tax
- $294 · $24/mo
- Projected year-2 tax
- $706 · $59/mo
- Expected delta
- +$412/yr (+$34/mo · 140.3%)
ⓘ Screening estimate from a state-policy table — verify with the county assessor before closing.
Climate risk First Street
- Flood 8/10 Severe FEMA zone A · 99% chance over 30 yrs
- Wildfire 2/10 Low
- Heat 1/10 Low
Nearby sold comps map
Loading sold comps map…
Walkable amenities ~0.75 mi
Loading nearby amenities…
Taxation est. · year 1
- Rental income
- $16,788
- − Mortgage interest
- −$5,596
- − Property taxes
- −$294
- − Insurance
- −$2,520
- − Repairs & maintenance
- −$1,343
- − Management
- −$1,343
- − Depreciation
- −$2,906
- Taxable income
- $2,786
- Est. tax owed @ 24.0%
- −$669
- After-tax cash flow
- $3,494/yr
For passive investors: Depreciation is non-cash, so a rental often shows a tax loss while cash-flowing — sheltering income. Rental losses are passive: they offset passive income freely, and up to $25,000/yr can offset ordinary (W-2) income if you actively participate and your MAGI is under $100k (phasing out to $0 by $150k); unused losses carry forward. On sale, claimed depreciation is recaptured at up to 25%, and gains may owe capital-gains tax (a 1031 exchange can defer both). Figures are a year-1 estimate at your 24.0% rate — not tax advice; consult a CPA.
Schools (NCES district)
- District
- Pillager Public School District
- NCES district ID
- 2728350
- Math proficiency
- 43% ▼ -3.00%
- Reading proficiency
- 51% ▼ -9.00%
- Median HH income
- $58,200
- Composite
- 41.06/100
- National rank
- #3577
- State rank
- #146 of 301 in MN
Livability — Pillager
- Score
- 61/100
- State rank
- #722
- US rank
- #17425
Category grades
Schools grade is shown separately in the Schools card above.
Census & demographics
- Population (ZIP)
- 3,452
Population outlook (Morrison County) Hauer SSP2
- Today (2025)
- 31,479 people
- By 2030
- 30,414 · -3.4%
- By 2040
- 27,935 · -11.3%
- By 2050
- 25,229 · -19.9%
- By 2075
- 20,093 · -36.2%
- By 2100
- 16,173 · -48.6%
Race, ethnicity, and origin ACS 2023
- Neighborhood character
- Predominantly White (96%)
- Race & ethnicity
- White 96% Two or more races 4%
- Common ancestry
- Portuguese 12% Romanian 4% Lithuanian 3%
- Foreign-born
- 1%
Political lean MEDSL · Morrison
- 2024 margin
- Solid R (+56.0) · D 21.2% · R 77.3% · Other 1.5%
- 2008→2024 swing
- -37.0pp toward R · 2008: -19.0pp · 2024: -56.0pp
- All cycles
- 2024: R+56.0 2020: R+53.5 2016: R+53.0 2012: R+24.0 2008: R+19.0
Not yet ingested
- Civics
- —
Market trends
- HPI YoY
- ▼ -51.65%
- Current HPI
- 233.7849
- Rent YoY
- —
- Metro
- —
- State GDP YoY
- ▲ 2.41%
- F500 in state
- 34
Industry mix (Fortune 500 HQ in MN)
| Industry | F500 HQs | Revenue |
|---|---|---|
| Healthcare | 2 | $407B |
|
||
| Retail | 2 | $150B |
|
||
| Consumer Goods | 2 | $32B |
|
||
| Industrial Machinery | 2 | $6B |
|
||
| Agriculture | 1 | $40B |
|
||
| Healthcare / Medical Devices | 1 | $32B |
|
||
Price history
1 event — show timeline
- 2026-05-29 Listed $99,900 NORTHSTARMLS as Distributed by MLS Grid
Property tax history
+6.3%/yrLatest (2025): $294 · -12.5% YoY. Source: county tax records.
Cash-flow waterfall
monthlySold comps — $/sqft
last 12 mo · ≤1 miLoading sold comps…