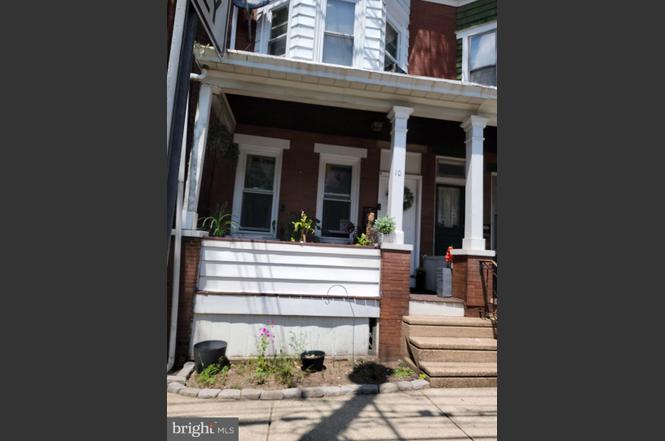
10 Cliff St · Trenton, NJ
Flood risk 6/10 · Moderate
- FEMA flood zone
- X (unshaded)
- Chance of flooding over 30 yrs
- 0.7%
- Est. flood insurance / yr
- $507 – $1,088
Fire risk 1/10 · Minimal
- Est. fire insurance / yr
- $526 – $976
Heat risk 6/10 · Moderate
- Hot days now (above 102°F)
- 7 days/yr
- Hot days in 30 yrs
- 15 days/yr
Wind risk 6/10 · Moderate
- Chance of severe wind over 30 yrs
- 27.0%
Air-quality risk 5/10 · Moderate
- Unhealthy air days now
- 6 days/yr
- Unhealthy air days in 30 yrs
- 8 days/yr
Risk factors via First Street. Map © Google.
Why this score? — see what drove the C+ grade
The composite is a weighted blend of 9 inputs, each scored 0–100. Each bar is that input's sub-score; the figure is the points it added to the 100-point composite (weight × sub-score).
- Cash flow +21.9/30.0
- ARV discount +15.0/15.0
- DSCR +7.0/10.0
- 1% rule +5.7/10.0
- Livability +3.8/5.0
- Rent growth +3.7/5.0
- Condition / age +2.5/5.0
- Schools +0.7/10.0
- Appreciation +0.0/10.0
$225,000
🖨 Deal sheet 📄 Offer letter ✓ Due diligence
Listing remarks MLS
Absolutely gorgeous! Like new construction! New roof - New bathroom - New windows - New kitchen - New carpet throughout - New electric - New plumbing - New doors - Immaculate basement - Eat in kitchen - Easy to show - Immediate occupancy - Quiet street.
Key facts
- Backyard
- Near major highways
- Built 1912
Tags
Property features AI
Exterior
- Parking: On-street parking
- Utilities: Public water; Public sewer; Natural gas hot water
- Home design: Semi-detached property; Year built per assessor
- Construction: Brick construction; Concrete perimeter foundation; Above-grade and below-grade structures
- Exterior features: Lot dimensions approximately 15.8 x 90.0
Interior
- Bedrooms: Four bedrooms on the main level
- Bathrooms: One full bathroom on the main level
- Heating & cooling: 90% forced air heating (natural gas); Wall unit cooling
- Interior features: Unfinished basement
Neighborhood map
What this means for you Summary
Snapshot
- This is a 4-bed/1.0-bath single-family listed at $225k.
Deal economics
- At list price, monthly cash flow is $356 ($4k/yr) — positive.
- The deal already cash-flows at list — no discount required.
- Meets the 1% rule at list price ($2k rent vs $225k).
- Recommended offer: $212k (6.0% below list) — sets the bar for market timing.
- Cap rate 8.2% vs local median 6.3% in Trenton — meaningfully above typical; check what's discounted (condition, days-on-market, listing class) to confirm the premium yield is real.
Location & tenants
- Location reads 76/100 on livability (#133 in NJ, #3,533 nationally) — a middle-class / working-renter tenant base. Strengths: amenities A+, commute A+, health & safety A+; Watch: schools F, crime F, employment F.
- Trenton Public School District (urban): math 2% / reading 16% proficiency, ranked #471 of 472 in NJ (top 100%) — low school quality limits family demand, transient renter base, plan for 1-2y turnover; 80% free/reduced lunch — lower-income household profile, screen leases tightly.
- Market conditions: Rents rising fast (+4.7%/yr); 84 active listings in the ZIP; 12 comparable units currently listed for rent nearby; rentals leasing fast (median 14d on market — plan ~1-2 weeks tenant-placement turnaround); 2,256 units permitted in Mercer County in 2024 (1,303 in 5+ unit buildings).
- At $2,401/mo this rent would consume 51% of the median local household income ($57k/yr) (locally 2147% of renters already pay >50% of income on rent) — very limited rent-growth headroom before tenants either downsize or default.
Forward outlook
- Local home prices are declining (-3.0%/yr); year-one equity from $2k of loan paydown is wiped out by about $7k of value loss. Plan a longer hold.
- Mercer County population projected at +4% by 2050 — modest demand growth; plan on rents tracking national, not racing it.
Negotiation context
- It's been on market 86 days — a 6% lower offer ($212k) is reasonable based on typical stale-listing flexibility.
- 3 sale attempts since 22y ago with the ask held roughly flat each time — persistent listings suggest the price (not the market) is what's stuck; bring a comps-based counter.
- Current owner paid $107k; list at $225k implies a 110% gain — meaningful room to come down on a strong offer.
Risks & watch-outs
- Watch-outs: built in 1912 — expect roof / HVAC / electrical / plumbing capex.
- Climate carrying-cost: major flood risk; major wind risk, 27% chance of damaging wind over 30y; extreme-heat days projected 7→15/yr by 2055 (HVAC capex compounding) — expect insurance premiums to compound above CPI over the hold.
Questions for the listing agent
- It's been on market 86 days. Have you received any prior offers? Is the seller open to a 6% concession, seller financing, or rate buy-down credit?
- Built in 1912 — when were the roof, HVAC, electrical panel, plumbing, and water heater last replaced?
- Why hasn't it sold? Are there any deal-killer items the seller is aware of (foundation, flood, title, zoning, code violations)?
- Is there a deadline driving the sale (1031 exchange, divorce, estate, relocation)? That informs how much negotiation room exists.
- Schools are F-rated, which usually means shorter tenancies and higher turnover. Who's the typical renter profile here, and what's been the actual vacancy rate?
- Crime grade is F in this area — have there been break-ins, vandalism, or insurance claims at this property in the last 3 years? What carrier currently insures it and at what premium?
- What's the average days-on-market for RENTAL listings here right now (not sales)? A rising rental-DOM trend means longer vacancies and softer asking-rent achievability than the comps imply.
- What's the recent tenant-quality profile in this submarket — average credit score on applications, eviction rate, late-payment / NSF rate, and stable-employment percentage? A property-management company in the area should have these aggregated.
- How much new for-sale + rental construction is in the pipeline within 1–3 miles? Heavy new supply typically softens prices + rents 12–24 months out; constrained supply supports both.
Investment metrics
- 1% rule
- 1.07% ✓
- Cap rate
- 8.19%
- Cash-on-cash
- 6.78%
- DSCR
- 1.30
- GRM
- 7.8
CMA / ARV
- ARV (on-the-fly)
- $328,874
- Comps found
- 12
Show comp detail 12 sales within ~0.75 mi
| Address | Dist | Beds/Ba | Sqft | Sold | Price | $/sf | Match |
|---|---|---|---|---|---|---|---|
| 807 S Broad St | 0.61mi | 4/1.0 | 1,200 (+1%) | 15mo | $150,000 | $125 | 56 |
| 29 3rd St | 0.61mi | 4/2.5 | 1,260 (+6%) | 0mo | $360,000 | $286 | 54 |
| 10 Bowling Green Ave | 0.65mi | 3/2.0 (-1) | 1,224 (+4%) | 1mo | $335,000 | $274 | 54 |
| 3 Jessie Ave | 0.62mi | 3/2.0 (-1) | 1,126 (-5%) | 6mo | $349,900 | $311 | 48 |
| 1236 S Pennsylvania Ave | 0.65mi | 3/2.0 (-1) | 1,097 (-7%) | 2mo | $360,000 | $328 | 47 |
| 44 Jeremiah Ave | 0.72mi | 3/1.0 (-1) | 1,108 (-6%) | 7mo | $325,000 | $293 | 45 |
| 641 Lamberton St | 0.50mi | 3/1.5 (-1) | 1,302 (+10%) | 12mo | $215,000 | $165 | 42 |
| 67 Jersey St | 0.42mi | 3/2.0 (-1) | 1,316 (+11%) | 12mo | $195,000 | $148 | 42 |
| 842 S Pennsylvania Ave | 0.73mi | 3/1.0 (-1) | 1,152 (-3%) | 19mo | $320,000 | $278 | 41 |
| 55 Jeremiah Ave | 0.70mi | 3/1.0 (-1) | 1,108 (-6%) | 15mo | $302,000 | $273 | 39 |
| 412 Home Ave | 0.53mi | 3/2.0 (-1) | 1,340 (+13%) | 9mo | $205,000 | $153 | 37 |
| 317 Hewitt Ave | 0.50mi | 3/2.0 (-1) | 1,357 (+15%) | 9mo | $400,000 | $295 | 36 |
Match score weights: distance 35% · size 25% · config 20% · recency 20%. Top-matched comps best support the ARV.
Projected returns pro-forma
-3.0% appreciation · 4.71% rent growth · sell at horizon
- IRR
- -4.0%
- Equity multiple
- 0.85×
- Total profit
- $-9,549
- Equity at exit
- $33,548
- IRR
- 7.6%
- Equity multiple
- 1.62×
- Total profit
- $38,857
- Equity at exit
- $19,454
Cash invested: $63,000 (down + closing). Projections, not guarantees.
Landlord ↔ Tenant lean methodology
- Overall (STATE)
- 21 Tenant-Leaning
- State New Jersey
- 21 Tenant-Leaning · D+6
- County
- — inherits STATE
- City
- — inherits STATE
ZIP-level market 08611
- Rents YoY
- 4.7%
- Active inventory
- 84
- Price-to-rent
- 7.8×
Monthly cashflow live
- Estimated rent
- $2,401 high interval (Pro) →
- Mortgage (P&I)
- −$1,180
- Tax from tax record
- −$267 /mo · $3,204/yr
- Insurance
- −$94
- HOA
- −$0
- Vacancy / Maint / Mgmt
- −$504
- Net cashflow
- $356
Break-even live
UW: 25.0% down · 7.5% · 30yr · 1.5% tax · 5.0% vac · 8.0% maint · 8.0% mgmt
Financing live
Cash to close
- Down payment
- $56,250
- Closing costs
- $6,750
- Reserves months
- —
- Total cash needed
- —
Loan-product check · same deal, 3 products live
Conventional
25% down · 7.5% · 30yr
- Down + closing
- —
- Monthly P&I
- —
- Monthly cashflow
- —
- DSCR
- —
- Eligible?
- —
Personal DTI + credit; lowest rate.
DSCR
20% down · 8.5% · 30yr
- Down + closing
- —
- Monthly P&I
- —
- Monthly cashflow
- —
- DSCR
- —
- Eligible?
- —
No personal income docs; deal must DSCR.
Hard money
10% down · 12.0% · 12mo
- Down + closing
- —
- Monthly P&I
- —
- Monthly cashflow
- —
- DSCR
- —
- Eligible?
- —
Short-term bridge; refi at stabilization.
Rent comps 12 comps
| Address | Beds | Baths | Sqft | Rent | $/sqft | DOM | Units | Dist |
|---|---|---|---|---|---|---|---|---|
| 547 Centre St Trenton, NJ | 3.0 | 1.0 | 1060 | $1,850 | $1.75 | 21d | 1 | 0.28mi |
| 244 Jersey St Trenton, NJ | 3.0 | 1.5 | 1368 | $2,300 | $1.68 | 13d | 1 | 0.40mi |
| 313 Home Ave Trenton, NJ | 3.0 | 1.0 | 1112 | $2,100 | $1.89 | 13d | 1 | 0.54mi |
| 233 Virginia Ave Trenton, NJ | 3.0 | 1.0 | 1302 | $2,500 | $1.92 | 12d | 1 | 0.76mi |
| 1103 Division St Trenton, NJ | 4.0 | 1.0 | 1296 | $2,000 | $1.54 | 21d | 1 | 0.80mi |
| 705 Anderson St Trenton, NJ | 3.0 | 1.0 | 1132 | $1,800 | $1.59 | 13d | 1 | 1.00mi |
| 1049 Genesee St Trenton, NJ | 3.0 | 1.0 | 1270 | $2,300 | $1.81 | 21d | 1 | 1.06mi |
| 1132 Genesee St Unit 1132 Trenton, NJ | 3.0 | 1.0 | 1198 | $2,500 | $2.09 | 21d | 1 | 1.12mi |
| 117 Park Ave Morrisville, PA | 3.0 | 2.0 | 1396 | $3,200 | $2.29 | 12d | 1 | 1.18mi |
| 130 Harper Ave Morrisville, PA | 3.0 | 2.5 | 1276 | $3,500 | $2.74 | 12d | 1 | 1.25mi |
| 635 Chambers St Trenton, NJ | 4.0 | 2.0 | 1312 | $2,500 | $1.91 | 13d | 1 | 1.39mi |
| 121 Columbus Ave Trenton, NJ | 3.0 | 1.0 | 1050 | $1,900 | $1.81 | 21d | 1 | 1.49mi |
Listing history 21 events
-
2026-06-18days on market $225,000 Active 86 DOM
-
2026-06-17days on market $225,000 Active 85 DOM
-
2026-06-16days on market $225,000 Active 84 DOM
-
2026-06-15days on market $225,000 Active 83 DOM
-
2026-06-14days on market $225,000 Active 81 DOM
-
2026-06-10days on market $225,000 Active 78 DOM
-
2026-06-09days on market $225,000 Active 77 DOM
-
2026-06-08days on market $225,000 Active 76 DOM
-
2026-06-07days on market $225,000 Active 75 DOM
-
2026-06-03days on market $225,000 Active 71 DOM
-
2026-06-02days on market $225,000 Active 70 DOM
-
2026-06-01days on market $225,000 Active 69 DOM
-
2026-05-31days on market $225,000 Active 68 DOM
-
2026-05-30days on market $225,000 Active 67 DOM
-
2026-03-30status Active
-
2025-09-25status Pending
-
2025-09-19$225,000 Active
-
2005-02-22soldstatus $107,000
-
2005-01-20soldstatus $107,000 253-char remark
Show marketing remark (253 chars)
Absolutely gorgeous! Like new construction! New roof - New bathroom - New windows - New kitchen - New carpet throughout - New electric - New plumbing - New doors - Immaculate basement - Eat in kitchen - Easy to show - Immediate occupancy - Quiet street.
-
2004-12-13historical 253-char remark
Show marketing remark (253 chars)
Absolutely gorgeous! Like new construction! New roof - New bathroom - New windows - New kitchen - New carpet throughout - New electric - New plumbing - New doors - Immaculate basement - Eat in kitchen - Easy to show - Immediate occupancy - Quiet street.
-
2004-11-23$107,000 253-char remark
Show marketing remark (253 chars)
Absolutely gorgeous! Like new construction! New roof - New bathroom - New windows - New kitchen - New carpet throughout - New electric - New plumbing - New doors - Immaculate basement - Eat in kitchen - Easy to show - Immediate occupancy - Quiet street.
ⓘ Source: listings_history table (triggers on properties + properties_extension) + one-shot
backfill from property_details.listing_events for pre-trigger history.
Tax reassessment forecast NJ · Partial reset (capped growth)
- Current annual tax
- $3,204 · $267/mo
- Projected year-2 tax
- $4,403 · $367/mo
- Expected delta
- +$1,199/yr (+$100/mo · 37.4%)
ⓘ Screening estimate from a state-policy table — verify with the county assessor before closing.
Climate risk First Street
- Flood 6/10 Major FEMA zone X (unshaded) · 70% chance over 30 yrs
- Wildfire 1/10 Low
- Heat 6/10 Major 7 d/yr ≥102°F today · 15 d/yr by 30 yrs out
- Wind 6/10 Major 27% chance of damaging wind over 30 yrs
- Air quality 5/10 Major 6 unhealthy d/yr today · 8 by 30 yrs out
Nearby sold comps map
Loading sold comps map…
Walkable amenities ~0.75 mi
Loading nearby amenities…
Taxation est. · year 1
- Rental income
- $28,812
- − Mortgage interest
- −$12,603
- − Property taxes
- −$3,204
- − Insurance
- −$1,125
- − Repairs & maintenance
- −$2,305
- − Management
- −$2,305
- − Depreciation
- −$6,545
- Taxable income
- $724
- Est. tax owed @ 24.0%
- −$174
- After-tax cash flow
- $4,100/yr
For passive investors: Depreciation is non-cash, so a rental often shows a tax loss while cash-flowing — sheltering income. Rental losses are passive: they offset passive income freely, and up to $25,000/yr can offset ordinary (W-2) income if you actively participate and your MAGI is under $100k (phasing out to $0 by $150k); unused losses carry forward. On sale, claimed depreciation is recaptured at up to 25%, and gains may owe capital-gains tax (a 1031 exchange can defer both). Figures are a year-1 estimate at your 24.0% rate — not tax advice; consult a CPA.
Schools (NCES district)
- District
- Trenton Public School District
- NCES district ID
- 3416290
- Math proficiency
- 2% ▼ -8.00%
- Reading proficiency
- 16% ▼ -4.00%
- Median HH income
- $35,078
- Composite
- 7.31/100
- National rank
- #9956
- State rank
- #471 of 472 in NJ
Livability — Trenton
- Score
- 76/100
- State rank
- #133
- US rank
- #3533
Category grades
Schools grade is shown separately in the Schools card above.
Census & demographics
- Census place
- Trenton, NJ
- County
- Mercer County · 327,655 people
- City population
- 177,819
- Metro
- Trenton-Princeton, NJ
- Population (ZIP)
- 31,995
- Household income
- $56,788
- Rent vs Own
- Severe rent burden
- 2147.0
Population outlook (Mercer County) Hauer SSP2
- Today (2025)
- 381,395 people
- By 2030
- 384,640 · +0.9%
- By 2040
- 391,431 · +2.6%
- By 2050
- 397,845 · +4.3%
- By 2075
- 417,281 · +9.4%
- By 2100
- 420,327 · +10.2%
Race, ethnicity, and origin ACS 2023
- Neighborhood character
- Diverse neighborhood (Simpson 0.56)
- Race & ethnicity
- Hispanic / Latino 62% Black 20% Two or more races 18% White 14% Native American 4%
- Hispanic origin (detail)
- Mexican 2% Puerto Rican 12% Dominican 8%
- Common ancestry
- Romanian 2% Swiss 1% Hispanic 1%
- Foreign-born
- 37% · Canada, Jamaica, Guatemala
- Languages at home
- 41% English-only · Spanish 57% French/Haitian/Cajun 2%
Political lean MEDSL · Mercer
- 2024 margin
- Solid D (+33.9) · D 65.9% · R 32.0% · Other 2.1%
- 2008→2024 swing
- -2.2pp toward R · 2008: 36.1pp · 2024: 33.9pp
- All cycles
- 2024: D+33.9 2020: D+40.0 2016: D+36.2 2012: D+36.8 2008: D+36.1
Not yet ingested
- Civics
- —
Market trends
- HPI YoY
- ▼ -267.62%
- Current HPI
- 276.5427
- Rent YoY
- ▲ 4.71%
- Metro
- Trenton-Princeton, NJ
- State GDP YoY
- ▲ 2.05%
- F500 in state
- 34
Industry mix (Fortune 500 HQ in NJ)
| Industry | F500 HQs | Revenue |
|---|---|---|
| Consumer Goods | 3 | $31B |
|
||
| Pharmaceuticals | 2 | $153B |
|
||
| Technology | 2 | $21B |
|
||
| Insurance | 2 | $20B |
|
||
| Healthcare | 2 | $19B |
|
||
| Financial Services | 1 | $70B |
|
||
Price history
+110.3% since first listed7 events — show timeline
- 2026-03-30 Relisted — BRIGHT MLS
- 2025-09-25 Pending — BRIGHT MLS
- 2025-09-19 Listed $225,000 BRIGHT MLS
- 2005-02-22 Sold (Public Records) $107,000 Public Records
- 2005-01-20 Sold (MLS) $107,000 BRIGHT MLS
- 2004-12-13 Listing Removed — BRIGHT MLS
- 2004-11-23 Listed $107,000 BRIGHT MLS
Property tax history
+0.7%/yrLatest (2025): $3,204 · +1.5% YoY. Source: county tax records.
Cash-flow waterfall
monthlySold comps — $/sqft
last 12 mo · ≤1 miLoading sold comps…