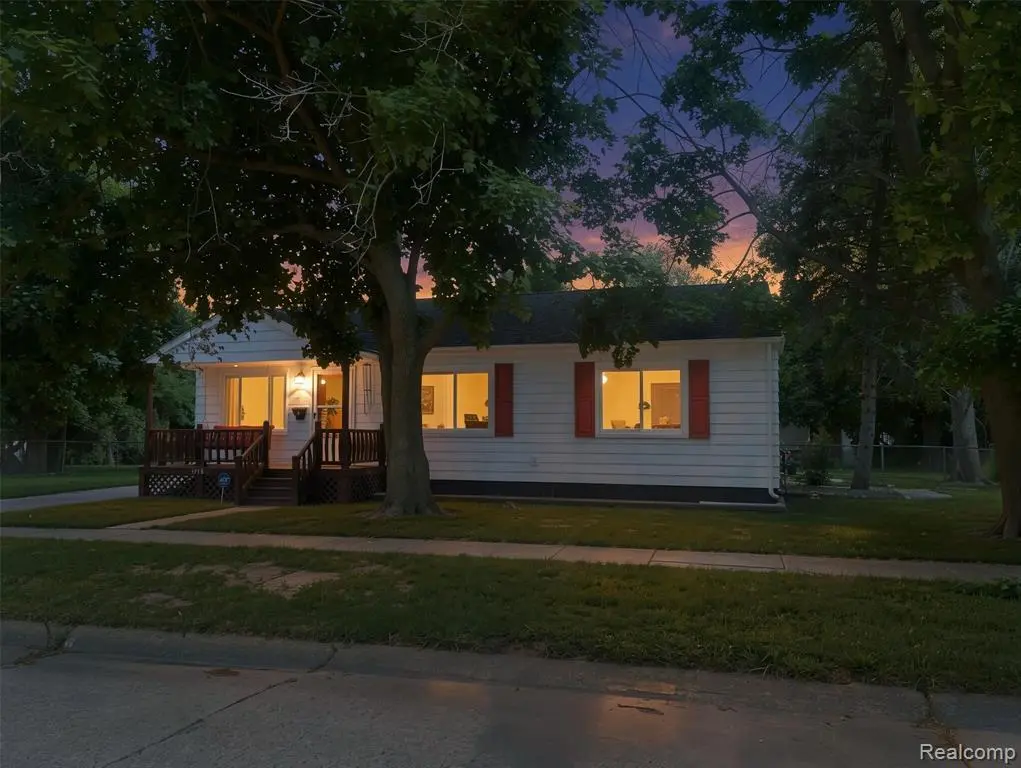
3918 Whitney Ave · Flint, MI
Flood risk 1/10 · Minimal
- FEMA flood zone
- X (unshaded)
- Chance of flooding over 30 yrs
- 0.0%
- Est. flood insurance / yr
- $507 – $1,088
Fire risk 1/10 · Minimal
- Est. fire insurance / yr
- $784 – $1,456
Heat risk 2/10 · Minimal
- Hot days now (above 96°F)
- 7 days/yr
- Hot days in 30 yrs
- 15 days/yr
Wind risk 2/10 · Minimal
- Chance of severe wind over 30 yrs
- —
Air-quality risk 3/10 · Minor
- Unhealthy air days now
- 3 days/yr
- Unhealthy air days in 30 yrs
- 4 days/yr
Risk factors via First Street. Map © Google.
Why this score? — see what drove the C grade
The composite is a weighted blend of 9 inputs, each scored 0–100. Each bar is that input's sub-score; the figure is the points it added to the 100-point composite (weight × sub-score).
- Cash flow +30.0/30.0
- 1% rule +10.0/10.0
- DSCR +10.0/10.0
- Livability +3.7/5.0
- Rent growth +2.5/5.0
- Condition / age +2.5/5.0
- Schools +1.1/10.0
- ARV discount +0.0/15.0
- Appreciation +0.0/10.0
$59,900
🖨 Deal sheet (PDF) 📄 Offer letter ✓ Due diligence
Listing remarks
Charming & Well-Maintained Ranch with Endless Potential! Welcome home to this well-maintained 2-bedroom ranch featuring an inviting open floor plan that creates a spacious and comfortable living environment. The main bedroom offers a sliding glass door leading directly to the backyard, providing easy access to your outdoor retreat. Relax and unwind on the covered front porch, complete with a swing, perfect for enjoying your morning coffee or evening sunsets. The huge yard offers plenty of room for entertaining, gardening, or simply enjoying the outdoors. An oversized garage with a carport/lean-to provides ample space for vehicles, hobbies, storage, or a workshop. With central air and
Key facts
- Covered front porch
- Huge yard
- Open floor plan
Tags
Property features AI
Exterior
- Parking: Carport; Detached garage with garage door opener; Approximately 1.5 garage parking spaces
- Utilities: Public water; Public sewer (standard municipal service implied); Electric service (standard power implied)
- Home design: Residential 1-story home; Built in 1952; Entry-level main living
- Construction: Crawl-space foundation
- Exterior features: Aluminum exterior; Deck; Fenced yard; Porch; Paved street frontage
Interior
- Kitchen: Entry-level kitchen (approx. 10 x 10); Dishwasher; Range/Oven; Refrigerator
- Bedrooms: Two bedrooms located on the entry level (approx. 15 x 20 and 10 x 10)
- Bathrooms: One full bathroom on the entry level
- Heating & cooling: Forced air heating; Natural gas heating fuel; Central A/C; Ceiling fan(s); Gas water heater
- Interior features: 6 total rooms; Entry-level living areas
- Laundry & utility: Entry-level laundry room (approx. 8 x 8); Washer; Dryer
Neighborhood map
What this means for you Summary
Snapshot
- This is a 2-bed/1.0-bath single-family listed at $60k.
Deal economics
- At list price, monthly cash flow is $437 ($5k/yr) — positive.
- The deal already cash-flows at list — no discount required.
- Meets the 1% rule at list price ($1k rent vs $60k).
- Cap rate 15.0% vs local median 11.5% in Flint — top-decile yield for the area; either an underpriced asset or a hidden risk that comps aren't pricing in. Stress-test before assuming the spread holds.
Location & tenants
- Location reads 74/100 on livability (#196 in MI, #4,946 nationally) — a middle-class / working-renter tenant base. Strengths: commute A+, cost of living A+, housing A+; Watch: schools F, crime F, employment F.
- Flint School District (urban): math 7% / reading 13% proficiency, ranked #714 of 760 in MI (top 94%) — low school quality limits family demand, transient renter base, plan for 1-2y turnover; 83% free/reduced lunch — lower-income household profile, screen leases tightly.
- Market conditions: 123 active listings in the ZIP; 10 comparable units currently listed for rent nearby; rentals at typical pace (median 22d on market — plan ~3-4 weeks tenant-placement turnaround); 419 units permitted in Genesee County in 2024 (68 in 5+ unit buildings).
Forward outlook
- Local home prices are declining (-3.0%/yr); year-one equity from $414 of loan paydown is wiped out by about $2k of value loss. Plan a longer hold.
- Genesee County population projected at -27% by 2050 — secular population decline; favor cash flow + early exit over multi-decade hold.
- At projected returns (-3.0% appreciation + 3.0% rent growth), your $17k cash investment doubles in ~4 years — after that, you're playing with house money.
Negotiation context
- Only 7 days on market — expect competitive offers; lowballing is unlikely to land.
Risks & watch-outs
- Watch-outs: built in 1952 — expect roof / HVAC / electrical / plumbing capex.
Questions for the listing agent
- Built in 1952 — when were the roof, HVAC, electrical panel, plumbing, and water heater last replaced?
- Is there a deadline driving the sale (1031 exchange, divorce, estate, relocation)? That informs how much negotiation room exists.
- Schools are F-rated, which usually means shorter tenancies and higher turnover. Who's the typical renter profile here, and what's been the actual vacancy rate?
- Crime grade is F in this area — have there been break-ins, vandalism, or insurance claims at this property in the last 3 years? What carrier currently insures it and at what premium?
- What's the average days-on-market for RENTAL listings here right now (not sales)? A rising rental-DOM trend means longer vacancies and softer asking-rent achievability than the comps imply.
- What's the recent tenant-quality profile in this submarket — average credit score on applications, eviction rate, late-payment / NSF rate, and stable-employment percentage? A property-management company in the area should have these aggregated.
- How much new for-sale + rental construction is in the pipeline within 1–3 miles? Heavy new supply typically softens prices + rents 12–24 months out; constrained supply supports both.
Investment metrics
- 1% rule
- 1.85% ✓
- Cap rate
- 15.05%
- Cash-on-cash
- 31.26%
- DSCR
- 2.39
- GRM
- 4.5
CMA / ARV
- ARV (on-the-fly)
- $43,760
- Comps found
- 12
Show comp detail 12 sales within ~0.75 mi
| Address | Dist | Beds/Ba | Sqft | Sold | Price | $/sf | Match |
|---|---|---|---|---|---|---|---|
| 3522 Whitney Ave | 0.22mi | 3/1.5 (+1) | 1,100 (+0%) | 8mo | $41,500 | $38 | 76 |
| 3722 Larchmont St | 0.25mi | 3/1.0 (+1) | 1,128 (+3%) | 4mo | $47,000 | $42 | 75 |
| 3801 Augusta St | 0.12mi | 2/1.0 | 949 (-13%) | 3mo | $63,000 | $66 | 70 |
| 874 Tacken St | 0.51mi | 3/1.0 (+1) | 1,126 (+3%) | 3mo | $30,000 | $27 | 64 |
| 1205 Stocker Ave | 0.43mi | 3/1.5 (+1) | 1,024 (-6%) | 5mo | $55,000 | $54 | 58 |
| 3926 W Court St | 0.49mi | 3/1.0 (+1) | 1,150 (+5%) | 7mo | $30,000 | $26 | 57 |
| 1114 Clancy Ave | 0.63mi | 2/1.0 | 1,009 (-8%) | 3mo | $36,000 | $36 | 55 |
| 1010 Hughes Ave | 0.55mi | 2/1.0 | 996 (-9%) | 6mo | $50,000 | $50 | 54 |
| 3018 Fielding St | 0.55mi | 3/1.0 (+1) | 993 (-9%) | 1mo | $21,000 | $21 | 53 |
| 1600 Houran St | 0.34mi | 3/1.0 (+1) | 941 (-14%) | 7mo | $85,000 | $90 | 50 |
| 1202 Hughes Ave | 0.51mi | 2/1.0 | 950 (-13%) | 6mo | $20,000 | $21 | 50 |
| 1202 Knapp Ave | 0.46mi | 3/1.0 (+1) | 1,255 (+15%) | 3mo | $49,900 | $40 | 46 |
Match score weights: distance 35% · size 25% · config 20% · recency 20%. Top-matched comps best support the ARV.
Projected returns pro-forma
-3.0% appreciation · 3.0% rent growth · sell at horizon
- IRR
- 26.1%
- Equity multiple
- 2.08×
- Total profit
- $18,152
- Equity at exit
- $8,931
- IRR
- 33.8%
- Equity multiple
- 4.09×
- Total profit
- $51,767
- Equity at exit
- $5,179
Cash invested: $16,772 (down + closing). Projections, not guarantees.
Landlord ↔ Tenant lean methodology
- Overall (STATE)
- 62 Landlord-Friendly
- State Michigan
- 62 Landlord-Friendly · EVEN
- County
- — inherits STATE
- City
- — inherits STATE
ZIP-level market 48532
- Home prices YoY
- -28.9%
- Active inventory
- 123
- Price-to-rent
- 4.5×
Monthly cashflow live
- Estimated rent
- $1,108 high interval (Pro) →
- Mortgage (P&I)
- −$314
- Tax from tax record
- −$100 /mo · $1,195/yr
- Insurance
- −$25
- HOA
- −$0
- Vacancy / Maint / Mgmt
- −$233
- Net cashflow
- $437
Break-even live
Sensitivity live
| Price | -10% $471 | -5% $454 | +0% $437 | +5% $420 | +10% $403 |
|---|---|---|---|---|---|
| Rent | -10% $349 | -5% $393 | +0% $437 | +5% $481 | +10% $524 |
| Rate | -1.0pp $467 | -0.5pp $452 | base $437 | +0.5pp $421 | +1.0pp $406 |
UW: 25.0% down · 7.5% · 30yr · 1.5% tax · 5.0% vac · 8.0% maint · 8.0% mgmt
Financing live
Cash to close
- Down payment
- $14,975
- Closing costs
- $1,797
- Reserves months
- —
- Total cash needed
- —
Loan-product check · same deal, 3 products live
Conventional
25% down · 7.5% · 30yr
- Down + closing
- —
- Monthly P&I
- —
- Monthly cashflow
- —
- DSCR
- —
- Eligible?
- —
Personal DTI + credit; lowest rate.
DSCR
20% down · 8.5% · 30yr
- Down + closing
- —
- Monthly P&I
- —
- Monthly cashflow
- —
- DSCR
- —
- Eligible?
- —
No personal income docs; deal must DSCR.
Hard money
10% down · 12.0% · 12mo
- Down + closing
- —
- Monthly P&I
- —
- Monthly cashflow
- —
- DSCR
- —
- Eligible?
- —
Short-term bridge; refi at stabilization.
Rent comps 10 comps
| Address | Beds | Baths | Sqft | Rent | $/sqft | DOM | Units | Dist |
|---|---|---|---|---|---|---|---|---|
| 3701 Whitney Ave Flint, MI | 2.0 | 1.0 | 850 | $900 | $1.06 | 14d | 1 | 0.12mi |
| 3901 Herrick St Flint, MI | 3.0 | 1.5 | 1100 | $1,300 | $1.18 | 14d | 1 | 0.14mi |
| 3929 Larchmont St Flint, MI | 2.0 | 1.0 | 900 | $1,100 | $1.22 | 14d | 1 | 0.25mi |
| 806 Barney Ave Flint, MI | 2.0 | 1.0 | 1000 | $1,000 | $1.00 | 22d | 1 | 0.58mi |
| 2198 Utley Rd Flint, MI | 3.0 | 2.0 | 1400 | $1,400 | $1.00 | 44d | 1 | 0.61mi |
| 1410 Bradley Ave Flint, MI | 3.0 | 1.5 | 1160 | $995 | $0.86 | 22d | 1 | 0.75mi |
| 2610 Swayze St Flint, MI | 3.0 | 1.5 | 1194 | $950 | $0.80 | 22d | 1 | 0.81mi |
| 314 Sheffield Ave Flint, MI | 2.0 | 1.0 | 896 | $1,250 | $1.40 | 22d | 1 | 1.03mi |
| 2428 Norbert St Flint, MI | 3.0 | 1.0 | 1200 | $1,250 | $1.04 | 22d | 1 | 1.38mi |
| 2544 Tyrone St Flint, MI | 2.0 | 1.0 | 1440 | $825 | $0.57 | 14d | 1 | 1.47mi |
Listing history 8 events
-
2026-06-21pricedays on market $59,900 Active 7 DOM
-
2026-06-18days on market $64,900 Active 4 DOM
-
2026-06-17days on market $64,900 Active 3 DOM
-
2026-06-16days on market $64,900 Active 2 DOM
-
2026-06-15days on market $64,900 Active 1 DOM
-
2026-06-15days on market $64,900 Active 2 DOM
-
2026-06-14remarks 695-char remark
-
2026-06-14$64,900 Active 1 DOM
ⓘ Source: listings_history table (triggers on properties + properties_extension) + one-shot
backfill from property_details.listing_events for pre-trigger history.
Tax reassessment forecast MI · Partial reset (capped growth)
- Current annual tax
- $1,195 · $100/mo
- Projected year-2 tax
- $1,195 · $100/mo
- Expected delta
- $0/yr ($0/mo · 0.0%)
ⓘ Screening estimate from a state-policy table — verify with the county assessor before closing.
Climate risk First Street
- Flood 1/10 Low FEMA zone X (unshaded) · 0% chance over 30 yrs
- Wildfire 1/10 Low
- Heat 2/10 Low 7 d/yr ≥96°F today · 15 d/yr by 30 yrs out
- Wind 2/10 Low
- Air quality 3/10 Moderate 3 unhealthy d/yr today · 4 by 30 yrs out
Nearby sold comps map
Loading sold comps map…
Walkable amenities ~0.75 mi
Loading nearby amenities…
Taxation est. · year 1
- Rental income
- $13,300
- − Mortgage interest
- −$3,355
- − Property taxes
- −$1,195
- − Insurance
- −$300
- − Repairs & maintenance
- −$1,064
- − Management
- −$1,064
- − Depreciation
- −$1,743
- Taxable income
- $4,579
- Est. tax owed @ 24.0%
- −$1,099
- After-tax cash flow
- $4,144/yr
For passive investors: Depreciation is non-cash, so a rental often shows a tax loss while cash-flowing — sheltering income. Rental losses are passive: they offset passive income freely, and up to $25,000/yr can offset ordinary (W-2) income if you actively participate and your MAGI is under $100k (phasing out to $0 by $150k); unused losses carry forward. On sale, claimed depreciation is recaptured at up to 25%, and gains may owe capital-gains tax (a 1031 exchange can defer both). Figures are a year-1 estimate at your 24.0% rate — not tax advice; consult a CPA.
Schools (NCES district)
- District
- Flint School District
- NCES district ID
- 2614520
- Math proficiency
- 7% ▬ 0.00%
- Reading proficiency
- 13% ▲ 3.00%
- Median HH income
- $25,954
- Composite
- 10.97/100
- National rank
- #14642
- State rank
- #714 of 760 in MI
Livability — Flint
- Score
- 74/100
- State rank
- #196
- US rank
- #4946
Category grades
Schools grade is shown separately in the Schools card above.
Census & demographics
- Census place
- Flint, MI
- City population
- 93,814
- Population (ZIP)
- 19,750
Population outlook (Genesee County) Hauer SSP2
- Today (2025)
- 381,312 people
- By 2030
- 362,731 · -4.9%
- By 2040
- 321,550 · -15.7%
- By 2050
- 279,212 · -26.8%
- By 2075
- 193,336 · -49.3%
- By 2100
- 128,118 · -66.4%
Race, ethnicity, and origin ACS 2023
- Neighborhood character
- Diverse neighborhood (Simpson 0.59)
- Race & ethnicity
- White 51% Black 38% Two or more races 7% Hispanic / Latino 4%
- Common ancestry
- Romanian 4% Lithuanian 1% Italian 1%
- Foreign-born
- 4% · Canada
- Languages at home
- 94% English-only · Arabic 3% Spanish 1%
Political lean MEDSL · Genesee
- 2024 margin
- Toss-up / Even · D 51.4% · R 47.2% · Other 1.4%
- 2008→2024 swing
- -28.3pp toward R · 2008: 32.5pp · 2024: 4.2pp
- All cycles
- 2024: D+4.2 2020: D+9.3 2016: D+9.5 2012: D+28.2 2008: D+32.5
Not yet ingested
- Civics
- —
Market trends
- HPI YoY
- ▼ -82.08%
- Current HPI
- 202.407
- Rent YoY
- —
- Metro
- —
- State GDP YoY
- ▲ 1.37%
- F500 in state
- 28
Industry mix (Fortune 500 HQ in MI)
| Industry | F500 HQs | Revenue |
|---|---|---|
| Automotive Parts | 3 | $48B |
|
||
| Automotive | 2 | $372B |
|
||
| Chemicals | 1 | $45B |
|
||
| Automotive Retail | 1 | $29B |
|
||
| Healthcare / Medical Devices | 1 | $23B |
|
||
| Automotive Technology | 1 | $20B |
|
||
Price history
1 event — show timeline
- 2026-06-13 Listed $64,900 MiRealSource-MiMLS
Property tax history
+2.6%/yrLatest (2025): $1,195 · +1.7% YoY. Source: county tax records.
Cash-flow waterfall
monthlySold comps — $/sqft
last 12 mo · ≤1 miLoading sold comps…