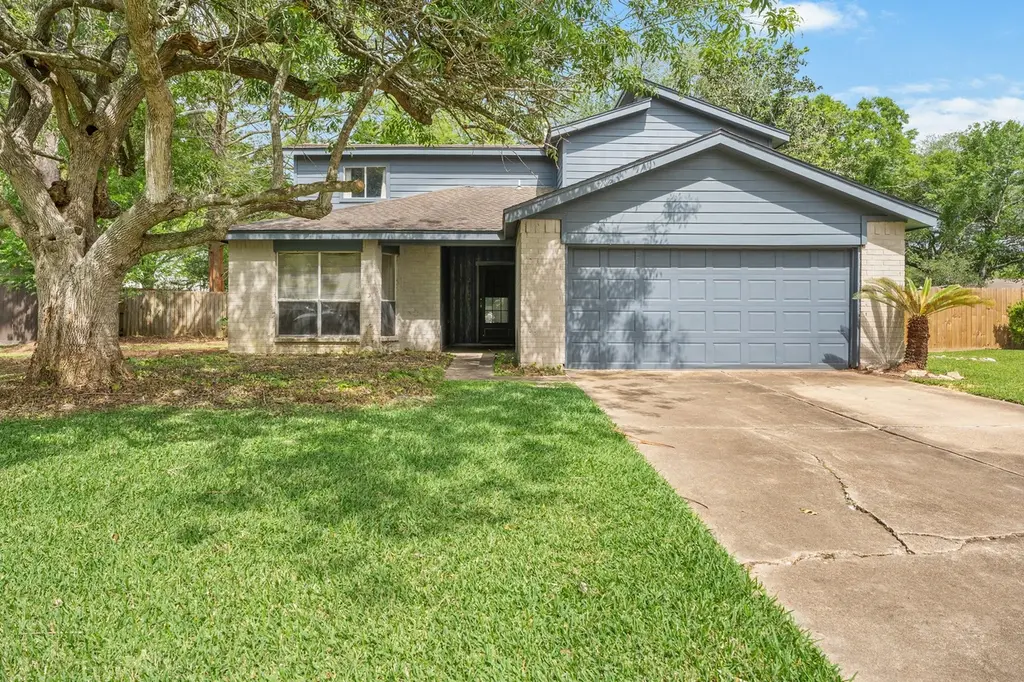
902 Essex Dr · Friendswood, TX
Flood risk 3/10 · Minor
- FEMA flood zone
- X (unshaded)
- Chance of flooding over 30 yrs
- 0.2%
- Est. flood insurance / yr
- $507 – $1,088
Fire risk 1/10 · Minimal
- Est. fire insurance / yr
- $1,222 – $2,270
Heat risk 9/10 · Severe
- Hot days now (above 107°F)
- 6 days/yr
- Hot days in 30 yrs
- 22 days/yr
Wind risk 9/10 · Severe
- Chance of severe wind over 30 yrs
- 99.0%
Air-quality risk 2/10 · Minimal
- Unhealthy air days now
- 1 days/yr
- Unhealthy air days in 30 yrs
- 1 days/yr
Risk factors via First Street. Map © Google.
Why this score? — see what drove the C- grade
The composite is a weighted blend of 9 inputs, each scored 0–100. Each bar is that input's sub-score; the figure is the points it added to the 100-point composite (weight × sub-score).
- ARV discount +15.0/15.0
- Cash flow +11.7/30.0
- Schools +6.1/10.0
- 1% rule +4.9/10.0
- DSCR +3.5/10.0
- Livability +3.5/5.0
- Rent growth +3.2/5.0
- Condition / age +2.5/5.0
- Appreciation +0.0/10.0
$272,000
🖨 Deal sheet (PDF) 📄 Offer letter ✓ Due diligence
Listing remarks MLS
Attention all investors! This property is waiting for your personal touch to revitalize it. Featuring a spacious layout, large lot, and situated in a highly desirable neighborhood. Recent upgrades include a new roof and luxury vinyl plank flooring. Don't let this opportunity pass you by to transform this house into your dream home.
Key facts
- Large lot
- New roof
- 0.27 acre lot
Tags
Neighborhood map
What this means for you Summary
Snapshot
- This is a 5-bed/2.5-bath single-family listed at $272k.
Deal economics
- At list price, monthly cash flow is $-78 ($-932/yr) — negative.
- To cash-flow at today's rent, offer at most $258k (5.0% below list).
- To meet the 1% rule (rent ≥ 1% of price), the offer needs to be $269k (1.0% below list).
- Recommended offer: $258k (5.0% below list) — sets the bar for cash-flow.
- Cap rate 6.0% vs local median 2.4% in Friendswood — top-decile yield for the area; either an underpriced asset or a hidden risk that comps aren't pricing in. Stress-test before assuming the spread holds.
Location & tenants
- Location reads 70/100 on livability (#338 in TX) — a middle-class / working-renter tenant base. Strengths: crime A+, employment A+, housing A+; Watch: amenities F, commute F, health & safety F.
- Friendswood ISD (suburban): math 64% / reading 65% proficiency, ranked #15 of 826 in TX (top 2%) — acceptable for families but not a draw, mixed tenant base, ~2y average lease; only 8% free/reduced lunch — higher-income household profile.
- Market conditions: Rents rising (+2.7%/yr); 512 active listings in the ZIP; high-income renter base; 3,258 units permitted in Galveston County in 2024 (0 in 5+ unit buildings).
Forward outlook
- Local home prices are declining (-3.0%/yr); year-one equity from $2k of loan paydown is wiped out by about $8k of value loss. Plan a longer hold.
- Galveston County population projected at +43% by 2050 — long-run rental-demand tailwind backs the buy-and-hold thesis.
Negotiation context
- It's been on market 42 days — a 3% lower offer ($264k) is reasonable based on typical stale-listing flexibility.
Risks & watch-outs
- Watch-outs: property tax is 2.9% of price.
- Climate carrying-cost: severe wind risk, 99% chance of damaging wind over 30y; extreme-heat days projected 6→22/yr by 2055 (HVAC capex compounding) — expect insurance premiums to compound above CPI over the hold.
Questions for the listing agent
- What do current leases actually rent for vs. the listed asking? Can we see a recent rent roll and the last 12 months of T-12 income?
- It's been on market 42 days. Have you received any prior offers? Is the seller open to a 5% concession, seller financing, or rate buy-down credit?
- Property tax is high relative to price — has the assessment been appealed recently, and will the sale trigger a re-assessment?
- What does the HOA fee cover, when was the last increase, and are there any pending special assessments or reserve-fund shortfalls?
- Is there a deadline driving the sale (1031 exchange, divorce, estate, relocation)? That informs how much negotiation room exists.
- Schools are A-rated — typically a magnet for longer-tenancy family renters. What's the average tenant stay here, and is there a school-zone premium baked into asking?
- What's the average days-on-market for RENTAL listings here right now (not sales)? A rising rental-DOM trend means longer vacancies and softer asking-rent achievability than the comps imply.
- What's the recent tenant-quality profile in this submarket — average credit score on applications, eviction rate, late-payment / NSF rate, and stable-employment percentage? A property-management company in the area should have these aggregated.
- How much new for-sale + rental construction is in the pipeline within 1–3 miles? Heavy new supply typically softens prices + rents 12–24 months out; constrained supply supports both.
Investment metrics
- 1% rule
- 0.99% ✗
- Cap rate
- 5.95%
- Cash-on-cash
- -1.22%
- DSCR
- 0.95
- GRM
- 8.4
CMA / ARV
- ARV (median comp)
- $397,632
- List price
- $272,000
- Delta
- -31.60%
- Verdict
- UNDERPRICED
- Comps
- 20 within 1.0 mi
Show comp detail 12 sales within ~0.75 mi
| Address | Dist | Beds/Ba | Sqft | Sold | Price | $/sf | Match |
|---|---|---|---|---|---|---|---|
| 902 Essex Dr | 0.00mi | 5/2.5 | 2,369 (+2%) | 1mo | $272,000 | $115 | 96 |
| 715 Regency Ct | 0.40mi | 5/2.0 | 2,400 (+3%) | 14mo | $345,000 | $144 | 62 |
| 1017 Tipperary Ave | 0.40mi | 4/2.5 (-1) | 2,209 (-5%) | 8mo | $428,999 | $194 | 62 |
| 1012 Glenshannon Ave | 0.30mi | 4/2.5 (-1) | 2,115 (-9%) | 6mo | $415,000 | $196 | 61 |
| 801 Lancaster Dr | 0.15mi | 4/2.0 (-1) | 1,972 (-15%) | 7mo | $365,000 | $185 | 55 |
| 1104 Glenshannon Ave | 0.38mi | 4/2.5 (-1) | 2,529 (+9%) | 8mo | $494,900 | $196 | 55 |
| 804 Balmoral Ct | 0.36mi | 4/2.5 (-1) | 2,535 (+9%) | 10mo | $475,000 | $187 | 54 |
| 704 Balmoral Ct | 0.38mi | 4/2.5 (-1) | 2,576 (+11%) | 11mo | $515,000 | $200 | 50 |
| 711 Greenbriar Ave | 0.57mi | 4/2.5 (-1) | 2,448 (+6%) | 12mo | $550,000 | $225 | 50 |
| 1509 Windsor Dr | 0.46mi | 4/2.0 (-1) | 1,998 (-14%) | 1mo | $399,900 | $200 | 48 |
| 1219 Merriewood Dr | 0.53mi | 4/3.5 (-1) | 2,669 (+15%) | 1mo | $534,000 | $200 | 41 |
| 1708 Keystone Dr | 0.74mi | 4/2.5 (-1) | 2,462 (+6%) | 18mo | $475,000 | $193 | 35 |
Match score weights: distance 35% · size 25% · config 20% · recency 20%. Top-matched comps best support the ARV.
Projected returns pro-forma
-3.0% appreciation · 2.74% rent growth · sell at horizon
- IRR
- -18.5%
- Equity multiple
- 0.35×
- Total profit
- $-49,483
- Equity at exit
- $40,556
- IRR
- -11.3%
- Equity multiple
- 0.33×
- Total profit
- $-51,347
- Equity at exit
- $23,518
Cash invested: $76,160 (down + closing). Projections, not guarantees.
Landlord ↔ Tenant lean methodology
- Overall (STATE)
- 87 Strongly Landlord-Friendly
- State Texas
- 87 Strongly Landlord-Friendly · R+5
- County
- — inherits STATE
- City
- — inherits STATE
ZIP-level market 77546
- Rents YoY
- 2.7%
- Active inventory
- 512
- Price-to-rent
- 8.4×
Monthly cashflow live
- Estimated rent
- $2,693 medium interval (Pro) →
- Mortgage (P&I)
- −$1,426
- Tax from tax record
- −$663 /mo · $7,958/yr
- Insurance
- −$113
- HOA
- −$2
- Vacancy / Maint / Mgmt
- −$565
- Net cashflow
- $-78
Break-even live
Sensitivity live
| Price | -10% $76 | -5% $-1 | +0% $-78 | +5% $-155 | +10% $-232 |
|---|---|---|---|---|---|
| Rent | -10% $-290 | -5% $-184 | +0% $-78 | +5% $29 | +10% $135 |
| Rate | -1.0pp $59 | -0.5pp $-8 | base $-78 | +0.5pp $-148 | +1.0pp $-220 |
UW: 25.0% down · 7.5% · 30yr · 1.5% tax · 5.0% vac · 8.0% maint · 8.0% mgmt
Financing live
Cash to close
- Down payment
- $68,000
- Closing costs
- $8,160
- Reserves months
- —
- Total cash needed
- —
Loan-product check · same deal, 3 products live
Conventional
25% down · 7.5% · 30yr
- Down + closing
- —
- Monthly P&I
- —
- Monthly cashflow
- —
- DSCR
- —
- Eligible?
- —
Personal DTI + credit; lowest rate.
DSCR
20% down · 8.5% · 30yr
- Down + closing
- —
- Monthly P&I
- —
- Monthly cashflow
- —
- DSCR
- —
- Eligible?
- —
No personal income docs; deal must DSCR.
Hard money
10% down · 12.0% · 12mo
- Down + closing
- —
- Monthly P&I
- —
- Monthly cashflow
- —
- DSCR
- —
- Eligible?
- —
Short-term bridge; refi at stabilization.
HOA detail
- Monthly dues
- $2 · $24/yr
Listing history 3 events
-
2026-04-27price $272,000 333-char remark
Show marketing remark (333 chars)
Attention all investors! This property is waiting for your personal touch to revitalize it. Featuring a spacious layout, large lot, and situated in a highly desirable neighborhood. Recent upgrades include a new roof and luxury vinyl plank flooring. Don't let this opportunity pass you by to transform this house into your dream home.
-
2026-04-14price $279,500 333-char remark
Show marketing remark (333 chars)
Attention all investors! This property is waiting for your personal touch to revitalize it. Featuring a spacious layout, large lot, and situated in a highly desirable neighborhood. Recent upgrades include a new roof and luxury vinyl plank flooring. Don't let this opportunity pass you by to transform this house into your dream home.
-
2026-04-14$284,000 Active 333-char remark
Show marketing remark (333 chars)
Attention all investors! This property is waiting for your personal touch to revitalize it. Featuring a spacious layout, large lot, and situated in a highly desirable neighborhood. Recent upgrades include a new roof and luxury vinyl plank flooring. Don't let this opportunity pass you by to transform this house into your dream home.
ⓘ Source: listings_history table (triggers on properties + properties_extension) + one-shot
backfill from property_details.listing_events for pre-trigger history.
Tax reassessment forecast TX · Resets to sale price
- Current annual tax
- $7,958 · $663/mo
- Projected year-2 tax
- $7,958 · $663/mo
- Expected delta
- $0/yr ($0/mo · 0.0%)
ⓘ Screening estimate from a state-policy table — verify with the county assessor before closing.
Climate risk First Street
- Flood 3/10 Moderate FEMA zone X (unshaded) · 20% chance over 30 yrs
- Wildfire 1/10 Low
- Heat 9/10 Extreme 6 d/yr ≥107°F today · 22 d/yr by 30 yrs out
- Wind 9/10 Extreme 99% chance of damaging wind over 30 yrs
- Air quality 2/10 Low 1 unhealthy d/yr today · 1 by 30 yrs out
Nearby sold comps map
Loading sold comps map…
Walkable amenities ~0.75 mi
Loading nearby amenities…
Taxation est. · year 1
- Rental income
- $32,312
- − Mortgage interest
- −$15,236
- − Property taxes
- −$7,958
- − Insurance
- −$1,360
- − Repairs & maintenance
- −$2,585
- − Management
- −$2,585
- − HOA
- −$24
- − Depreciation
- −$7,913
- Taxable loss
- −$5,348
- Est. tax savings @ 24.0%
- +$1,284
- After-tax cash flow
- $352/yr
For passive investors: Depreciation is non-cash, so a rental often shows a tax loss while cash-flowing — sheltering income. Rental losses are passive: they offset passive income freely, and up to $25,000/yr can offset ordinary (W-2) income if you actively participate and your MAGI is under $100k (phasing out to $0 by $150k); unused losses carry forward. On sale, claimed depreciation is recaptured at up to 25%, and gains may owe capital-gains tax (a 1031 exchange can defer both). Figures are a year-1 estimate at your 24.0% rate — not tax advice; consult a CPA.
Schools (NCES district)
- District
- Friendswood ISD
- NCES district ID
- 4819950
- Math proficiency
- 64% ▼ -12.00%
- Reading proficiency
- 65% ▼ -6.00%
- Median HH income
- $109,699
- Composite
- 60.52/100
- National rank
- #841
- State rank
- #15 of 826 in TX
Livability — Friendswood
- Score
- 70/100
- State rank
- #338
- US rank
- #7362
Category grades
Schools grade is shown separately in the Schools card above.
Census & demographics
- Census place
- Friendswood, TX
- County
- Galveston County · 357,330 people
- City population
- 54,789
- Metro
- Houston-The Woodlands-Sugar Land, TX
- Population (ZIP)
- 54,789
- Household income
- $123,756
- Rent vs Own
- Severe rent burden
- 1350.0
Population outlook (Galveston County) Hauer SSP2
- Today (2025)
- 390,640 people
- By 2030
- 425,226 · +8.9%
- By 2040
- 493,765 · +26.4%
- By 2050
- 559,698 · +43.3%
- By 2075
- 719,260 · +84.1%
- By 2100
- 819,628 · +109.8%
Race, ethnicity, and origin ACS 2023
- Neighborhood character
- Predominantly White (67%)
- Race & ethnicity
- White 67% Hispanic / Latino 17% Two or more races 11% Asian 7% Black 4%
- Hispanic origin (detail)
- Mexican 13%
- Common ancestry
- Lithuanian 3% Italian 3% Romanian 2%
- Foreign-born
- 10% · Canada, Vietnam, China
- Languages at home
- 84% English-only · Spanish 7% Other Indo-European 3% Vietnamese 2%
Political lean MEDSL · Galveston
- 2024 margin
- Strong R (+27.4) · D 35.7% · R 63.1% · Other 1.2%
- 2008→2024 swing
- -7.9pp toward R · 2008: -19.5pp · 2024: -27.4pp
- All cycles
- 2024: R+27.4 2020: R+22.6 2016: R+22.6 2012: R+26.9 2008: R+19.5
Not yet ingested
- Civics
- —
Market trends
- HPI YoY
- ▼ -160.03%
- Current HPI
- 243.7934
- Rent YoY
- ▲ 2.74%
- Metro
- Houston-The Woodlands-Sugar Land, TX
- State GDP YoY
- ▲ 3.95%
- F500 in state
- 110
Industry mix (Fortune 500 HQ in TX)
| Industry | F500 HQs | Revenue |
|---|---|---|
| Energy | 16 | $1,198B |
|
||
| Technology | 5 | $198B |
|
||
| Engineering / Construction | 4 | $72B |
|
||
| Energy Services | 3 | $60B |
|
||
| Utilities | 3 | $41B |
|
||
| Healthcare | 2 | $330B |
|
||
Price history
-4.2% since first listed3 events — show timeline
- 2026-04-27 Price Changed $272,000 HARMLS
- 2026-04-14 Price Changed $279,500 HARMLS
- 2026-04-14 Listed $284,000 HARMLS
Property tax history
+4.9%/yrLatest (2025): $7,958 · +6.2% YoY. Source: county tax records.
Cash-flow waterfall
monthlySold comps — $/sqft
last 12 mo · ≤1 miLoading sold comps…