33 Hwy 16 #272 · West Glendive, MT
Flood risk 1/10 · Minimal
- FEMA flood zone
- —
- Chance of flooding over 30 yrs
- 0.0%
- Est. flood insurance / yr
- —
Fire risk 4/10 · Minor
- Est. fire insurance / yr
- $918 – $1,706
Heat risk 3/10 · Minor
- Hot days now (above 99°F)
- 7 days/yr
- Hot days in 30 yrs
- 14 days/yr
Wind risk 2/10 · Minimal
- Chance of severe wind over 30 yrs
- —
Air-quality risk 3/10 · Minor
- Unhealthy air days now
- 2 days/yr
- Unhealthy air days in 30 yrs
- 3 days/yr
Risk factors via First Street. Map © Google.
Why this score? — see what drove the B- grade
The composite is a weighted blend of 9 inputs, each scored 0–100. Each bar is that input's sub-score; the figure is the points it added to the 100-point composite (weight × sub-score).
- Cash flow +30.0/30.0
- 1% rule +10.0/10.0
- DSCR +10.0/10.0
- ARV discount +7.5/15.0
- Livability +3.6/5.0
- Rent growth +2.5/5.0
- Schools +2.4/10.0
- Condition / age +2.2/5.0
- Appreciation +0.0/10.0
$30,000
🖨 Deal sheet (PDF) 📄 Offer letter ✓ Due diligence
Key facts
- 6,000 sq ft lot
- Built 1975
- Listed 52 days
Property features AI
Exterior
- Parking: No on-site parking
- Utilities: Public water; Public sewer
- Home design: Residential mobile home; Single-family residence; Above-grade finished living area: 924; Zoned Residential 6000
- Construction: No basement
- Exterior features: No fencing; Shed(s) on the property
Interior
- Kitchen: Oven, Range, Refrigerator
- Bedrooms: 3 main-level bedrooms
- Bathrooms: 1 full bathroom (on main level)
- Heating & cooling: Electric forced-air heating; Has cooling (type: Other)
- Interior features: Oven; Range; Refrigerator
Neighborhood map
What this means for you Summary
Snapshot
- This is a 3-bed/1.0-bath manufactured listed at $30k. Condition is rated fair.
Deal economics
- At list price, monthly cash flow is $678 ($8k/yr) — positive.
- The deal already cash-flows at list — no discount required.
- Meets the 1% rule at list price ($1k rent vs $30k).
- Recommended offer: $29k (3.0% below list) — sets the bar for market timing.
Location & tenants
- Location reads 71/100 on livability (#69 in MT) — a middle-class / working-renter tenant base. Strengths: crime A+, cost of living A+, housing A+; Watch: health & safety D, amenities F, commute F.
- Glendive Elementary (town): math 19% / reading 35% proficiency, ranked #87 of 116 in MT (top 75%) — low school quality limits family demand, transient renter base, plan for 1-2y turnover.
- Market conditions: 10 active listings in the ZIP.
Forward outlook
- Local home prices are declining (-3.0%/yr); year-one equity from $207 of loan paydown is wiped out by about $900 of value loss. Plan a longer hold.
- Dawson County population projected at +40% by 2050 — long-run rental-demand tailwind backs the buy-and-hold thesis.
- At projected returns (-3.0% appreciation + 3.0% rent growth), your $8k cash investment doubles in ~2 years — after that, you're playing with house money.
Negotiation context
- It's been on market 53 days — a 3% lower offer ($29k) is reasonable based on typical stale-listing flexibility.
Questions for the listing agent
- It's been on market 53 days. Have you received any prior offers? Is the seller open to a 3% concession, seller financing, or rate buy-down credit?
- Have any recent inspections been done? Can we get a copy of the seller's disclosures and any deferred-maintenance estimates?
- Built in 1975 — when were the roof, HVAC, electrical panel, plumbing, and water heater last replaced?
- Is there a deadline driving the sale (1031 exchange, divorce, estate, relocation)? That informs how much negotiation room exists.
- What's the average days-on-market for RENTAL listings here right now (not sales)? A rising rental-DOM trend means longer vacancies and softer asking-rent achievability than the comps imply.
- What's the recent tenant-quality profile in this submarket — average credit score on applications, eviction rate, late-payment / NSF rate, and stable-employment percentage? A property-management company in the area should have these aggregated.
- How much new for-sale + rental construction is in the pipeline within 1–3 miles? Heavy new supply typically softens prices + rents 12–24 months out; constrained supply supports both.
Investment metrics
- 1% rule
- 3.73% ✓
- Cap rate
- 33.40%
- Cash-on-cash
- 96.81%
- DSCR
- 5.31
- GRM
- 2.2
CMA / ARV
No comps found within radius.
Projected returns pro-forma
-3.0% appreciation · 3.0% rent growth · sell at horizon
- IRR
- 97.8%
- Equity multiple
- 5.56×
- Total profit
- $38,318
- Equity at exit
- $4,473
- IRR
- —
- Equity multiple
- 11.60×
- Total profit
- $89,013
- Equity at exit
- $2,594
Cash invested: $8,400 (down + closing). Projections, not guarantees.
Landlord ↔ Tenant lean methodology
- Overall (STATE)
- 82 Strongly Landlord-Friendly
- State Montana
- 82 Strongly Landlord-Friendly · R+11
- County
- — inherits STATE
- City
- — inherits STATE
ZIP-level market 59330
- Active inventory
- 10
- Price-to-rent
- 2.2×
Monthly cashflow live
- Estimated rent
- $1,120 medium interval (Pro) →
- Mortgage (P&I)
- −$157
- Tax est. 1.5%
- −$38 /mo · $450/yr
- Insurance
- −$12
- HOA
- −$0
- Vacancy / Maint / Mgmt
- −$235
- Net cashflow
- $678
Break-even live
Sensitivity live
| Price | -10% $698 | -5% $688 | +0% $678 | +5% $667 | +10% $657 |
|---|---|---|---|---|---|
| Rent | -10% $589 | -5% $633 | +0% $678 | +5% $722 | +10% $766 |
| Rate | -1.0pp $693 | -0.5pp $685 | base $678 | +0.5pp $670 | +1.0pp $662 |
UW: 25.0% down · 7.5% · 30yr · 1.5% tax · 5.0% vac · 8.0% maint · 8.0% mgmt
Financing live
Cash to close
- Down payment
- $7,500
- Closing costs
- $900
- Reserves months
- —
- Total cash needed
- —
Loan-product check · same deal, 3 products live
Conventional
25% down · 7.5% · 30yr
- Down + closing
- —
- Monthly P&I
- —
- Monthly cashflow
- —
- DSCR
- —
- Eligible?
- —
Personal DTI + credit; lowest rate.
DSCR
20% down · 8.5% · 30yr
- Down + closing
- —
- Monthly P&I
- —
- Monthly cashflow
- —
- DSCR
- —
- Eligible?
- —
No personal income docs; deal must DSCR.
Hard money
10% down · 12.0% · 12mo
- Down + closing
- —
- Monthly P&I
- —
- Monthly cashflow
- —
- DSCR
- —
- Eligible?
- —
Short-term bridge; refi at stabilization.
Listing history 16 events
-
2026-06-21days on market $30,000 Active 53 DOM
-
2026-06-18days on market $30,000 Active 51 DOM
-
2026-06-17days on market $30,000 Active 50 DOM
-
2026-06-16days on market $30,000 Active 49 DOM
-
2026-06-15days on market $30,000 Active 48 DOM
-
2026-06-13days on market $30,000 Active 46 DOM
-
2026-06-12days on market $30,000 Active 45 DOM
-
2026-06-09days on market $30,000 Active 42 DOM
-
2026-06-08days on market $30,000 Active 41 DOM
-
2026-06-07days on market $30,000 Active 40 DOM
-
2026-06-05days on market $30,000 Active 38 DOM
-
2026-06-04days on market $30,000 Active 36 DOM
-
2026-06-02days on market $30,000 Active 35 DOM
-
2026-06-01days on market $30,000 Active 34 DOM
-
2026-05-31days on market $30,000 Active 33 DOM
-
2026-04-28$30,000 Active
ⓘ Source: listings_history table (triggers on properties + properties_extension) + one-shot
backfill from property_details.listing_events for pre-trigger history.
Climate risk First Street
- Flood 1/10 Low 0% chance over 30 yrs
- Wildfire 4/10 Moderate
- Heat 3/10 Moderate 7 d/yr ≥99°F today · 14 d/yr by 30 yrs out
- Wind 2/10 Low
- Air quality 3/10 Moderate 2 unhealthy d/yr today · 3 by 30 yrs out
Nearby sold comps map
Loading sold comps map…
Walkable amenities ~0.75 mi
Loading nearby amenities…
Taxation est. · year 1
- Rental income
- $13,443
- − Mortgage interest
- −$1,680
- − Property taxes
- −$450
- − Insurance
- −$150
- − Repairs & maintenance
- −$1,075
- − Management
- −$1,075
- − Depreciation
- −$873
- Taxable income
- $8,139
- Est. tax owed @ 24.0%
- −$1,953
- After-tax cash flow
- $6,179/yr
For passive investors: Depreciation is non-cash, so a rental often shows a tax loss while cash-flowing — sheltering income. Rental losses are passive: they offset passive income freely, and up to $25,000/yr can offset ordinary (W-2) income if you actively participate and your MAGI is under $100k (phasing out to $0 by $150k); unused losses carry forward. On sale, claimed depreciation is recaptured at up to 25%, and gains may owe capital-gains tax (a 1031 exchange can defer both). Figures are a year-1 estimate at your 24.0% rate — not tax advice; consult a CPA.
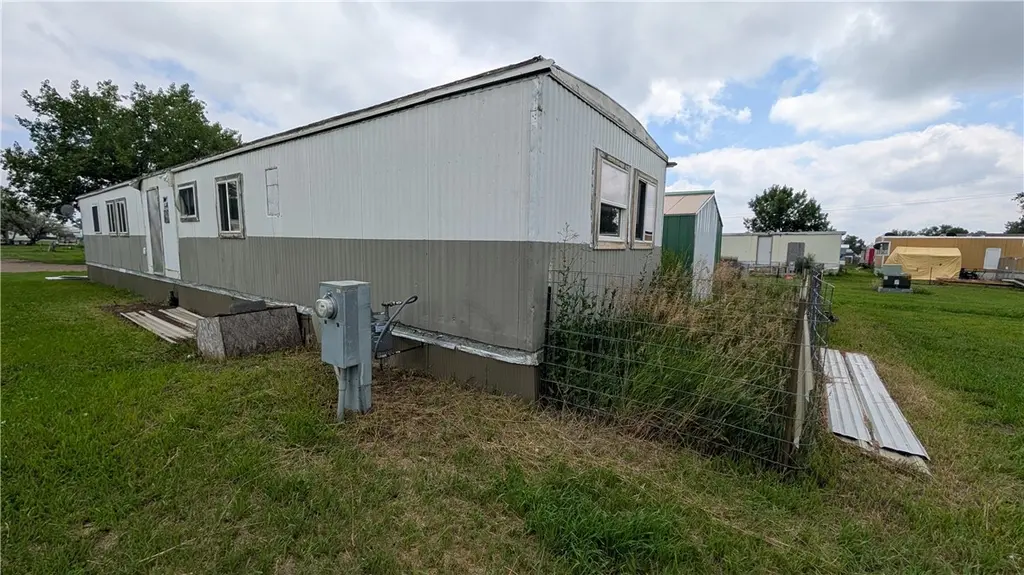
Condition & rehab AI · 10 photos
This manufactured home requires significant exterior repairs and foundation stabilization, but has potential for substantial value increase with these improvements.
Repairs flagged
- Major exterior siding — Significant damage to the siding
- Major exterior foundation — Exposed foundation with visible damage
Value-add opportunities
- Both paint exterior — Enhances curb appeal and value
- Both repair foundation — Stabilizes structure and improves value
- Both update bathroom decor — Modernizes space and enhances value
Renovation cost estimate screening
| Repair item | Severity | Est. cost |
|---|---|---|
| exterior siding · Significant damage to the siding | Major | $15,000–50,000 |
| exterior foundation · Exposed foundation with visible damage | Major | $15,000–50,000 |
| Total estimated repair cost · 2 items | $30,000–100,000 |
Value-add ROI direction
- Both paint exterior — Enhances curb appeal and value ↑
- Both repair foundation — Stabilizes structure and improves value ↑
- Both update bathroom decor — Modernizes space and enhances value ↑
ⓘ Cost ranges are severity-bucket heuristics (US national rule-of-thumb). Get contractor quotes + a written scope before underwriting a rehab budget.
Schools (NCES district)
- District
- Glendive Elementary
- NCES district ID
- 3012510
- Math proficiency
- 19% ▼ -7.00%
- Reading proficiency
- 35% ▼ -6.00%
- Median HH income
- $50,726
- Composite
- 23.73/100
- National rank
- #7825
- State rank
- #87 of 116 in MT
Livability — West Glendive
- Score
- 71/100
- State rank
- #69
- US rank
- #7019
Category grades
Schools grade is shown separately in the Schools card above.
Census & demographics
- Census place
- West Glendive, MT
- Population (ZIP)
- 8,281
Population outlook (Dawson County) Hauer SSP2
- Today (2025)
- 11,008 people
- By 2030
- 11,795 · +7.1%
- By 2040
- 13,471 · +22.4%
- By 2050
- 15,363 · +39.6%
- By 2075
- 20,473 · +86.0%
- By 2100
- 23,528 · +113.7%
Race, ethnicity, and origin ACS 2023
- Neighborhood character
- Predominantly White (91%)
- Race & ethnicity
- White 91% Two or more races 4% Hispanic / Latino 4% Native American 1%
- Common ancestry
- Portuguese 10% Serbian 2% Italian 2%
- Foreign-born
- 2% · Canada
Political lean MEDSL · Dawson
- 2024 margin
- Solid R (+58.9) · D 19.3% · R 78.2% · Other 2.5%
- 2008→2024 swing
- -35.3pp toward R · 2008: -23.6pp · 2024: -58.9pp
- All cycles
- 2024: R+58.9 2020: R+57.8 2016: R+58.5 2012: R+40.9 2008: R+23.6
Not yet ingested
- Civics
- —
Market trends
- HPI YoY
- ▼ -98.12%
- Current HPI
- 144.3453
- Rent YoY
- —
- Metro
- —
- State GDP YoY
- ▲ 3.41%
- F500 in state
- 2
Industry mix (Fortune 500 HQ in MT)
| Industry | F500 HQs | Revenue |
|---|---|---|
| Technology / Analytics | 1 | $2B |
|
||
Price history
1 event — show timeline
- 2026-04-28 Listed $30,000 BMTMLS
Cash-flow waterfall
monthlySold comps — $/sqft
last 12 mo · ≤1 miLoading sold comps…