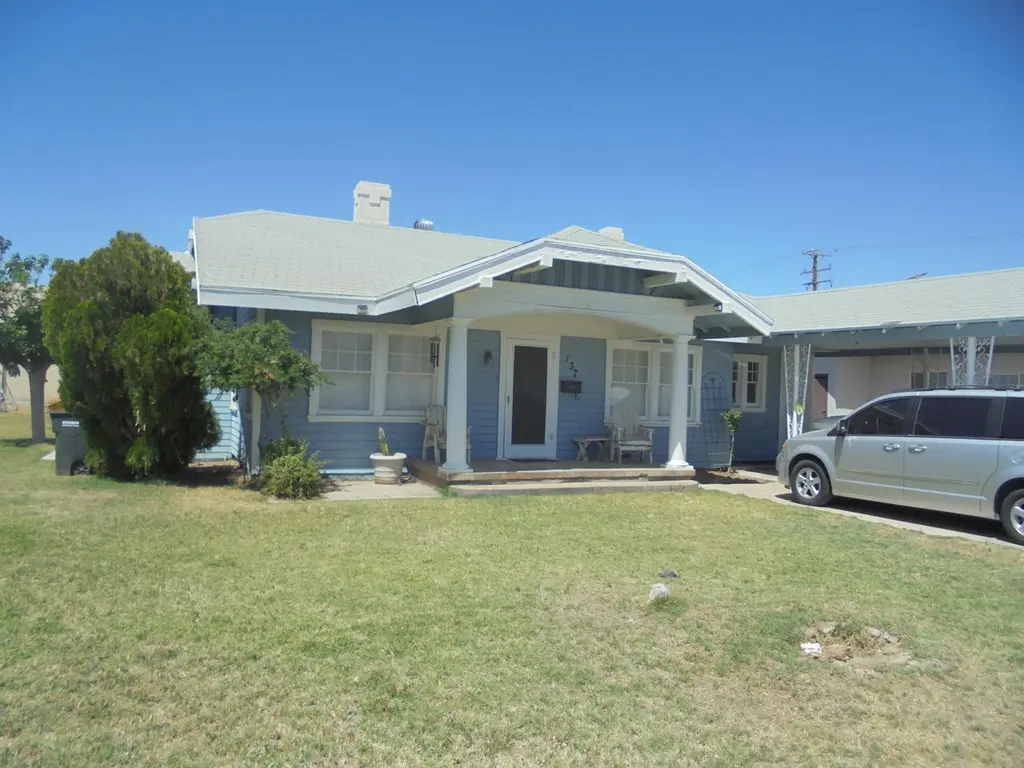
137 S Palm Dr · Blythe, CA
Flood risk 1/10 · Minimal
- FEMA flood zone
- D
- Chance of flooding over 30 yrs
- 0.0%
- Est. flood insurance / yr
- $544 – $1,084
Fire risk 1/10 · Minimal
- Est. fire insurance / yr
- $659 – $1,223
Heat risk 9/10 · Severe
- Hot days now (above 116°F)
- 7 days/yr
- Hot days in 30 yrs
- 18 days/yr
Wind risk 1/10 · Minimal
- Chance of severe wind over 30 yrs
- —
Air-quality risk 2/10 · Minimal
- Unhealthy air days now
- 1 days/yr
- Unhealthy air days in 30 yrs
- 1 days/yr
Risk factors via First Street. Map © Google.
Why this score? — see what drove the D- grade
The composite is a weighted blend of 9 inputs, each scored 0–100. Each bar is that input's sub-score; the figure is the points it added to the 100-point composite (weight × sub-score).
- ARV discount +13.2/15.0
- Cash flow +7.7/30.0
- Livability +3.7/5.0
- Schools +2.6/10.0
- Rent growth +2.5/5.0
- Condition / age +2.5/5.0
- DSCR +1.8/10.0
- 1% rule +1.3/10.0
- Appreciation +0.0/10.0
$199,800
🖨 Deal sheet (PDF) 📄 Offer letter ✓ Due diligence
Listing remarks
Perfect for investors or first-time buyers, this property also offers excellent potential for multi-generational living. This spacious three-bedroom home sits on TWO LOTS, providing ample space for river and desert toys. The property features a detached garage and a Separate one-bedroom granny flat complete with its own kitchen--ideal for extended family, guests, or rental income opportunities. Additional APN# 848-022-020 included.
Key facts
- Two lots
- Own kitchen
- Detached garage
Tags
Property features AI
Finance
- Other: Directions: From Osborne Realty go west on Hobsonway, then left (south) onto Palm Drive; home will be on the right
- Financial info: Sale terms: Conventional or Cash; Property sold 'as is'
- HOA & community: No monthly association fee
Exterior
- Parking: Total of 9 parking spaces; Detached garage (1 car); Covered parking (2 spaces); Carport spaces (2); 4 additional uncovered/assigned spaces; Driveway parking
- Security: No gated community; No special security/safety features
- Utilities: Water available in street; Sewer in street (paid); PUD: No
- Home design: Bungalow-style single family residence; One story; Detached property; Front door faces east; Property described as needing cosmetic repairs
- Construction: Shingle roof; Siding exterior; Built (year source: assessor)
- Exterior features: Back yard and front yard; Level, rectangular lot on a public street; Guest house/casita with a 1-car garage; No additional exterior security features
Interior
- Kitchen: Tile counters
- Bedrooms: Includes a casita/guest house
- Flooring: Carpet; Hardwood
- Bathrooms: One full bath; Two 3/4 baths
- Heating & cooling: Central heating; Fireplace heating (wood); Natural gas heating available; Central air conditioning
- Interior features: Entry from the living room; Unfurnished; Shower and tub in bathrooms; Wood and brick fireplace in the living room
Neighborhood map
What this means for you Summary
Snapshot
- This is a 2-bed/1.0-bath other listed at $200k.
Deal economics
- At list price, monthly cash flow is $-230 ($-3k/yr) — negative.
- To cash-flow at today's rent, offer at most $159k (20.3% below list).
- To meet the 1% rule (rent ≥ 1% of price), the offer needs to be $126k (36.9% below list).
- Recommended offer: $126k (36.9% below list) — sets the bar for 1% rule.
Location & tenants
- Location reads 74/100 on livability (#143 in CA, #4,910 nationally) — a middle-class / working-renter tenant base. Strengths: commute A+, housing A+, health & safety A+; Watch: employment D, amenities F.
- Palo Verde Unified (town): math 20% / reading 34% proficiency, ranked #1,133 of 1,400 in CA (top 81%) — low school quality limits family demand, transient renter base, plan for 1-2y turnover; 64% free/reduced lunch — lower-income household profile, screen leases tightly.
- Zoned schools: Felix J. Appleby Elementary (632 students, 84% FRL); Palo Verde High (820 students, 76% FRL) — zoned schools average 80% FRL vs 64% district-wide (16 pts higher); higher-poverty schools than district average — tighter screening recommended.
- Market conditions: 192 active listings in the ZIP; 3 comparable units currently listed for rent nearby; rentals at typical pace (median 15d on market — plan ~3-4 weeks tenant-placement turnaround); 9,195 units permitted in Riverside County in 2024 (1,512 in 5+ unit buildings).
Forward outlook
- Local home prices are declining (-3.0%/yr); year-one equity from $1k of loan paydown is wiped out by about $6k of value loss. Plan a longer hold.
- Riverside County population projected at +22% by 2050 — long-run rental-demand tailwind backs the buy-and-hold thesis.
Negotiation context
- It's been on market 55 days — a 3% lower offer ($194k) is reasonable based on typical stale-listing flexibility.
- Current owner paid $66k; list at $200k implies a 203% gain — meaningful room to come down on a strong offer.
Risks & watch-outs
- Watch-outs: built in 1920 — expect roof / HVAC / electrical / plumbing capex.
- Climate carrying-cost: extreme-heat days projected 7→18/yr by 2055 (HVAC capex compounding) — expect insurance premiums to compound above CPI over the hold.
Questions for the listing agent
- What do current leases actually rent for vs. the listed asking? Can we see a recent rent roll and the last 12 months of T-12 income?
- It's been on market 55 days. Have you received any prior offers? Is the seller open to a 37% concession, seller financing, or rate buy-down credit?
- Built in 1920 — when were the roof, HVAC, electrical panel, plumbing, and water heater last replaced?
- Is there a deadline driving the sale (1031 exchange, divorce, estate, relocation)? That informs how much negotiation room exists.
- Schools are F-rated, which usually means shorter tenancies and higher turnover. Who's the typical renter profile here, and what's been the actual vacancy rate?
- The area grade is low — what's the realistic commute time and amenity access for the typical tenant pool here? Any planned neighborhood developments (good or bad) we should know about?
- What's the average days-on-market for RENTAL listings here right now (not sales)? A rising rental-DOM trend means longer vacancies and softer asking-rent achievability than the comps imply.
- What's the recent tenant-quality profile in this submarket — average credit score on applications, eviction rate, late-payment / NSF rate, and stable-employment percentage? A property-management company in the area should have these aggregated.
- How much new for-sale + rental construction is in the pipeline within 1–3 miles? Heavy new supply typically softens prices + rents 12–24 months out; constrained supply supports both.
Investment metrics
- 1% rule
- 0.63% ✗
- Cap rate
- 4.91%
- Cash-on-cash
- -4.93%
- DSCR
- 0.78
- GRM
- 13.2
CMA / ARV
- ARV (median comp)
- $228,927
- List price
- $199,800
- Delta
- -12.72%
- Verdict
- UNDERPRICED
- Comps
- 20 within 1.0 mi
Projected returns pro-forma
-3.0% appreciation · 3.0% rent growth · sell at horizon
- IRR
- -24.7%
- Equity multiple
- 0.16×
- Total profit
- $-47,100
- Equity at exit
- $29,791
- IRR
- -20.6%
- Equity multiple
- -0.08×
- Total profit
- $-60,184
- Equity at exit
- $17,275
Cash invested: $55,944 (down + closing). Projections, not guarantees.
Landlord ↔ Tenant lean methodology
- Overall (STATE)
- 18 Strongly Tenant-Friendly
- State California
- 18 Strongly Tenant-Friendly · D+13
- County
- — inherits STATE
- City
- — inherits STATE
ZIP-level market 92225
- Home prices YoY
- -15.8%
- Active inventory
- 192
- Price-to-rent
- 13.2×
Monthly cashflow live
- Estimated rent
- $1,260 medium interval (Pro) →
- Mortgage (P&I)
- −$1,048
- Tax from tax record
- −$95 /mo · $1,136/yr
- Insurance
- −$83
- HOA
- −$0
- Vacancy / Maint / Mgmt
- −$265
- Net cashflow
- $-230
Break-even live
Sensitivity live
| Price | -10% $-117 | -5% $-173 | +0% $-230 | +5% $-287 | +10% $-343 |
|---|---|---|---|---|---|
| Rent | -10% $-330 | -5% $-280 | +0% $-230 | +5% $-180 | +10% $-130 |
| Rate | -1.0pp $-129 | -0.5pp $-179 | base $-230 | +0.5pp $-282 | +1.0pp $-334 |
UW: 25.0% down · 7.5% · 30yr · 1.5% tax · 5.0% vac · 8.0% maint · 8.0% mgmt
Financing live
Cash to close
- Down payment
- $49,950
- Closing costs
- $5,994
- Reserves months
- —
- Total cash needed
- —
Loan-product check · same deal, 3 products live
Conventional
25% down · 7.5% · 30yr
- Down + closing
- —
- Monthly P&I
- —
- Monthly cashflow
- —
- DSCR
- —
- Eligible?
- —
Personal DTI + credit; lowest rate.
DSCR
20% down · 8.5% · 30yr
- Down + closing
- —
- Monthly P&I
- —
- Monthly cashflow
- —
- DSCR
- —
- Eligible?
- —
No personal income docs; deal must DSCR.
Hard money
10% down · 12.0% · 12mo
- Down + closing
- —
- Monthly P&I
- —
- Monthly cashflow
- —
- DSCR
- —
- Eligible?
- —
Short-term bridge; refi at stabilization.
Rent comps 3 comps
| Address | Beds | Baths | Sqft | Rent | $/sqft | DOM | Units | Dist |
|---|---|---|---|---|---|---|---|---|
| 450 W Barnard St Blythe, CA | 2.0–3.0 | 1.0–2.0 | 935 | $975 | $1.04 | 15d | 2 | 0.34mi |
| 400 N Palm Dr Blythe, CA | 2.0–3.0 | 1.0–1.5 | 928 | $995 | $1.07 | 15d | 1 | 0.48mi |
| 460 River Valley Ave Blythe, CA | 3.0 | 2.0 | 1344 | $2,600 | $1.93 | 15d | 1 | 1.37mi |
Listing history 19 events
-
2026-06-21days on market $199,800 Active 55 DOM
-
2026-06-19days on market $199,800 Active 53 DOM
-
2026-06-18days on market $199,800 Active 52 DOM
-
2026-06-17days on market $199,800 Active 51 DOM
-
2026-06-16days on market $199,800 Active 50 DOM
-
2026-06-15days on market $199,800 Active 49 DOM
-
2026-06-14days on market $199,800 Active 47 DOM
-
2026-06-12days on market $199,800 Active 46 DOM
-
2026-06-09days on market $199,800 Active 43 DOM
-
2026-06-08days on market $199,800 Active 42 DOM
-
2026-06-07days on market $199,800 Active 41 DOM
-
2026-06-07days on market $199,800 Active 40 DOM
-
2026-06-04days on market $199,800 Active 37 DOM
-
2026-06-02days on market $199,800 Active 36 DOM
-
2026-06-01days on market $199,800 Active 35 DOM
-
2026-05-31days on market $199,800 Active 34 DOM
-
2026-05-31days on market $199,800 Active 33 DOM
-
2026-04-27$199,800 Active 435-char remark
-
1985-11-19soldstatus $66,000
ⓘ Source: listings_history table (triggers on properties + properties_extension) + one-shot
backfill from property_details.listing_events for pre-trigger history.
Tax reassessment forecast CA · Resets to sale price
- Current annual tax
- $1,136 · $95/mo
- Projected year-2 tax
- $1,518 · $127/mo
- Expected delta
- +$382/yr (+$32/mo · 33.6%)
ⓘ Screening estimate from a state-policy table — verify with the county assessor before closing.
Climate risk First Street
- Flood 1/10 Low FEMA zone D · 0% chance over 30 yrs
- Wildfire 1/10 Low
- Heat 9/10 Extreme 7 d/yr ≥116°F today · 18 d/yr by 30 yrs out
- Wind 1/10 Low
- Air quality 2/10 Low 1 unhealthy d/yr today · 1 by 30 yrs out
Nearby sold comps map
Loading sold comps map…
Walkable amenities ~0.75 mi
Loading nearby amenities…
Taxation est. · year 1
- Rental income
- $15,125
- − Mortgage interest
- −$11,192
- − Property taxes
- −$1,136
- − Insurance
- −$999
- − Repairs & maintenance
- −$1,210
- − Management
- −$1,210
- − Depreciation
- −$5,812
- Taxable loss
- −$6,434
- Est. tax savings @ 24.0%
- +$1,544
- After-tax cash flow
- $-1,215/yr
For passive investors: Depreciation is non-cash, so a rental often shows a tax loss while cash-flowing — sheltering income. Rental losses are passive: they offset passive income freely, and up to $25,000/yr can offset ordinary (W-2) income if you actively participate and your MAGI is under $100k (phasing out to $0 by $150k); unused losses carry forward. On sale, claimed depreciation is recaptured at up to 25%, and gains may owe capital-gains tax (a 1031 exchange can defer both). Figures are a year-1 estimate at your 24.0% rate — not tax advice; consult a CPA.
Schools (NCES district)
- District
- Palo Verde Unified
- NCES district ID
- 0629640
- Math proficiency
- 20% ▲ 3.00%
- Reading proficiency
- 34% ▲ 5.00%
- Median HH income
- $40,808
- Composite
- 25.77/100
- National rank
- #12796
- State rank
- #1133 of 1400 in CA
Livability — Blythe
- Score
- 74/100
- State rank
- #143
- US rank
- #4910
Category grades
Schools grade is shown separately in the Schools card above.
Census & demographics
- Census place
- Blythe, CA
- Population (ZIP)
- 21,101
Population outlook (Riverside County) Hauer SSP2
- Today (2025)
- 2,664,475 people
- By 2030
- 2,802,692 · +5.2%
- By 2040
- 3,050,904 · +14.5%
- By 2050
- 3,256,783 · +22.2%
- By 2075
- 3,655,058 · +37.2%
- By 2100
- 3,766,594 · +41.4%
Race, ethnicity, and origin ACS 2023
- Neighborhood character
- Diverse neighborhood (Simpson 0.58)
- Race & ethnicity
- Hispanic / Latino 59% White 26% Two or more races 13% Black 10% Asian 2% Native American 2%
- Hispanic origin (detail)
- Mexican 54%
- Common ancestry
- Lithuanian 1% Romanian 1% Iranian 1%
- Foreign-born
- 18% · Canada
- Languages at home
- 55% English-only · Spanish 42% Other Indo-European 1% Tagalog/Filipino 0%
Political lean MEDSL · Riverside
- 2024 margin
- Toss-up / Even · D 48.0% · R 49.3% · Other 2.6%
- 2008→2024 swing
- -3.6pp toward R · 2008: 2.3pp · 2024: -1.3pp
- All cycles
- 2024: R+1.3 2020: D+8.0 2016: D+4.3 2012: R+0.4 2008: D+2.3
Not yet ingested
- Civics
- —
Market trends
- HPI YoY
- ▼ -40.53%
- Current HPI
- 215.4794
- Rent YoY
- —
- Metro
- —
- State GDP YoY
- ▲ 3.21%
- F500 in state
- 116
Industry mix (Fortune 500 HQ in CA)
| Industry | F500 HQs | Revenue |
|---|---|---|
| Technology | 27 | $1,492B |
|
||
| Financial Services | 3 | $174B |
|
||
| Retail | 3 | $44B |
|
||
| Insurance | 3 | $26B |
|
||
| Media / Entertainment | 2 | $115B |
|
||
| Pharmaceuticals / Biotech | 2 | $62B |
|
||
Price history
+202.7% since first listed2 events — show timeline
- 2026-04-27 Listed $199,800 GPSMLS
- 1985-11-19 Sold (Public Records) $66,000 Public Records
Property tax history
+1.9%/yrLatest (2025): $1,136 · -0.9% YoY. Source: county tax records.
Cash-flow waterfall
monthlySold comps — $/sqft
last 12 mo · ≤1 miLoading sold comps…