4422 Stillman St · Zephyrhills South, FL
Flood risk 1/10 · Minimal
- FEMA flood zone
- X (unshaded)
- Chance of flooding over 30 yrs
- 0.0%
- Est. flood insurance / yr
- $507 – $1,088
Fire risk 4/10 · Minor
- Est. fire insurance / yr
- $947 – $1,759
Heat risk 9/10 · Severe
- Hot days now (above 108°F)
- 7 days/yr
- Hot days in 30 yrs
- 24 days/yr
Wind risk 9/10 · Severe
- Chance of severe wind over 30 yrs
- 99.0%
Air-quality risk 2/10 · Minimal
- Unhealthy air days now
- 1 days/yr
- Unhealthy air days in 30 yrs
- 2 days/yr
Risk factors via First Street. Map © Google.
Why this score? — see what drove the D grade
The composite is a weighted blend of 9 inputs, each scored 0–100. Each bar is that input's sub-score; the figure is the points it added to the 100-point composite (weight × sub-score).
- Cash flow +14.5/30.0
- ARV discount +7.5/15.0
- DSCR +4.4/10.0
- Schools +4.3/10.0
- 1% rule +3.1/10.0
- Livability +2.9/5.0
- Condition / age +2.5/5.0
- Rent growth +1.6/5.0
- Appreciation +0.0/10.0
$185,000
🖨 Deal sheet (PDF) 📄 Offer letter ✓ Due diligence
Listing remarks
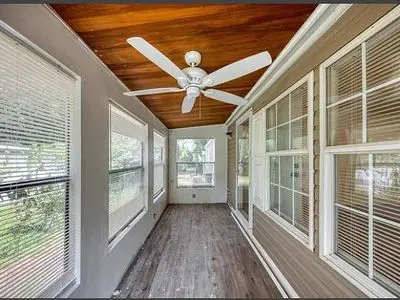
Enjoy this 2 bedroom/2 bath manufactured home with a Florida Room! Move-In Ready & very clean. NO age restrictions here, ALL are WELCOMED! HUGE SHED in the rear with electrical that can accomodate plenty of tools, lawn equipment and much more! With close proximity to Wesley Chapel with three MALLS, several hospitals, including the VA hospital. Enjoy the wide variety of restaurants, including The Krates in Wesley Chapel with plenty of retail & additional restaurant options! LARGE kitchen with island, pantry & plenty of cabinets. Washer & Dryer included (INSIDE laundry area for added convenience). Oversized DRIVEWAY under CARPORT, can accomodate several vehicles. NO HO
Key facts
- No age restrictions
- No flood zone area
- Huge shed
Tags
Neighborhood map
What this means for you Summary
Snapshot
- This is a 2-bed/2.0-bath manufactured listed at $185k.
Deal economics
- At list price, monthly cash flow is $42 ($500/yr) — positive.
- The deal already cash-flows at list — no discount required.
- To meet the 1% rule (rent ≥ 1% of price), the offer needs to be $149k (19.5% below list).
- Recommended offer: $149k (19.5% below list) — sets the bar for 1% rule.
- Cap rate 6.6% vs local median 4.1% in Zephyrhills South — top-decile yield for the area; either an underpriced asset or a hidden risk that comps aren't pricing in. Stress-test before assuming the spread holds.
Location & tenants
- Location reads 58/100 on livability (#836 in FL) — a working-class tenant base; expect higher turnover. Strengths: cost of living A+; Watch: employment D, amenities F, commute F.
- Pasco (suburban): math 50% / reading 52% proficiency, ranked #32 of 73 in FL (top 44%) — acceptable for families but not a draw, mixed tenant base, ~2y average lease.
- Zoned schools: West Zephyrhills Elementary School (math 27% / reading 32%, grade F, #1,896 of 2,144 statewide, top 90%, 615 students, 81% FRL); Raymond B. Stewart Middle School (math 33% / reading 30%, grade F, #453 of 571 statewide, top 81%, 988 students, 77% FRL); Zephyrhills High School (math 35% / reading 37%, grade F, #359 of 667 statewide, top 55%, 1,656 students, 70% FRL) — zoned schools average 76% FRL vs 48% district-wide (27 pts higher); higher-poverty schools than district average — tighter screening recommended.
- Zoned-school proficiency averages 32% at this address vs 51% district-wide (-19 pts) — the specific schools serving this property underperform the Pasco average; the district grade overstates school quality for this exact location.
- Market conditions: Rents falling (-3.6%/yr); 297 active listings in the ZIP; 31 comparable units currently listed for rent nearby; rentals at typical pace (median 26d on market — plan ~3-4 weeks tenant-placement turnaround); 6,765 units permitted in Pasco County in 2024 (1,250 in 5+ unit buildings).
- This rent runs 36% of the median local income ($49k/yr) — at the standard rent-burdened threshold; future hikes will face affordability resistance.
Forward outlook
- Local home prices are declining (-3.0%/yr); year-one equity from $1k of loan paydown is wiped out by about $6k of value loss. Plan a longer hold.
- Pasco County population projected at +29% by 2050 — long-run rental-demand tailwind backs the buy-and-hold thesis.
Negotiation context
- Only 12 days on market — expect competitive offers; lowballing is unlikely to land.
- 8 sale attempts since 15y ago with the ask held roughly flat each time — persistent listings suggest the price (not the market) is what's stuck; bring a comps-based counter.
Risks & watch-outs
- Climate carrying-cost: severe wind risk, 99% chance of damaging wind over 30y; extreme-heat days projected 7→24/yr by 2055 (HVAC capex compounding) — expect insurance premiums to compound above CPI over the hold.
Questions for the listing agent
- Is there a deadline driving the sale (1031 exchange, divorce, estate, relocation)? That informs how much negotiation room exists.
- Schools are F-rated, which usually means shorter tenancies and higher turnover. Who's the typical renter profile here, and what's been the actual vacancy rate?
- The area grade is low — what's the realistic commute time and amenity access for the typical tenant pool here? Any planned neighborhood developments (good or bad) we should know about?
- What's the average days-on-market for RENTAL listings here right now (not sales)? A rising rental-DOM trend means longer vacancies and softer asking-rent achievability than the comps imply.
- What's the recent tenant-quality profile in this submarket — average credit score on applications, eviction rate, late-payment / NSF rate, and stable-employment percentage? A property-management company in the area should have these aggregated.
- How much new for-sale + rental construction is in the pipeline within 1–3 miles? Heavy new supply typically softens prices + rents 12–24 months out; constrained supply supports both.
Investment metrics
- 1% rule
- 0.81% ✗
- Cap rate
- 6.56%
- Cash-on-cash
- 0.97%
- DSCR
- 1.04
- GRM
- 10.3
CMA / ARV
- ARV (on-the-fly)
- $122,080
- Comps found
- 9
Show comp detail 9 sales within ~0.75 mi
| Address | Dist | Beds/Ba | Sqft | Sold | Price | $/sf | Match |
|---|---|---|---|---|---|---|---|
| 4711 Olive Dr | 0.66mi | 2/2.0 | 1,056 (-6%) | 6mo | $115,000 | $109 | 54 |
| 4435 Autumn Palm Dr | 0.71mi | 2/2.0 | 1,056 (-6%) | 9mo | $170,000 | $161 | 50 |
| 4710 Orange Blossom Dr | 0.69mi | 2/2.0 | 1,008 (-10%) | 2mo | $75,000 | $74 | 50 |
| 38039 Leondias Dr | 0.62mi | 3/2.0 (+1) | 1,056 (-6%) | 11mo | $170,000 | $161 | 47 |
| 4628 Olive Dr | 0.62mi | 2/2.0 | 1,056 (-6%) | 21mo | $108,500 | $103 | 44 |
| 3732 Muller Dr | 0.73mi | 2/2.0 | 1,008 (-10%) | 8mo | $87,500 | $87 | 42 |
| 4635 Orange Blossom Dr | 0.69mi | 2/2.0 | 1,216 (+9%) | 14mo | $132,500 | $109 | 42 |
| 4425 Autumn Palm Dr | 0.71mi | 2/2.5 | 1,208 (+8%) | 13mo | $164,800 | $136 | 41 |
| 3706 Castle Dr | 0.73mi | 2/2.0 | 960 (-14%) | 16mo | $100,000 | $104 | 28 |
Match score weights: distance 35% · size 25% · config 20% · recency 20%. Top-matched comps best support the ARV.
Projected returns pro-forma
-3.0% appreciation · 0.0% rent growth · sell at horizon
- IRR
- -17.9%
- Equity multiple
- 0.39×
- Total profit
- $-31,755
- Equity at exit
- $27,584
- IRR
- -16.3%
- Equity multiple
- 0.20×
- Total profit
- $-41,373
- Equity at exit
- $15,995
Cash invested: $51,800 (down + closing). Projections, not guarantees.
Landlord ↔ Tenant lean methodology
- Overall (STATE)
- 87 Strongly Landlord-Friendly
- State Florida
- 87 Strongly Landlord-Friendly · R+3
- County
- — inherits STATE
- City
- — inherits STATE
ZIP-level market 33542
- Home prices YoY
- -20.6%
- Rents YoY
- -3.6%
- Active inventory
- 297
- Price-to-rent
- 10.3×
Monthly cashflow live
- Estimated rent
- $1,490 high interval (Pro) →
- Mortgage (P&I)
- −$970
- Tax from tax record
- −$88 /mo · $1,057/yr
- Insurance
- −$77
- HOA
- −$0
- Vacancy / Maint / Mgmt
- −$313
- Net cashflow
- $42
Break-even live
Sensitivity live
| Price | -10% $146 | -5% $94 | +0% $42 | +5% $-11 | +10% $-63 |
|---|---|---|---|---|---|
| Rent | -10% $-76 | -5% $-17 | +0% $42 | +5% $101 | +10% $159 |
| Rate | -1.0pp $135 | -0.5pp $89 | base $42 | +0.5pp $-6 | +1.0pp $-55 |
UW: 25.0% down · 7.5% · 30yr · 1.5% tax · 5.0% vac · 8.0% maint · 8.0% mgmt
Financing live
Cash to close
- Down payment
- $46,250
- Closing costs
- $5,550
- Reserves months
- —
- Total cash needed
- —
Loan-product check · same deal, 3 products live
Conventional
25% down · 7.5% · 30yr
- Down + closing
- —
- Monthly P&I
- —
- Monthly cashflow
- —
- DSCR
- —
- Eligible?
- —
Personal DTI + credit; lowest rate.
DSCR
20% down · 8.5% · 30yr
- Down + closing
- —
- Monthly P&I
- —
- Monthly cashflow
- —
- DSCR
- —
- Eligible?
- —
No personal income docs; deal must DSCR.
Hard money
10% down · 12.0% · 12mo
- Down + closing
- —
- Monthly P&I
- —
- Monthly cashflow
- —
- DSCR
- —
- Eligible?
- —
Short-term bridge; refi at stabilization.
Rent comps 31 comps
| Address | Beds | Baths | Sqft | Rent | $/sqft | DOM | Units | Dist |
|---|---|---|---|---|---|---|---|---|
| 38236 Fir Ave Zephyrhills, FL | 2.0 | 1.0 | 950 | $1,350 | $1.42 | 26d | 1 | 0.45mi |
| 4738 20th St Zephyrhills, FL | 2.0 | 1.0 | 810 | $1,400 | $1.73 | 26d | 1 | 0.47mi |
| 4808 20th St Zephyrhills, FL | 2.0 | 1.0 | 702 | $1,295 | $1.84 | 12d | 1 | 0.51mi |
| 4940 9th St Zephyrhills, FL | 3.0 | 1.0 | 1404 | $1,895 | $1.35 | 26d | 1 | 0.52mi |
| 4845 20th St Zephyrhills, FL | 2.0 | 1.0 | 752 | $1,350 | $1.80 | 26d | 1 | 0.54mi |
| 38702 South Ave Zephyrhills, FL | 2.0 | 1.0 | 800 | $1,600 | $2.00 | 26d | 1 | 0.54mi |
| 38055 Woodgate Ln Zephyrhills, FL | 3.0 | 2.0 | 1456 | $1,400 | $0.96 | 26d | 1 | 0.59mi |
| 5028 16th St Zephyrhills, FL | 2.0 | 2.0 | 1092 | $1,545 | $1.41 | 1d | 1 | 0.61mi |
| 39014 South Ave Zephyrhills, FL | 2.0 | 1.0 | 840 | $1,395 | $1.66 | 1d | 1 | 0.64mi |
| 39014 South Ave Zephyrhills, FL | 2.0 | 1.0 | 840 | $1,395 | $1.66 | 6d | 1 | 0.64mi |
| 4940 4th St Zephyrhills, FL | 2.0 | 2.0 | 900 | $1,350 | $1.50 | 26d | 1 | 0.65mi |
| 5022 5th St Zephyrhills, FL | 2.0 | 1.5 | 974 | $1,595 | $1.64 | 26d | 1 | 0.69mi |
| 37925 Date Palm Dr Zephyrhills, FL | 3.0 | 1.5 | 720 | $1,300 | $1.81 | 26d | 1 | 0.75mi |
| 4639 Coral St Zephyrhills, FL | 2.0 | 2.0 | 1056 | $1,250 | $1.18 | 26d | 1 | 0.83mi |
| 4812 Coral St Zephyrhills, FL | 1.0 | 1.0 | 856 | $1,200 | $1.40 | 21d | 1 | 0.86mi |
| 37819 Alissa Dr Zephyrhills, FL | 2.0 | 2.0 | 864 | $1,450 | $1.68 | 19d | 1 | 0.87mi |
| 38031 Meyer Ave Zephyrhills, FL | 3.0 | 2.0 | 1000 | $1,175 | $1.18 | 26d | 1 | 0.90mi |
| 5143 1st St Zephyrhills, FL | 3.0 | 2.0 | 1436 | $1,750 | $1.22 | 26d | 1 | 1.01mi |
| 39252 Heights Ave Zephyrhills, FL | 3.0 | 2.0 | 1210 | $2,050 | $1.69 | 16d | 1 | 1.06mi |
| 5237 1st St Zephyrhills, FL | 3.0 | 1.0 | 964 | $1,700 | $1.76 | 26d | 1 | 1.08mi |
| 37902 7th Ave Zephyrhills, FL | 3.0 | 1.0 | 900 | $1,775 | $1.97 | 26d | 1 | 1.08mi |
| 5441 6th St Zephyrhills, FL | 2.0 | 1.0 | 1014 | $1,650 | $1.63 | 26d | 1 | 1.15mi |
| 5532 20th St Unit 1234470P Zephyrhills, FL | 2.0 | 2.0 | 839 | $7,732 | $9.22 | 1d | 1 | 1.17mi |
| 5542 20th St Unit 1234473P Zephyrhills, FL | 2.0 | 2.0 | 839 | $3,199 | $3.81 | 4d | 1 | 1.17mi |
| 5652 18th St Zephyrhills, FL | 2.0 | 1.0 | 976 | $1,200 | $1.23 | 26d | 1 | 1.27mi |
| 38981 Harlow Rose Dr Zephyrhills, FL | 3.0 | 2.0 | 1491 | $1,940 | $1.30 | 5d | 1 | 1.28mi |
| 5647 20th St Zephyrhills, FL | 2.0 | 1.0 | 850 | $1,425 | $1.68 | 26d | 1 | 1.28mi |
| 38942 9th Ave Zephyrhills, FL | 2.0 | 1.0 | 850 | $1,425 | $1.68 | 26d | 1 | 1.30mi |
| 5600 Jennie St Zephyrhills, FL | 2.0 | 2.0 | 730 | $1,100 | $1.51 | 26d | 1 | 1.31mi |
| 5532 Jennie St Zephyrhills, FL | 2.0 | 2.0 | 862 | $1,100 | $1.28 | 14d | 1 | 1.33mi |
| 5812 17th St Zephyrhills, FL | 3.0 | 2.0 | 1320 | $2,100 | $1.59 | 26d | 1 | 1.40mi |
Listing history 17 events
-
2026-06-22days on market $185,000 Active 12 DOM
-
2026-06-18days on market $185,000 Active 9 DOM
-
2026-06-17days on market $185,000 Active 8 DOM
-
2026-06-16days on market $185,000 Active 7 DOM
-
2026-06-15days on market $185,000 Active 6 DOM
-
2026-06-13days on market $185,000 Active 4 DOM
-
2026-06-10remarks 683-char remark
-
2026-06-10pricedays on market $185,000 Active 1 DOM
-
2026-06-09days on market $180,000 Active 10 DOM
-
2026-06-08days on market $180,000 Active 9 DOM
-
2026-06-07days on market $180,000 Active 8 DOM
-
2026-06-04days on market $180,000 Active 5 DOM
-
2026-06-03days on market $180,000 Active 4 DOM
-
2026-06-02days on market $180,000 Active 3 DOM
-
2026-06-01days on market $180,000 Active 2 DOM
-
2026-05-31remarks 117-char remark
-
2026-05-31$180,000 Active 1 DOM
ⓘ Source: listings_history table (triggers on properties + properties_extension) + one-shot
backfill from property_details.listing_events for pre-trigger history.
Tax reassessment forecast FL · Resets to sale price
- Current annual tax
- $1,057 · $88/mo
- Projected year-2 tax
- $1,536 · $128/mo
- Expected delta
- +$478/yr (+$40/mo · 45.2%)
ⓘ Screening estimate from a state-policy table — verify with the county assessor before closing.
Climate risk First Street
- Flood 1/10 Low FEMA zone X (unshaded) · 0% chance over 30 yrs
- Wildfire 4/10 Moderate
- Heat 9/10 Extreme 7 d/yr ≥108°F today · 24 d/yr by 30 yrs out
- Wind 9/10 Extreme 99% chance of damaging wind over 30 yrs
- Air quality 2/10 Low 1 unhealthy d/yr today · 2 by 30 yrs out
Nearby sold comps map
Loading sold comps map…
Walkable amenities ~0.75 mi
Loading nearby amenities…
Taxation est. · year 1
- Rental income
- $17,879
- − Mortgage interest
- −$10,363
- − Property taxes
- −$1,057
- − Insurance
- −$925
- − Repairs & maintenance
- −$1,430
- − Management
- −$1,430
- − Depreciation
- −$5,382
- Taxable loss
- −$2,709
- Est. tax savings @ 24.0%
- +$650
- After-tax cash flow
- $1,150/yr
For passive investors: Depreciation is non-cash, so a rental often shows a tax loss while cash-flowing — sheltering income. Rental losses are passive: they offset passive income freely, and up to $25,000/yr can offset ordinary (W-2) income if you actively participate and your MAGI is under $100k (phasing out to $0 by $150k); unused losses carry forward. On sale, claimed depreciation is recaptured at up to 25%, and gains may owe capital-gains tax (a 1031 exchange can defer both). Figures are a year-1 estimate at your 24.0% rate — not tax advice; consult a CPA.
Schools (NCES district)
- District
- Pasco
- NCES district ID
- 1201530
- Math proficiency
- 50% ▼ -10.00%
- Reading proficiency
- 52% ▼ -5.00%
- Median HH income
- $45,039
- Composite
- 43.14/100
- National rank
- #3074
- State rank
- #32 of 73 in FL
Livability — Zephyrhills South
- Score
- 58/100
- State rank
- #836
- US rank
- #20702
Category grades
Schools grade is shown separately in the Schools card above.
Census & demographics
- Census place
- Zephyrhills South, FL
- County
- Pasco County · 524,098 people
- Metro
- Tampa-St. Petersburg-Clearwater, FL
- Population (ZIP)
- 23,612
- Household income
- $49,316
- Rent vs Own
- Severe rent burden
- 831.0
Population outlook (Pasco County) Hauer SSP2
- Today (2025)
- 570,045 people
- By 2030
- 605,844 · +6.3%
- By 2040
- 674,806 · +18.4%
- By 2050
- 736,022 · +29.1%
- By 2075
- 862,900 · +51.4%
- By 2100
- 906,364 · +59.0%
Race, ethnicity, and origin ACS 2023
- Neighborhood character
- Predominantly White (76%)
- Race & ethnicity
- White 76% Hispanic / Latino 17% Two or more races 8% Black 4% Asian 1%
- Hispanic origin (detail)
- Mexican 2% Puerto Rican 10%
- Common ancestry
- Lithuanian 3% Romanian 2% Iranian 2%
- Foreign-born
- 5% · Canada, Jamaica
- Languages at home
- 86% English-only · Spanish 12% Other Indo-European 1% Russian/Polish/Slavic 1%
Political lean MEDSL · Pasco
- 2024 margin
- Strong R (+25.2) · D 36.9% · R 62.1% · Other 1.0%
- 2008→2024 swing
- -21.6pp toward R · 2008: -3.6pp · 2024: -25.2pp
- All cycles
- 2024: R+25.2 2020: R+20.1 2016: R+21.6 2012: R+6.7 2008: R+3.6
Not yet ingested
- Civics
- —
Market trends
- HPI YoY
- ▼ -81.25%
- Current HPI
- 313.3993
- Rent YoY
- ▼ -3.56%
- Metro
- Tampa-St. Petersburg-Clearwater, FL
- State GDP YoY
- ▲ 3.28%
- F500 in state
- 36
Industry mix (Fortune 500 HQ in FL)
| Industry | F500 HQs | Revenue |
|---|---|---|
| Industrial Technology | 2 | $29B |
|
||
| Insurance | 2 | $17B |
|
||
| Retail | 1 | $60B |
|
||
| Technology Distribution | 1 | $58B |
|
||
| Homebuilding | 1 | $35B |
|
||
| Technology Manufacturing | 1 | $35B |
|
||
Price history
+351.1% since first listed20 events — show timeline
- 2026-05-31 Listed $180,000 FSBO.com
- 2024-12-17 Listing Removed — Stellar MLS as Distributed by MLS Grid
- 2024-10-30 Listed $225,000 Stellar MLS as Distributed by MLS Grid
- 2024-05-20 Listing Removed — Stellar MLS as Distributed by MLS Grid
- 2024-05-17 Listed $215,000 Stellar MLS as Distributed by MLS Grid
- 2023-03-18 Listing Removed — Stellar MLS as Distributed by MLS Grid
- 2023-02-06 Listed $184,900 Stellar MLS as Distributed by MLS Grid
- 2022-11-21 Sold (Public Records) $175,000 Public Records
- 2022-11-15 Sold (MLS) $175,000 Stellar MLS as Distributed by MLS Grid
- 2022-10-17 Pending — Stellar MLS as Distributed by MLS Grid
- 2022-09-20 Price Changed $174,999 Stellar MLS as Distributed by MLS Grid
- 2022-09-14 Relisted — Stellar MLS as Distributed by MLS Grid
- 2022-09-10 Pending — Stellar MLS as Distributed by MLS Grid
- 2022-09-01 Listed $175,000 Stellar MLS as Distributed by MLS Grid
- 2022-04-11 Sold (Public Records) $101,000 Public Records
- 2022-02-28 Sold (MLS) $101,000 Stellar MLS as Distributed by MLS Grid
- 2022-02-10 Pending — Stellar MLS as Distributed by MLS Grid
- 2022-02-03 Listed $100,000 Stellar MLS as Distributed by MLS Grid
- 2012-08-10 Sold (MLS) $36,000 Stellar MLS as Distributed by MLS Grid
- 2011-12-18 Listed $39,900 Stellar MLS as Distributed by MLS Grid
Property tax history
+8.9%/yrLatest (2025): $1,057 · +3.6% YoY. Source: county tax records.
Cash-flow waterfall
monthlySold comps — $/sqft
last 12 mo · ≤1 miLoading sold comps…