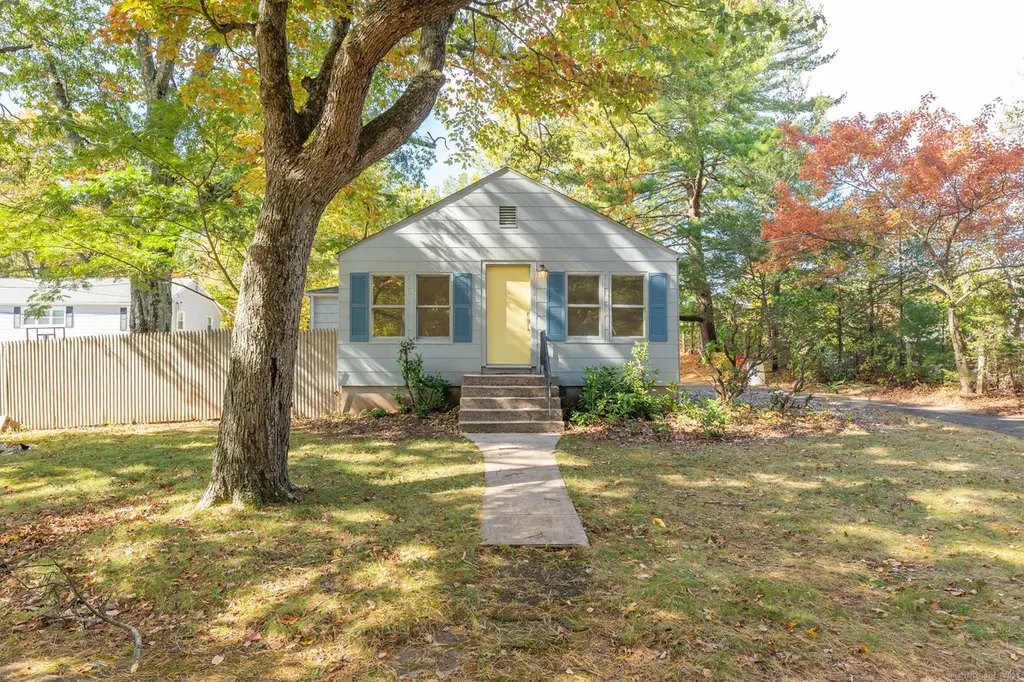
1384 West St · Bristol, CT
Flood risk 1/10 · Minimal
- FEMA flood zone
- X (unshaded)
- Chance of flooding over 30 yrs
- 0.0%
- Est. flood insurance / yr
- $473 – $860
Fire risk 2/10 · Minimal
- Est. fire insurance / yr
- $829 – $1,539
Heat risk 5/10 · Moderate
- Hot days now (above 98°F)
- 8 days/yr
- Hot days in 30 yrs
- 17 days/yr
Wind risk 6/10 · Moderate
- Chance of severe wind over 30 yrs
- 27.0%
Air-quality risk 3/10 · Minor
- Unhealthy air days now
- 2 days/yr
- Unhealthy air days in 30 yrs
- 3 days/yr
Risk factors via First Street. Map © Google.
Why this score? — see what drove the D grade
The composite is a weighted blend of 9 inputs, each scored 0–100. Each bar is that input's sub-score; the figure is the points it added to the 100-point composite (weight × sub-score).
- ARV discount +15.0/15.0
- Cash flow +9.1/30.0
- Schools +5.2/10.0
- Livability +4.0/5.0
- DSCR +2.5/10.0
- Rent growth +2.5/5.0
- Condition / age +2.5/5.0
- 1% rule +2.4/10.0
- Appreciation +0.0/10.0
$299,900
🖨 Deal sheet (PDF) 📄 Offer letter ✓ Due diligence
Listing remarks MLS
Welcome home to this quaint 3 bed 1 bath property conveniently located. This house offers so much potential. Schedule your showing today to see for yourself!
Key facts
- 0.86 acre lot
- Built 1938
- Listed 169 days
Neighborhood map
What this means for you Summary
Snapshot
- This is a 3-bed/1.0-bath single-family listed at $300k.
Deal economics
- At list price, monthly cash flow is $-230 ($-3k/yr) — negative.
- To cash-flow at today's rent, offer at most $259k (13.5% below list).
- To meet the 1% rule (rent ≥ 1% of price), the offer needs to be $222k (25.9% below list).
- Recommended offer: $222k (25.9% below list) — sets the bar for 1% rule.
- Cap rate 5.4% vs local median 3.3% in Bristol — top-decile yield for the area; either an underpriced asset or a hidden risk that comps aren't pricing in. Stress-test before assuming the spread holds.
Location & tenants
- Location reads 81/100 on livability (#21 in CT, #1,585 nationally) — a professional / high-income tenant draw. Strengths: crime A+, housing A+, health & safety A+; Watch: commute F.
- Southington School District (suburban): math 52% / reading 64% proficiency, ranked #51 of 153 in CT (top 33%) — acceptable for families but not a draw, mixed tenant base, ~2y average lease; only 11% free/reduced lunch — higher-income household profile.
- Zoned schools: Thalberg Elementary School (math 52% / reading 56%, grade C, #207 of 553 statewide, top 38%, 431 students, 19% FRL); Joseph A. Depaolo Middle School (math 43% / reading 63%, grade C+, #71 of 175 statewide, top 41%, 694 students, 24% FRL); Southington High School (math 48% / reading 68%, grade C, #50 of 194 statewide, top 25%, 1,945 students, 22% FRL).
- Market conditions: 111 active listings in the ZIP; 1 comparable units currently listed for rent nearby; high-income renter base; 1,867 units permitted in Capitol Planning Region in 2024 (1,399 in 5+ unit buildings).
Forward outlook
- Local home prices are declining (-3.0%/yr); year-one equity from $2k of loan paydown is wiped out by about $9k of value loss. Plan a longer hold.
Negotiation context
- It's been on market 169 days — a 12% lower offer ($264k) is reasonable based on typical stale-listing flexibility.
- 2 sale attempts since 15y ago; this cycle's ask has dropped $50k (14%) from the opening price — seller is motivated, your offer sets the floor, not the list.
- Current owner paid $130k; list at $300k implies a 131% gain — meaningful room to come down on a strong offer.
Risks & watch-outs
- Watch-outs: built in 1938 — expect roof / HVAC / electrical / plumbing capex.
- Climate carrying-cost: major wind risk, 27% chance of damaging wind over 30y; extreme-heat days projected 8→17/yr by 2055 (HVAC capex compounding) — expect insurance premiums to compound above CPI over the hold.
Questions for the listing agent
- What do current leases actually rent for vs. the listed asking? Can we see a recent rent roll and the last 12 months of T-12 income?
- It's been on market 169 days. Have you received any prior offers? Is the seller open to a 26% concession, seller financing, or rate buy-down credit?
- Built in 1938 — when were the roof, HVAC, electrical panel, plumbing, and water heater last replaced?
- Why hasn't it sold? Are there any deal-killer items the seller is aware of (foundation, flood, title, zoning, code violations)?
- Is there a deadline driving the sale (1031 exchange, divorce, estate, relocation)? That informs how much negotiation room exists.
- The area grade is low — what's the realistic commute time and amenity access for the typical tenant pool here? Any planned neighborhood developments (good or bad) we should know about?
- What's the average days-on-market for RENTAL listings here right now (not sales)? A rising rental-DOM trend means longer vacancies and softer asking-rent achievability than the comps imply.
- What's the recent tenant-quality profile in this submarket — average credit score on applications, eviction rate, late-payment / NSF rate, and stable-employment percentage? A property-management company in the area should have these aggregated.
- How much new for-sale + rental construction is in the pipeline within 1–3 miles? Heavy new supply typically softens prices + rents 12–24 months out; constrained supply supports both.
Investment metrics
- 1% rule
- 0.74% ✗
- Cap rate
- 5.37%
- Cash-on-cash
- -3.28%
- DSCR
- 0.85
- GRM
- 11.3
CMA / ARV
- ARV (median comp)
- $411,663
- List price
- $299,900
- Delta
- -27.15%
- Verdict
- UNDERPRICED
- Comps
- 6 within 1.0 mi
Show comp detail 1 sale within ~0.75 mi
| Address | Dist | Beds/Ba | Sqft | Sold | Price | $/sf | Match |
|---|---|---|---|---|---|---|---|
| 153 Welch Rd | 0.68mi | 2/1.0 (-1) | 936 (-7%) | 9mo | $350,000 | $374 | 44 |
Match score weights: distance 35% · size 25% · config 20% · recency 20%. Top-matched comps best support the ARV.
Projected returns pro-forma
-3.0% appreciation · 3.0% rent growth · sell at horizon
- IRR
- -21.8%
- Equity multiple
- 0.25×
- Total profit
- $-63,242
- Equity at exit
- $44,716
- IRR
- -15.6%
- Equity multiple
- 0.12×
- Total profit
- $-73,985
- Equity at exit
- $25,930
Cash invested: $83,972 (down + closing). Projections, not guarantees.
Landlord ↔ Tenant lean methodology
- Overall (STATE)
- 27 Tenant-Leaning
- State Connecticut
- 27 Tenant-Leaning · D+7
- County
- — inherits STATE
- City
- — inherits STATE
ZIP-level market 06489
- Active inventory
- 111
- Price-to-rent
- 11.3×
Monthly cashflow live
- Estimated rent
- $2,221 medium interval (Pro) →
- Mortgage (P&I)
- −$1,573
- Tax from tax record
- −$287 /mo · $3,443/yr
- Insurance
- −$125
- HOA
- −$0
- Vacancy / Maint / Mgmt
- −$467
- Net cashflow
- $-230
Break-even live
Sensitivity live
| Price | -10% $-60 | -5% $-145 | +0% $-230 | +5% $-315 | +10% $-399 |
|---|---|---|---|---|---|
| Rent | -10% $-405 | -5% $-317 | +0% $-230 | +5% $-142 | +10% $-54 |
| Rate | -1.0pp $-79 | -0.5pp $-153 | base $-230 | +0.5pp $-307 | +1.0pp $-386 |
UW: 25.0% down · 7.5% · 30yr · 1.5% tax · 5.0% vac · 8.0% maint · 8.0% mgmt
Financing live
Cash to close
- Down payment
- $74,975
- Closing costs
- $8,997
- Reserves months
- —
- Total cash needed
- —
Loan-product check · same deal, 3 products live
Conventional
25% down · 7.5% · 30yr
- Down + closing
- —
- Monthly P&I
- —
- Monthly cashflow
- —
- DSCR
- —
- Eligible?
- —
Personal DTI + credit; lowest rate.
DSCR
20% down · 8.5% · 30yr
- Down + closing
- —
- Monthly P&I
- —
- Monthly cashflow
- —
- DSCR
- —
- Eligible?
- —
No personal income docs; deal must DSCR.
Hard money
10% down · 12.0% · 12mo
- Down + closing
- —
- Monthly P&I
- —
- Monthly cashflow
- —
- DSCR
- —
- Eligible?
- —
Short-term bridge; refi at stabilization.
Rent comps 1 comps
| Address | Beds | Baths | Sqft | Rent | $/sqft | DOM | Units | Dist |
|---|---|---|---|---|---|---|---|---|
| 273 Queen St Unit 16F Southington, CT | 2.0 | 1.5 | 920 | $1,920 | $2.09 | 25d | 1 | 1.42mi |
Listing history 6 events
-
2026-05-14price $299,900 157-char remark
Show marketing remark (157 chars)
Welcome home to this quaint 3 bed 1 bath property conveniently located. This house offers so much potential. Schedule your showing today to see for yourself!
-
2026-04-16price $322,000 157-char remark
Show marketing remark (157 chars)
Welcome home to this quaint 3 bed 1 bath property conveniently located. This house offers so much potential. Schedule your showing today to see for yourself!
-
2025-12-10$349,900 Active 157-char remark
Show marketing remark (157 chars)
Welcome home to this quaint 3 bed 1 bath property conveniently located. This house offers so much potential. Schedule your showing today to see for yourself!
-
2012-02-27historical
-
2011-02-27$208,000
-
1988-08-26soldstatus $129,900
ⓘ Source: listings_history table (triggers on properties + properties_extension) + one-shot
backfill from property_details.listing_events for pre-trigger history.
Tax reassessment forecast CT · Partial reset (capped growth)
- Current annual tax
- $3,443 · $287/mo
- Projected year-2 tax
- $4,930 · $411/mo
- Expected delta
- +$1,487/yr (+$124/mo · 43.2%)
ⓘ Screening estimate from a state-policy table — verify with the county assessor before closing.
Climate risk First Street
- Flood 1/10 Low FEMA zone X (unshaded) · 0% chance over 30 yrs
- Wildfire 2/10 Low
- Heat 5/10 Major 8 d/yr ≥98°F today · 17 d/yr by 30 yrs out
- Wind 6/10 Major 27% chance of damaging wind over 30 yrs
- Air quality 3/10 Moderate 2 unhealthy d/yr today · 3 by 30 yrs out
Nearby sold comps map
Loading sold comps map…
Walkable amenities ~0.75 mi
Loading nearby amenities…
Taxation est. · year 1
- Rental income
- $26,658
- − Mortgage interest
- −$16,799
- − Property taxes
- −$3,443
- − Insurance
- −$1,500
- − Repairs & maintenance
- −$2,133
- − Management
- −$2,133
- − Depreciation
- −$8,724
- Taxable loss
- −$8,074
- Est. tax savings @ 24.0%
- +$1,938
- After-tax cash flow
- $-818/yr
For passive investors: Depreciation is non-cash, so a rental often shows a tax loss while cash-flowing — sheltering income. Rental losses are passive: they offset passive income freely, and up to $25,000/yr can offset ordinary (W-2) income if you actively participate and your MAGI is under $100k (phasing out to $0 by $150k); unused losses carry forward. On sale, claimed depreciation is recaptured at up to 25%, and gains may owe capital-gains tax (a 1031 exchange can defer both). Figures are a year-1 estimate at your 24.0% rate — not tax advice; consult a CPA.
Schools (NCES district)
- District
- Southington School District
- NCES district ID
- 0904230
- Math proficiency
- 52% ▼ -9.00%
- Reading proficiency
- 64% ▼ -5.00%
- Median HH income
- $81,467
- Composite
- 52.38/100
- National rank
- #1581
- State rank
- #51 of 153 in CT
Livability — Bristol
- Score
- 81/100
- State rank
- #21
- US rank
- #1585
Category grades
Schools grade is shown separately in the Schools card above.
Census & demographics
- County
- Hartford County · 754,208 people
- City population
- 61,684
- Metro
- Hartford-East Hartford-Middletown, CT
- Population (ZIP)
- 32,706
- Household income
- $126,465
- Rent vs Own
- Severe rent burden
- 513.0
Population outlook (Capitol County) Hauer SSP2
- By 2040
- 1,063,519
Race, ethnicity, and origin ACS 2023
- Neighborhood character
- Predominantly White (87%)
- Race & ethnicity
- White 87% Two or more races 6% Hispanic / Latino 5% Asian 2% Black 1%
- Hispanic origin (detail)
- Puerto Rican 3%
- Common ancestry
- Romanian 13% Lithuanian 7% Russian 2%
- Foreign-born
- 9% · Canada, China, Jamaica
- Languages at home
- 88% English-only · Other Indo-European 4% Spanish 3% Russian/Polish/Slavic 2%
Political lean MEDSL · Capitol
- 2024 margin
- Strong D (+21.9) · D 60.1% · R 38.2% · Other 1.7%
- All cycles
- 2024: D+21.9
Not yet ingested
- Civics
- —
Market trends
- HPI YoY
- ▼ -161.57%
- Current HPI
- 179.8884
- Rent YoY
- —
- Metro
- Hartford-East Hartford-Middletown, CT
- State GDP YoY
- ▲ 1.06%
- F500 in state
- 38
Industry mix (Fortune 500 HQ in CT)
| Industry | F500 HQs | Revenue |
|---|---|---|
| Industrial Machinery | 4 | $38B |
|
||
| Insurance | 3 | $71B |
|
||
| Financial Services | 2 | $25B |
|
||
| Transportation / Logistics | 2 | $18B |
|
||
| Healthcare | 1 | $247B |
|
||
| Telecommunications | 1 | $55B |
|
||
Price history
+130.9% since first listed6 events — show timeline
- 2026-05-14 Price Changed $299,900 Smart MLS
- 2026-04-16 Price Changed $322,000 Smart MLS
- 2025-12-10 Listed $349,900 Smart MLS
- 2012-02-27 Listing Removed — Smart MLS
- 2011-02-27 Listed $208,000 Smart MLS
- 1988-08-26 Sold (Public Records) $129,900 Public Records
Property tax history
+1.6%/yrLatest (2025): $3,443 · +5.6% YoY. Source: county tax records.
Cash-flow waterfall
monthlySold comps — $/sqft
last 12 mo · ≤1 miLoading sold comps…