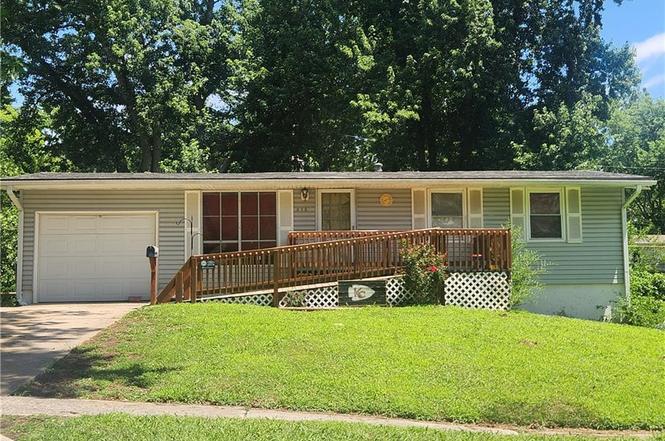
313 N Geronimo Dr · Independence, MO
Flood risk 1/10 · Minimal
- FEMA flood zone
- X (unshaded)
- Chance of flooding over 30 yrs
- 0.0%
- Est. flood insurance / yr
- $473 – $860
Fire risk 1/10 · Minimal
- Est. fire insurance / yr
- $1,054 – $1,958
Heat risk 4/10 · Minor
- Hot days now (above 107°F)
- 7 days/yr
- Hot days in 30 yrs
- 17 days/yr
Wind risk 2/10 · Minimal
- Chance of severe wind over 30 yrs
- —
Air-quality risk 3/10 · Minor
- Unhealthy air days now
- 3 days/yr
- Unhealthy air days in 30 yrs
- 3 days/yr
Risk factors via First Street. Map © Google.
Why this score? — see what drove the B+ grade
The composite is a weighted blend of 9 inputs, each scored 0–100. Each bar is that input's sub-score; the figure is the points it added to the 100-point composite (weight × sub-score).
- Cash flow +29.9/30.0
- ARV discount +15.0/15.0
- DSCR +10.0/10.0
- 1% rule +8.8/10.0
- Livability +4.1/5.0
- Rent growth +3.4/5.0
- Schools +3.0/10.0
- Condition / age +2.5/5.0
- Appreciation +0.0/10.0
$105,000
🖨 Deal sheet 📄 Offer letter ✓ Due diligence
Listing remarks MLS
Ranch in Independence. Great location, Fort Osage Schools, 3 Bedrooms, 1 1/2 Baths, Walkout basement. Extra parking on Driveway.
Key facts
- Ranch floor plan
- Metal storage shed
- Fenced backyard
Tags
Property features AI
Exterior
- Parking: Attached garage that faces the front (1-car)
- Utilities: Public water; Public sewer
- Home design: Single-family residence; Ranch floor plan; Fixer condition; Accessible approach with ramp
- Construction: Frame construction with vinyl siding; Composition roof; Basement with concrete floor and walk-out access
- Exterior features: Metal fencing; City lot
Interior
- Kitchen: Eat-in kitchen; Microwave; Gas Range
- Bedrooms: 3 bedrooms — all on the first floor
- Bathrooms: 1 full bathroom; 1 half bathroom
- Heating & cooling: Forced air heating; Electric cooling
- Interior features: Eat-in kitchen; Microwave; Gas Range
- Laundry & utility: Laundry in basement
Neighborhood map
What this means for you Summary
Snapshot
- This is a 3-bed/1.0-bath single-family listed at $105k.
Deal economics
- At list price, monthly cash flow is $388 ($5k/yr) — positive.
- The deal already cash-flows at list — no discount required.
- Meets the 1% rule at list price ($1k rent vs $105k).
- Cap rate 10.7% vs local median 5.0% in Independence — top-decile yield for the area; either an underpriced asset or a hidden risk that comps aren't pricing in. Stress-test before assuming the spread holds.
Location & tenants
- Location reads 82/100 on livability (#10 in MO, #1,296 nationally) — a professional / high-income tenant draw. Strengths: amenities A+, commute A+, cost of living A+; Watch: schools C-, employment D+, crime F.
- Fort Osage R-I (rural): math 28% / reading 39% proficiency, ranked #213 of 324 in MO (top 66%) — families likely to look elsewhere, expect single-tenant / working-renter base with shorter leases.
- Market conditions: Rents rising (+3.8%/yr); 106 active listings in the ZIP; 7 comparable units currently listed for rent nearby; rentals leasing fast (median 11d on market — plan ~1-2 weeks tenant-placement turnaround); 4,002 units permitted in Jackson County in 2024 (2,271 in 5+ unit buildings).
Forward outlook
- Local home prices are declining (-3.0%/yr); year-one equity from $726 of loan paydown is wiped out by about $3k of value loss. Plan a longer hold.
- Jackson County population projected at +4% by 2050 — modest demand growth; plan on rents tracking national, not racing it.
- At projected returns (-3.0% appreciation + 3.8% rent growth), your $29k cash investment doubles in ~8 years — after that, you're playing with house money.
Negotiation context
- Only 2 days on market — expect competitive offers; lowballing is unlikely to land.
Questions for the listing agent
- Built in 1963 — when were the roof, HVAC, electrical panel, plumbing, and water heater last replaced?
- Is there a deadline driving the sale (1031 exchange, divorce, estate, relocation)? That informs how much negotiation room exists.
- Crime grade is F in this area — have there been break-ins, vandalism, or insurance claims at this property in the last 3 years? What carrier currently insures it and at what premium?
- What's the average days-on-market for RENTAL listings here right now (not sales)? A rising rental-DOM trend means longer vacancies and softer asking-rent achievability than the comps imply.
- What's the recent tenant-quality profile in this submarket — average credit score on applications, eviction rate, late-payment / NSF rate, and stable-employment percentage? A property-management company in the area should have these aggregated.
- How much new for-sale + rental construction is in the pipeline within 1–3 miles? Heavy new supply typically softens prices + rents 12–24 months out; constrained supply supports both.
Investment metrics
- 1% rule
- 1.38% ✓
- Cap rate
- 10.73%
- Cash-on-cash
- 15.85%
- DSCR
- 1.71
- GRM
- 6.0
CMA / ARV
- ARV (on-the-fly)
- $184,500
- Comps found
- 10
Show comp detail 10 sales within ~0.75 mi
| Address | Dist | Beds/Ba | Sqft | Sold | Price | $/sf | Match |
|---|---|---|---|---|---|---|---|
| 507 N Geronimo Dr | 0.16mi | 3/2.0 | 925 (+3%) | 6mo | $189,900 | $205 | 79 |
| 18510 E 5th St N | 0.15mi | 3/1.5 | 900 (0%) | 15mo | $150,000 | $167 | 79 |
| 503 N Seminole Dr | 0.23mi | 3/1.5 | 900 (0%) | 16mo | $175,000 | $194 | 74 |
| 713 N Osage Trl | 0.39mi | 3/1.0 | 950 (+6%) | 5mo | $182,500 | $192 | 68 |
| 812 N Cheyenne Dr | 0.51mi | 3/1.5 | 900 (0%) | 8mo | $189,999 | $211 | 68 |
| 504 N Seminole Dr | 0.21mi | 2/1.5 (-1) | 900 (0%) | 22mo | $179,900 | $200 | 65 |
| 18509 E 5th Ter | 0.18mi | 2/1.5 (-1) | 900 (0%) | 24mo | $196,000 | $218 | 65 |
| 545 N Powahatan Dr | 0.34mi | 3/1.0 | 999 (+11%) | 7mo | $205,000 | $205 | 60 |
| 833 N Arapaho St | 0.63mi | 3/1.5 | 900 (0%) | 14mo | $225,000 | $250 | 57 |
| 819 N Powahatan Dr | 0.64mi | 3/1.0 | 920 (+2%) | 22mo | $168,000 | $183 | 48 |
Match score weights: distance 35% · size 25% · config 20% · recency 20%. Top-matched comps best support the ARV.
Projected returns pro-forma
-3.0% appreciation · 3.76% rent growth · sell at horizon
- IRR
- 7.6%
- Equity multiple
- 1.30×
- Total profit
- $8,880
- Equity at exit
- $15,656
- IRR
- 17.6%
- Equity multiple
- 2.51×
- Total profit
- $44,411
- Equity at exit
- $9,078
Cash invested: $29,400 (down + closing). Projections, not guarantees.
Landlord ↔ Tenant lean methodology
- Overall (STATE)
- 81 Strongly Landlord-Friendly
- State Missouri
- 81 Strongly Landlord-Friendly · R+10
- County
- — inherits STATE
- City
- — inherits STATE
ZIP-level market 64056
- Rents YoY
- 3.8%
- Active inventory
- 106
- Price-to-rent
- 6.0×
Monthly cashflow live
- Estimated rent
- $1,451 high interval (Pro) →
- Mortgage (P&I)
- −$551
- Tax from tax record
- −$163 /mo · $1,962/yr
- Insurance
- −$44
- HOA
- −$0
- Vacancy / Maint / Mgmt
- −$305
- Net cashflow
- $388
Break-even live
UW: 25.0% down · 7.5% · 30yr · 1.5% tax · 5.0% vac · 8.0% maint · 8.0% mgmt
Financing live
Cash to close
- Down payment
- $26,250
- Closing costs
- $3,150
- Reserves months
- —
- Total cash needed
- —
Loan-product check · same deal, 3 products live
Conventional
25% down · 7.5% · 30yr
- Down + closing
- —
- Monthly P&I
- —
- Monthly cashflow
- —
- DSCR
- —
- Eligible?
- —
Personal DTI + credit; lowest rate.
DSCR
20% down · 8.5% · 30yr
- Down + closing
- —
- Monthly P&I
- —
- Monthly cashflow
- —
- DSCR
- —
- Eligible?
- —
No personal income docs; deal must DSCR.
Hard money
10% down · 12.0% · 12mo
- Down + closing
- —
- Monthly P&I
- —
- Monthly cashflow
- —
- DSCR
- —
- Eligible?
- —
Short-term bridge; refi at stabilization.
Rent comps 7 comps
| Address | Beds | Baths | Sqft | Rent | $/sqft | DOM | Units | Dist |
|---|---|---|---|---|---|---|---|---|
| 1043 Arrowhead Rdg Independence, MO | 2.0 | 1.0 | 800 | $1,095 | $1.37 | 1d | 1 | 0.88mi |
| 1103 N Aztec Ct Unit 1 Independence, MO | 2.0 | 1.0 | 800 | $950 | $1.19 | 43d | 1 | 0.94mi |
| 18717 E Blackhawk Trl Independence, MO | 2.0 | 1.0 | 780 | $1,100 | $1.41 | 43d | 1 | 1.01mi |
| 17013 E US Highway 24 Apt 9 Independence, MO | 2.0 | 1.0 | 780 | $1,050 | $1.35 | 23d | 1 | 1.07mi |
| 17013 E US Highway 24 Independence, MO | 1.0–2.0 | 1.0 | 686 | $1,050 | $1.53 | 4d | 4 | 1.07mi |
| 17013 E US Highway 24 Independence, MO | 1.0–2.0 | 1.0 | 687 | $1,050 | $1.53 | 10d | 4 | 1.07mi |
| 16005 E Cogan Ln Independence, MO | 4.0 | 2.0 | 1080 | $1,851 | $1.71 | 1d | 1 | 1.47mi |
Listing history 7 events
-
2026-06-19status $105,000 Pending 2 DOM
-
2026-06-18days on market $105,000 Active 2 DOM
-
2026-06-17statusdays on market $105,000 Active 1 DOM
-
2026-06-16remarks 645-char remark
-
2026-06-16days on market $105,000 Coming Soon 3 DOM
-
2026-06-15remarks 588-char remark
-
2026-06-15$105,000 Coming Soon 2 DOM
ⓘ Source: listings_history table (triggers on properties + properties_extension) + one-shot
backfill from property_details.listing_events for pre-trigger history.
Tax reassessment forecast MO · Resets to sale price
- Current annual tax
- $1,962 · $163/mo
- Projected year-2 tax
- $1,962 · $163/mo
- Expected delta
- $0/yr ($0/mo · -0.0%)
ⓘ Screening estimate from a state-policy table — verify with the county assessor before closing.
Climate risk First Street
- Flood 1/10 Low FEMA zone X (unshaded) · 0% chance over 30 yrs
- Wildfire 1/10 Low
- Heat 4/10 Moderate 7 d/yr ≥107°F today · 17 d/yr by 30 yrs out
- Wind 2/10 Low
- Air quality 3/10 Moderate 3 unhealthy d/yr today · 3 by 30 yrs out
Nearby sold comps map
Loading sold comps map…
Walkable amenities ~0.75 mi
Loading nearby amenities…
Taxation est. · year 1
- Rental income
- $17,411
- − Mortgage interest
- −$5,882
- − Property taxes
- −$1,962
- − Insurance
- −$525
- − Repairs & maintenance
- −$1,393
- − Management
- −$1,393
- − Depreciation
- −$3,055
- Taxable income
- $3,202
- Est. tax owed @ 24.0%
- −$769
- After-tax cash flow
- $3,892/yr
For passive investors: Depreciation is non-cash, so a rental often shows a tax loss while cash-flowing — sheltering income. Rental losses are passive: they offset passive income freely, and up to $25,000/yr can offset ordinary (W-2) income if you actively participate and your MAGI is under $100k (phasing out to $0 by $150k); unused losses carry forward. On sale, claimed depreciation is recaptured at up to 25%, and gains may owe capital-gains tax (a 1031 exchange can defer both). Figures are a year-1 estimate at your 24.0% rate — not tax advice; consult a CPA.
Schools (NCES district)
- District
- Fort Osage R-I
- NCES district ID
- 2912290
- Math proficiency
- 28% ▼ -7.00%
- Reading proficiency
- 39% ▼ -5.00%
- Median HH income
- $57,441
- Composite
- 29.78/100
- National rank
- #6428
- State rank
- #213 of 324 in MO
Livability — Independence
- Score
- 82/100
- State rank
- #10
- US rank
- #1296
Category grades
Schools grade is shown separately in the Schools card above.
Census & demographics
- Census place
- Independence, MO
- County
- Jackson County · 687,798 people
- City population
- 117,675
- Metro
- Kansas City, MO-KS
- Population (ZIP)
- 17,395
- Household income
- $67,685
- Rent vs Own
- Severe rent burden
- 747.0
Population outlook (Jackson County) Hauer SSP2
- Today (2025)
- 719,589 people
- By 2030
- 731,456 · +1.6%
- By 2040
- 746,689 · +3.8%
- By 2050
- 749,289 · +4.1%
- By 2075
- 736,227 · +2.3%
- By 2100
- 668,210 · -7.1%
Race, ethnicity, and origin ACS 2023
- Neighborhood character
- Predominantly White (69%)
- Race & ethnicity
- White 69% Black 14% Hispanic / Latino 8% Two or more races 7% Pacific Islander 1%
- Hispanic origin (detail)
- Mexican 6%
- Common ancestry
- Italian 9% Lithuanian 2% Slovak 2%
- Foreign-born
- 3% · Canada
- Languages at home
- 96% English-only · Spanish 4%
Political lean MEDSL · Jackson
- 2024 margin
- D (+19.3) · D 58.9% · R 39.5% · Other 1.6%
- 2008→2024 swing
- -6.1pp toward R · 2008: 25.4pp · 2024: 19.3pp
- All cycles
- 2024: D+19.3 2020: D+22.0 2016: D+16.6 2012: D+19.0 2008: D+25.4
Not yet ingested
- Civics
- —
Market trends
- HPI YoY
- ▼ -163.60%
- Current HPI
- 286.349
- Rent YoY
- ▲ 3.76%
- Metro
- Kansas City, MO-KS
- State GDP YoY
- ▲ 1.84%
- F500 in state
- 20
Industry mix (Fortune 500 HQ in MO)
| Industry | F500 HQs | Revenue |
|---|---|---|
| Healthcare | 1 | $163B |
|
||
| Insurance | 1 | $21B |
|
||
| Industrial Technology | 1 | $17B |
|
||
| Retail | 1 | $16B |
|
||
| Industrial Distribution | 1 | $10B |
|
||
| Utilities | 1 | $9B |
|
||
Price history
+50.0% since first listed4 events — show timeline
- 2026-06-14 Coming Soon $105,000 Heartland MLS as Distributed by MLS Grid
- 2010-05-21 Sold (Public Records) — Public Records
- 2010-05-20 Sold (MLS) — Heartland MLS as Distributed by MLS Grid
- 2010-04-19 Listed $70,000 Heartland MLS as Distributed by MLS Grid
Property tax history
+5.3%/yrLatest (2025): $1,962 · +13.0% YoY. Source: county tax records.
Cash-flow waterfall
monthlySold comps — $/sqft
last 12 mo · ≤1 miLoading sold comps…