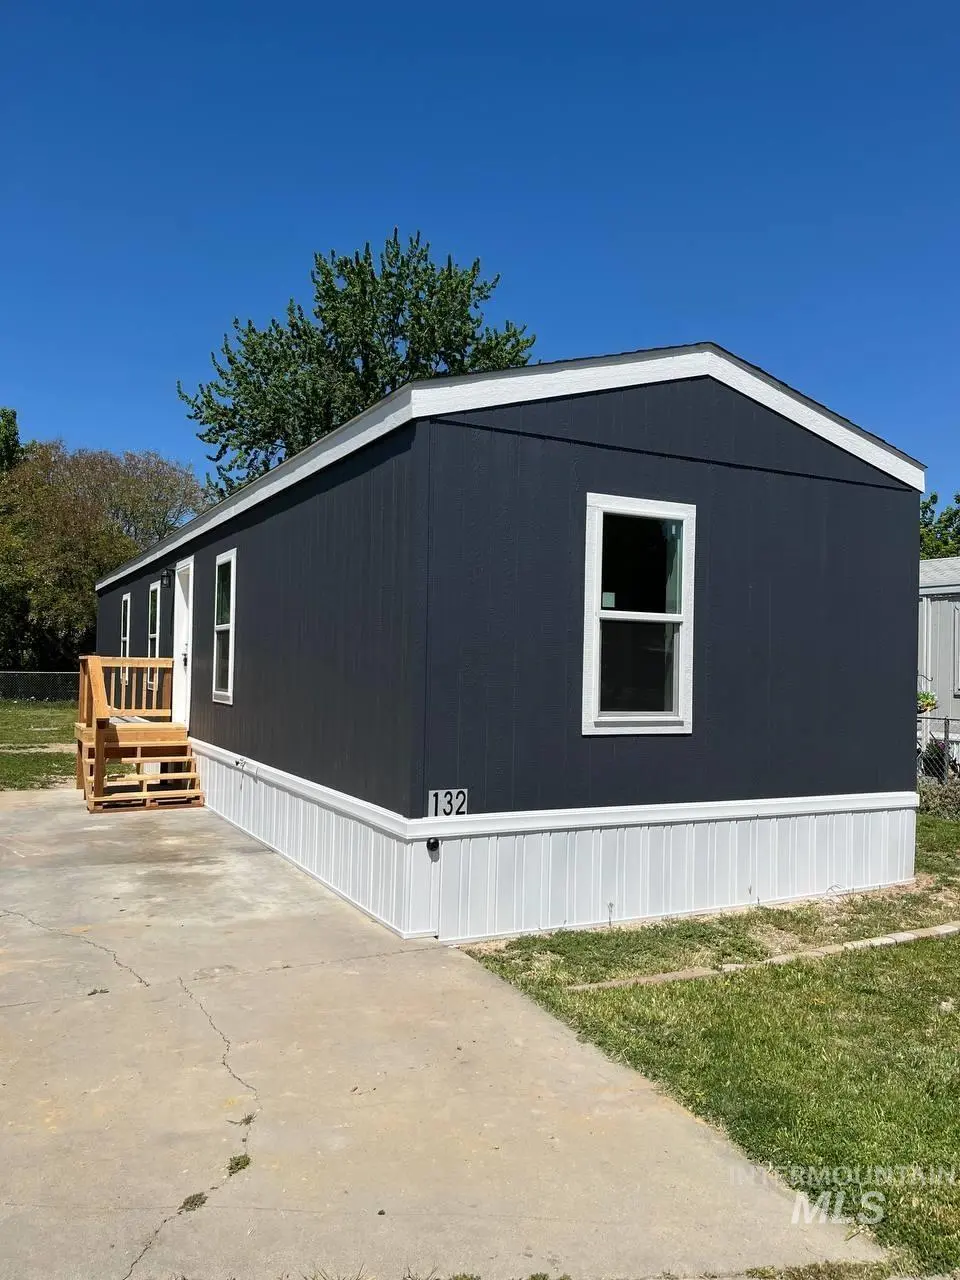
424 W Cherry Ln #132 · Meridian, ID
Flood risk 1/10 · Minimal
- FEMA flood zone
- X (unshaded)
- Chance of flooding over 30 yrs
- 0.0%
- Est. flood insurance / yr
- $507 – $1,088
Fire risk 1/10 · Minimal
- Est. fire insurance / yr
- $584 – $1,086
Heat risk 5/10 · Moderate
- Hot days now (above 96°F)
- 7 days/yr
- Hot days in 30 yrs
- 17 days/yr
Wind risk 1/10 · Minimal
- Chance of severe wind over 30 yrs
- —
Air-quality risk 7/10 · Major
- Unhealthy air days now
- 12 days/yr
- Unhealthy air days in 30 yrs
- 16 days/yr
Risk factors via First Street. Map © Google.
Why this score? — see what drove the D+ grade
The composite is a weighted blend of 9 inputs, each scored 0–100. Each bar is that input's sub-score; the figure is the points it added to the 100-point composite (weight × sub-score).
- Cash flow +14.6/30.0
- 1% rule +10.0/10.0
- Schools +5.2/10.0
- DSCR +4.5/10.0
- Livability +4.1/5.0
- Condition / age +4.0/5.0
- Rent growth +3.5/5.0
- ARV discount +3.4/15.0
- Appreciation +0.0/10.0
$114,900
🖨 Deal sheet 📄 Offer letter ✓ Due diligence
Listing remarks
* Seller offering two free months of lot rent with full price offer until end of May * Welcome to your brand new 2026 home in Embassy Park! This move-in ready home offers the peace of mind of being completely maintenance-free, so you can spend more time enjoying life and less time on upkeep. Embassy Park is one of the most desirable communities in the Boise/Meridian area, known for being exceptionally clean, safe, and well-maintained. It’s a friendly, all-ages park that provides a welcoming environment for everyone. Located just minutes from all your shopping, dining, and everyday needs, you’ll have convenience and comfort no matter your destination. Plus, enjoy low lot rent at
Key facts
- Built 2026
- Listed 31 days
Property features AI
Finance
- HOA & community: Monthly association fee of $645
Exterior
- Utilities: City water; Sewer connected
- Home design: Mobile/manufactured home; New construction (builder: Cavco, completed 2026)
- Construction: Built in 2026
- Exterior features: Storage shed; Located in Embassy Mobile subdivision (mobile/manufactured home on rented lot)
Interior
- Kitchen: Dishwasher; Oven/Range (freestanding); Refrigerator
- Bedrooms: 3 bedrooms, all on the main level
- Bathrooms: 2 bathrooms
- Heating & cooling: Electric heating; No central cooling
- Interior features: Breakfast bar
- Laundry & utility: Electric water heater
Neighborhood map
What this means for you Summary
Snapshot
- This is a 3-bed/2.0-bath manufactured listed at $115k. Condition is rated good.
Deal economics
- At list price, monthly cash flow is $28 ($331/yr) — positive.
- The deal already cash-flows at list — no discount required.
- Meets the 1% rule at list price ($2k rent vs $115k).
- Recommended offer: $111k (3.0% below list) — sets the bar for market timing.
- Cap rate 6.6% vs local median 3.1% in Meridian — top-decile yield for the area; either an underpriced asset or a hidden risk that comps aren't pricing in. Stress-test before assuming the spread holds.
Location & tenants
- Location reads 82/100 on livability (#10 in ID, #1,176 nationally) — a professional / high-income tenant draw. Strengths: crime A+, commute A+, employment A+; Watch: cost of living D+.
- Joint School District No. 2 (suburban): math 53% / reading 67% proficiency, ranked #11 of 92 in ID (top 12%) — acceptable for families but not a draw, mixed tenant base, ~2y average lease.
- Zoned schools: Meridian Elementary School (math 37% / reading 47%, grade F, #217 of 357 statewide, top 62%, 448 students, 66% FRL); Meridian Academy (math 10% / reading 30%, grade F, #141 of 169 statewide, top 87%, 171 students, 40% FRL) — zoned schools average 53% FRL vs 23% district-wide (31 pts higher); higher-poverty schools than district average — tighter screening recommended.
- Zoned-school proficiency averages 31% at this address vs 60% district-wide (-29 pts) — the specific schools serving this property underperform the Joint School District No. 2 average; the district grade overstates school quality for this exact location.
- Market conditions: Rents rising (+3.8%/yr); 748 active listings in the ZIP; 9 comparable units currently listed for rent nearby; rentals leasing fast (median 3d on market — plan ~1-2 weeks tenant-placement turnaround); solid renter incomes; 5,129 units permitted in Ada County in 2024 (414 in 5+ unit buildings).
Forward outlook
- Local home prices are declining (-3.0%/yr); year-one equity from $794 of loan paydown is wiped out by about $3k of value loss. Plan a longer hold.
- Ada County population projected at +45% by 2050 — long-run rental-demand tailwind backs the buy-and-hold thesis.
Negotiation context
- It's been on market 31 days — a 3% lower offer ($111k) is reasonable based on typical stale-listing flexibility.
Risks & watch-outs
- Watch-outs: HOA is 35% of rent.
- Climate carrying-cost: extreme-heat days projected 7→17/yr by 2055 (HVAC capex compounding) — expect insurance premiums to compound above CPI over the hold.
Questions for the listing agent
- It's been on market 31 days. Have you received any prior offers? Is the seller open to a 3% concession, seller financing, or rate buy-down credit?
- What does the HOA fee cover, when was the last increase, and are there any pending special assessments or reserve-fund shortfalls?
- Is there a deadline driving the sale (1031 exchange, divorce, estate, relocation)? That informs how much negotiation room exists.
- Schools are A-rated — typically a magnet for longer-tenancy family renters. What's the average tenant stay here, and is there a school-zone premium baked into asking?
- The area grade is low — what's the realistic commute time and amenity access for the typical tenant pool here? Any planned neighborhood developments (good or bad) we should know about?
- What's the average days-on-market for RENTAL listings here right now (not sales)? A rising rental-DOM trend means longer vacancies and softer asking-rent achievability than the comps imply.
- What's the recent tenant-quality profile in this submarket — average credit score on applications, eviction rate, late-payment / NSF rate, and stable-employment percentage? A property-management company in the area should have these aggregated.
- How much new for-sale + rental construction is in the pipeline within 1–3 miles? Heavy new supply typically softens prices + rents 12–24 months out; constrained supply supports both.
Investment metrics
- 1% rule
- 1.62% ✓
- Cap rate
- 6.58%
- Cash-on-cash
- 1.03%
- DSCR
- 1.05
- GRM
- 5.2
CMA / ARV
- ARV (on-the-fly)
- $105,300
- Comps found
- 9
Show comp detail 9 sales within ~0.75 mi
| Address | Dist | Beds/Ba | Sqft | Sold | Price | $/sf | Match |
|---|---|---|---|---|---|---|---|
| 424 W Cherry Ln #132 | 0.00mi | 3/2.0 | 900 (0%) | 0mo | $114,900 | $128 | 100 |
| 424 W Cherry Ln #42 | 0.00mi | 2/2.0 (-1) | 924 (+3%) | 3mo | $153,400 | $166 | 88 |
| 424 W Cherry Ln #124 | 0.10mi | 3/2.0 | 900 (0%) | 9mo | $104,900 | $117 | 88 |
| 424 W Cherry Ln #14 | 0.10mi | 2/2.0 (-1) | 924 (+3%) | 13mo | $97,900 | $106 | 76 |
| 424 W Cherry Ln #67 | 0.00mi | 2/1.0 (-1) | 780 (-13%) | 1mo | $99,500 | $128 | 68 |
| 314 W Cherry Ln #30 | 0.14mi | 2/2.0 (-1) | 924 (+3%) | 22mo | $94,900 | $103 | 65 |
| 424 W W Cherry Ln #128 | 0.02mi | 3/2.0 | 1,031 (+15%) | 23mo | $124,900 | $121 | 56 |
| 424 W Cherry Ln #81 | 0.13mi | 2/2.0 (-1) | 990 (+10%) | 21mo | $115,000 | $116 | 55 |
| 700 E Fairview Ave #31 | 0.72mi | 2/2.0 (-1) | 826 (-8%) | 9mo | $74,900 | $91 | 40 |
Match score weights: distance 35% · size 25% · config 20% · recency 20%. Top-matched comps best support the ARV.
Projected returns pro-forma
-3.0% appreciation · 3.84% rent growth · sell at horizon
- IRR
- -12.6%
- Equity multiple
- 0.54×
- Total profit
- $-14,857
- Equity at exit
- $17,132
- IRR
- -1.0%
- Equity multiple
- 0.93×
- Total profit
- $-2,348
- Equity at exit
- $9,934
Cash invested: $32,172 (down + closing). Projections, not guarantees.
Landlord ↔ Tenant lean methodology
- Overall (STATE)
- 91 Strongly Landlord-Friendly
- State Idaho
- 91 Strongly Landlord-Friendly · R+18
- County
- — inherits STATE
- City
- — inherits STATE
ZIP-level market 83642
- Rents YoY
- 3.8%
- Active inventory
- 748
- Price-to-rent
- 5.2×
Monthly cashflow live
- Estimated rent
- $1,856 high interval (Pro) →
- Mortgage (P&I)
- −$603
- Tax est. 1.5%
- −$144 /mo · $1,724/yr
- Insurance
- −$48
- HOA
- −$645
- Vacancy / Maint / Mgmt
- −$390
- Net cashflow
- $28
Break-even live
UW: 25.0% down · 7.5% · 30yr · 1.5% tax · 5.0% vac · 8.0% maint · 8.0% mgmt
Financing live
Cash to close
- Down payment
- $28,725
- Closing costs
- $3,447
- Reserves months
- —
- Total cash needed
- —
Loan-product check · same deal, 3 products live
Conventional
25% down · 7.5% · 30yr
- Down + closing
- —
- Monthly P&I
- —
- Monthly cashflow
- —
- DSCR
- —
- Eligible?
- —
Personal DTI + credit; lowest rate.
DSCR
20% down · 8.5% · 30yr
- Down + closing
- —
- Monthly P&I
- —
- Monthly cashflow
- —
- DSCR
- —
- Eligible?
- —
No personal income docs; deal must DSCR.
Hard money
10% down · 12.0% · 12mo
- Down + closing
- —
- Monthly P&I
- —
- Monthly cashflow
- —
- DSCR
- —
- Eligible?
- —
Short-term bridge; refi at stabilization.
Rent comps 9 comps
| Address | Beds | Baths | Sqft | Rent | $/sqft | DOM | Units | Dist |
|---|---|---|---|---|---|---|---|---|
| 1374 W Sandalwood Dr Meridian, ID | 2.0 | 1.0 | 795 | $1,295 | $1.63 | 14d | 1 | 0.58mi |
| 511 W Pine Ave Unit D Meridian, ID | 2.0 | 1.0 | 700 | $1,195 | $1.71 | 3d | 1 | 0.64mi |
| 537 W Idaho Ave Meridian, ID | 2.0 | 1.5 | 1000 | $1,500 | $1.50 | 14d | 1 | 0.70mi |
| 539 W Idaho Ave Meridian, ID | 2.0 | 1.5 | 1100 | $1,500 | $1.36 | 14d | 1 | 0.70mi |
| 1069 W Pine Ave #3 Meridian, ID | 2.0 | 2.0 | 1014 | $1,496 | $1.48 | 3d | 1 | 0.78mi |
| 1033 W Pine Ave Apt 3 Meridian, ID | 2.0 | 2.0 | 1014 | $1,401 | $1.38 | 3d | 1 | 0.79mi |
| 3104 N Venable Ln Meridian, ID | 1.0–3.0 | 1.0–2.5 | 1164 | $2,595 | $2.23 | 3d | 17 | 0.82mi |
| 1440 N Locust Grove Rd Meridian, ID | 2.0–3.0 | 2.5–3.0 | 1112 | $2,275 | $2.04 | 3d | 9 | 1.39mi |
| 303 W Pennwood St Meridian, ID | 1.0–3.0 | 1.0–2.0 | 1012 | $2,288 | $2.26 | 3d | 13 | 1.47mi |
HOA detail
- Monthly dues
- $645 · $7,740/yr
Listing history 6 events
-
2026-06-07statusdays on market $114,900 Pending 31 DOM
-
2026-06-03days on market $114,900 Active 30 DOM
-
2026-06-03days on market $114,900 Active 29 DOM
-
2026-06-01days on market $114,900 Active 28 DOM
-
2026-05-31days on market $114,900 Active 27 DOM
-
2026-05-04$114,900 Active
ⓘ Source: listings_history table (triggers on properties + properties_extension) + one-shot
backfill from property_details.listing_events for pre-trigger history.
Climate risk First Street
- Flood 1/10 Low FEMA zone X (unshaded) · 0% chance over 30 yrs
- Wildfire 1/10 Low
- Heat 5/10 Major 7 d/yr ≥96°F today · 17 d/yr by 30 yrs out
- Wind 1/10 Low
- Air quality 7/10 Severe 12 unhealthy d/yr today · 16 by 30 yrs out
Nearby sold comps map
Loading sold comps map…
Walkable amenities ~0.75 mi
Loading nearby amenities…
Taxation est. · year 1
- Rental income
- $22,278
- − Mortgage interest
- −$6,436
- − Property taxes
- −$1,724
- − Insurance
- −$574
- − Repairs & maintenance
- −$1,782
- − Management
- −$1,782
- − HOA
- −$7,740
- − Depreciation
- −$3,343
- Taxable loss
- −$1,104
- Est. tax savings @ 24.0%
- +$265
- After-tax cash flow
- $596/yr
For passive investors: Depreciation is non-cash, so a rental often shows a tax loss while cash-flowing — sheltering income. Rental losses are passive: they offset passive income freely, and up to $25,000/yr can offset ordinary (W-2) income if you actively participate and your MAGI is under $100k (phasing out to $0 by $150k); unused losses carry forward. On sale, claimed depreciation is recaptured at up to 25%, and gains may owe capital-gains tax (a 1031 exchange can defer both). Figures are a year-1 estimate at your 24.0% rate — not tax advice; consult a CPA.
Condition & rehab AI · 3 photos
This move-in ready manufactured home in Embassy Park offers a good condition with no visible repairs needed. It's located in a desirable community with low maintenance and ample amenities.
Value-add opportunities
- Both Painting exterior — Enhances curb appeal and value
- Both Landscaping improvements — Enhances curb appeal and value
- Both Add smart home features — Improves convenience and marketability
Renovation cost estimate screening
Value-add ROI direction
- Both Painting exterior — Enhances curb appeal and value ↑
- Both Landscaping improvements — Enhances curb appeal and value ↑
- Both Add smart home features — Improves convenience and marketability ↑
ⓘ Cost ranges are severity-bucket heuristics (US national rule-of-thumb). Get contractor quotes + a written scope before underwriting a rehab budget.
Schools (NCES district)
- District
- Joint School District No. 2
- NCES district ID
- 1602100
- Math proficiency
- 53% ▼ -6.00%
- Reading proficiency
- 67% ▼ -1.00%
- Median HH income
- $64,573
- Composite
- 52.42/100
- National rank
- #1576
- State rank
- #11 of 92 in ID
Livability — Meridian
- Score
- 82/100
- State rank
- #10
- US rank
- #1176
Category grades
Schools grade is shown separately in the Schools card above.
Census & demographics
- Census place
- Meridian, ID
- County
- Ada County · 522,161 people
- City population
- 138,302
- Metro
- Boise City, ID
- Population (ZIP)
- 62,279
- Household income
- $96,909
- Rent vs Own
- Severe rent burden
- 1574.0
Population outlook (Ada County) Hauer SSP2
- Today (2025)
- 535,818 people
- By 2030
- 585,751 · +9.3%
- By 2040
- 682,435 · +27.4%
- By 2050
- 775,818 · +44.8%
- By 2075
- 994,458 · +85.6%
- By 2100
- 1,148,884 · +114.4%
Race, ethnicity, and origin ACS 2023
- Neighborhood character
- Predominantly White (83%)
- Race & ethnicity
- White 83% Hispanic / Latino 9% Two or more races 7% Asian 3%
- Hispanic origin (detail)
- Mexican 7%
- Common ancestry
- Portuguese 3% Slovak 3% Lithuanian 3%
- Foreign-born
- 5% · Canada, South Korea, Jamaica
- Languages at home
- 93% English-only · Spanish 4% Russian/Polish/Slavic 1% Other Indo-European 1%
Political lean MEDSL · Ada
- 2024 margin
- R (+10.3) · D 43.4% · R 53.8% · Other 2.8%
- 2008→2024 swing
- -4.2pp toward R · 2008: -6.2pp · 2024: -10.3pp
- All cycles
- 2024: R+10.3 2020: R+3.9 2016: R+9.2 2012: R+11.3 2008: R+6.2
Not yet ingested
- Civics
- —
Market trends
- HPI YoY
- ▼ -178.45%
- Current HPI
- 321.2588
- Rent YoY
- ▲ 3.84%
- Metro
- Boise City, ID
- State GDP YoY
- ▲ 4.51%
- F500 in state
- 6
Industry mix (Fortune 500 HQ in ID)
| Industry | F500 HQs | Revenue |
|---|---|---|
| Retail | 1 | $79B |
|
||
| Technology | 1 | $25B |
|
||
| Food / Agriculture | 1 | $6B |
|
||
Price history
1 event — show timeline
- 2026-05-04 Listed $114,900 IMLS
Cash-flow waterfall
monthlySold comps — $/sqft
last 12 mo · ≤1 miLoading sold comps…