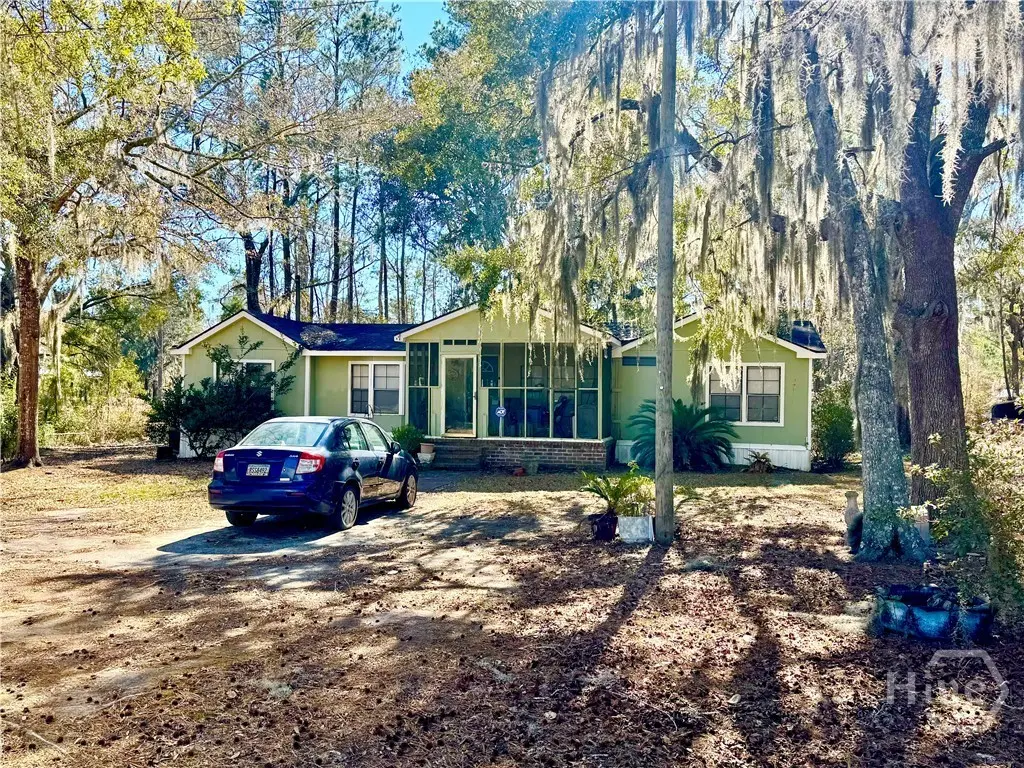
49 Clem Rd · Midway, GA
Flood risk 1/10 · Minimal
- FEMA flood zone
- X (unshaded)
- Chance of flooding over 30 yrs
- 0.0%
- Est. flood insurance / yr
- $507 – $1,088
Fire risk 5/10 · Moderate
- Est. fire insurance / yr
- $963 – $1,789
Heat risk 9/10 · Severe
- Hot days now (above 107°F)
- 7 days/yr
- Hot days in 30 yrs
- 19 days/yr
Wind risk 9/10 · Severe
- Chance of severe wind over 30 yrs
- 99.0%
Air-quality risk 2/10 · Minimal
- Unhealthy air days now
- 2 days/yr
- Unhealthy air days in 30 yrs
- 2 days/yr
Risk factors via First Street. Map © Google.
Why this score? — see what drove the C grade
The composite is a weighted blend of 9 inputs, each scored 0–100. Each bar is that input's sub-score; the figure is the points it added to the 100-point composite (weight × sub-score).
- Cash flow +21.9/30.0
- ARV discount +15.0/15.0
- DSCR +7.0/10.0
- 1% rule +5.7/10.0
- Livability +3.2/5.0
- Rent growth +2.5/5.0
- Condition / age +2.5/5.0
- Schools +2.0/10.0
- Appreciation +0.0/10.0
$179,000
🖨 Deal sheet 📄 Offer letter ✓ Due diligence
Listing remarks MLS
Sitting on a full acre with beautiful mature oaks, this home offers plenty of space and a peaceful setting—but what really makes it stand out is the location. The house could use some TLC, but you won’t find a more convenient spot for enjoying everything Coastal Georgia has to offer. You’re only about 7 minutes from the Medway River, the public boat ramp, and the marina, making quick trips for boating, fishing, or kayaking simple and stress-free. Grabbing fresh seafood at the well-known Sunbury Crab Company is just as easy. Plus, you’re only 20 minutes from Richmond Hill and 25 minutes from Savannah, so everyday needs like shopping, dining, and commuting are all within comfortable reach. This property gives you the best of both worlds—a quiet, spacious environment with all the essentials and local favorites just a short drive away. It’s a great option for anyone who wants room to spread out while still staying close to the amenities that make life convenient.
Key facts
- Mature oaks
- Public boat ramp
- Full acre
Tags
Neighborhood map
What this means for you Summary
Snapshot
- This is a 3-bed/2.0-bath manufactured listed at $179k.
Deal economics
- At list price, monthly cash flow is $283 ($3k/yr) — positive.
- The deal already cash-flows at list — no discount required.
- Meets the 1% rule at list price ($2k rent vs $179k).
- Recommended offer: $163k (9.0% below list) — sets the bar for market timing.
- Cap rate 8.2% vs local median 4.3% in Midway — top-decile yield for the area; either an underpriced asset or a hidden risk that comps aren't pricing in. Stress-test before assuming the spread holds.
Location & tenants
- Location reads 65/100 on livability (#219 in GA) — a middle-class / working-renter tenant base. Strengths: crime A+, cost of living A+, housing A+; Watch: schools D-, amenities F, commute F.
- Liberty County (urban): math 19% / reading 28% proficiency, ranked #133 of 174 in GA (top 76%) — low school quality limits family demand, transient renter base, plan for 1-2y turnover.
- Market conditions: 211 active listings in the ZIP; solid renter incomes; 471 units permitted in Liberty County in 2024 (0 in 5+ unit buildings).
Forward outlook
- Local home prices are declining (-3.0%/yr); year-one equity from $1k of loan paydown is wiped out by about $5k of value loss. Plan a longer hold.
- Liberty County population projected to shrink 8% by 2050 — rents likely to lag national; underwrite the cash flow, not the appreciation.
Negotiation context
- It's been on market 120 days — a 9% lower offer ($163k) is reasonable based on typical stale-listing flexibility.
- 4 sale attempts since 4y ago with the ask held roughly flat each time — persistent listings suggest the price (not the market) is what's stuck; bring a comps-based counter.
Risks & watch-outs
- Climate carrying-cost: severe wind risk, 99% chance of damaging wind over 30y; moderate wildfire risk; extreme-heat days projected 7→19/yr by 2055 (HVAC capex compounding) — expect insurance premiums to compound above CPI over the hold.
Questions for the listing agent
- It's been on market 120 days. Have you received any prior offers? Is the seller open to a 9% concession, seller financing, or rate buy-down credit?
- Why hasn't it sold? Are there any deal-killer items the seller is aware of (foundation, flood, title, zoning, code violations)?
- Is there a deadline driving the sale (1031 exchange, divorce, estate, relocation)? That informs how much negotiation room exists.
- Schools are D-rated, which usually means shorter tenancies and higher turnover. Who's the typical renter profile here, and what's been the actual vacancy rate?
- What's the average days-on-market for RENTAL listings here right now (not sales)? A rising rental-DOM trend means longer vacancies and softer asking-rent achievability than the comps imply.
- What's the recent tenant-quality profile in this submarket — average credit score on applications, eviction rate, late-payment / NSF rate, and stable-employment percentage? A property-management company in the area should have these aggregated.
- How much new for-sale + rental construction is in the pipeline within 1–3 miles? Heavy new supply typically softens prices + rents 12–24 months out; constrained supply supports both.
Investment metrics
- 1% rule
- 1.07% ✓
- Cap rate
- 8.19%
- Cash-on-cash
- 6.77%
- DSCR
- 1.30
- GRM
- 7.8
CMA / ARV
- ARV (on-the-fly)
- $257,152
- Comps found
- 1
Show comp detail 1 sale within ~0.75 mi
| Address | Dist | Beds/Ba | Sqft | Sold | Price | $/sf | Match |
|---|---|---|---|---|---|---|---|
| 2958 Islands Hwy | 0.69mi | 3/2.0 | 1,493 (-5%) | 20mo | $245,000 | $164 | 43 |
Match score weights: distance 35% · size 25% · config 20% · recency 20%. Top-matched comps best support the ARV.
Projected returns pro-forma
-3.0% appreciation · 3.0% rent growth · sell at horizon
- IRR
- -5.9%
- Equity multiple
- 0.78×
- Total profit
- $-10,958
- Equity at exit
- $26,689
- IRR
- 3.8%
- Equity multiple
- 1.27×
- Total profit
- $13,779
- Equity at exit
- $15,477
Cash invested: $50,120 (down + closing). Projections, not guarantees.
Landlord ↔ Tenant lean methodology
- Overall (STATE)
- 90 Strongly Landlord-Friendly
- State Georgia
- 90 Strongly Landlord-Friendly · R+3
- County
- — inherits STATE
- City
- — inherits STATE
ZIP-level market 31320
- Home prices YoY
- -9.7%
- Active inventory
- 211
- Price-to-rent
- 7.8×
Monthly cashflow live
- Estimated rent
- $1,924 medium interval (Pro) →
- Mortgage (P&I)
- −$939
- Tax est. 1.5%
- −$224 /mo · $2,685/yr
- Insurance
- −$75
- HOA
- −$0
- Vacancy / Maint / Mgmt
- −$404
- Net cashflow
- $283
Break-even live
UW: 25.0% down · 7.5% · 30yr · 1.5% tax · 5.0% vac · 8.0% maint · 8.0% mgmt
Financing live
Cash to close
- Down payment
- $44,750
- Closing costs
- $5,370
- Reserves months
- —
- Total cash needed
- —
Loan-product check · same deal, 3 products live
Conventional
25% down · 7.5% · 30yr
- Down + closing
- —
- Monthly P&I
- —
- Monthly cashflow
- —
- DSCR
- —
- Eligible?
- —
Personal DTI + credit; lowest rate.
DSCR
20% down · 8.5% · 30yr
- Down + closing
- —
- Monthly P&I
- —
- Monthly cashflow
- —
- DSCR
- —
- Eligible?
- —
No personal income docs; deal must DSCR.
Hard money
10% down · 12.0% · 12mo
- Down + closing
- —
- Monthly P&I
- —
- Monthly cashflow
- —
- DSCR
- —
- Eligible?
- —
Short-term bridge; refi at stabilization.
Listing history 25 events
-
2026-06-19days on market $179,000 Active 120 DOM
-
2026-06-18days on market $179,000 Active 119 DOM
-
2026-06-17days on market $179,000 Active 118 DOM
-
2026-06-16days on market $179,000 Active 117 DOM
-
2026-06-15days on market $179,000 Active 116 DOM
-
2026-06-14days on market $179,000 Active 114 DOM
-
2026-06-13days on market $179,000 Active 113 DOM
-
2026-06-10days on market $179,000 Active 111 DOM
-
2026-06-09days on market $179,000 Active 110 DOM
-
2026-06-08days on market $179,000 Active 109 DOM
-
2026-06-07days on market $179,000 Active 108 DOM
-
2026-06-05pricedays on market $179,000 Active 105 DOM
-
2026-06-03days on market $182,500 Active 104 DOM
-
2026-06-02days on market $182,500 Active 103 DOM
-
2026-06-01days on market $182,500 Active 102 DOM
-
2026-05-31days on market $182,500 Active 101 DOM
-
2026-05-30days on market $182,500 Active 100 DOM
-
2026-04-09price $182,500 1009-char remark
Show marketing remark (1009 chars)
Sitting on a full acre with beautiful mature oaks, this home offers plenty of space and a peaceful setting—but what really makes it stand out is the location. The house could use some TLC, but you won’t find a more convenient spot for enjoying everything Coastal Georgia has to offer. You’re only about 7 minutes from the Medway River, the public boat ramp, and the marina, making quick trips for boating, fishing, or kayaking simple and stress-free. Grabbing fresh seafood at the well-known Sunbury Crab Company is just as easy. Plus, you’re only 20 minutes from Richmond Hill and 25 minutes from Savannah, so everyday needs like shopping, dining, and commuting are all within comfortable reach. This property gives you the best of both worlds—a quiet, spacious environment with all the essentials and local favorites just a short drive away. It’s a great option for anyone who wants room to spread out while still staying close to the amenities that make life convenient.
-
2026-02-16$187,500 Active 1009-char remark
Show marketing remark (1009 chars)
Sitting on a full acre with beautiful mature oaks, this home offers plenty of space and a peaceful setting—but what really makes it stand out is the location. The house could use some TLC, but you won’t find a more convenient spot for enjoying everything Coastal Georgia has to offer. You’re only about 7 minutes from the Medway River, the public boat ramp, and the marina, making quick trips for boating, fishing, or kayaking simple and stress-free. Grabbing fresh seafood at the well-known Sunbury Crab Company is just as easy. Plus, you’re only 20 minutes from Richmond Hill and 25 minutes from Savannah, so everyday needs like shopping, dining, and commuting are all within comfortable reach. This property gives you the best of both worlds—a quiet, spacious environment with all the essentials and local favorites just a short drive away. It’s a great option for anyone who wants room to spread out while still staying close to the amenities that make life convenient.
-
2024-12-07historical
-
2024-04-01historical
-
2023-12-08$172,000
-
2023-12-08$172,000 New
-
2022-07-05historical
-
2022-05-28$129,900
ⓘ Source: listings_history table (triggers on properties + properties_extension) + one-shot
backfill from property_details.listing_events for pre-trigger history.
Climate risk First Street
- Flood 1/10 Low FEMA zone X (unshaded) · 0% chance over 30 yrs
- Wildfire 5/10 Major
- Heat 9/10 Extreme 7 d/yr ≥107°F today · 19 d/yr by 30 yrs out
- Wind 9/10 Extreme 99% chance of damaging wind over 30 yrs
- Air quality 2/10 Low 2 unhealthy d/yr today · 2 by 30 yrs out
Nearby sold comps map
Loading sold comps map…
Walkable amenities ~0.75 mi
Loading nearby amenities…
Taxation est. · year 1
- Rental income
- $23,088
- − Mortgage interest
- −$10,027
- − Property taxes
- −$2,685
- − Insurance
- −$895
- − Repairs & maintenance
- −$1,847
- − Management
- −$1,847
- − Depreciation
- −$5,207
- Taxable income
- $580
- Est. tax owed @ 24.0%
- −$139
- After-tax cash flow
- $3,256/yr
For passive investors: Depreciation is non-cash, so a rental often shows a tax loss while cash-flowing — sheltering income. Rental losses are passive: they offset passive income freely, and up to $25,000/yr can offset ordinary (W-2) income if you actively participate and your MAGI is under $100k (phasing out to $0 by $150k); unused losses carry forward. On sale, claimed depreciation is recaptured at up to 25%, and gains may owe capital-gains tax (a 1031 exchange can defer both). Figures are a year-1 estimate at your 24.0% rate — not tax advice; consult a CPA.
Schools (NCES district)
- District
- Liberty County
- NCES district ID
- 1303300
- Math proficiency
- 19% ▼ -16.00%
- Reading proficiency
- 28% ▼ -13.00%
- Median HH income
- $43,911
- Composite
- 20.2/100
- National rank
- #8630
- State rank
- #133 of 174 in GA
Livability — Midway
- Score
- 65/100
- State rank
- #219
- US rank
- #12952
Category grades
Schools grade is shown separately in the Schools card above.
Census & demographics
- County
- Liberty County · 58,565 people
- City population
- 10,794
- Metro
- Hinesville, GA
- Population (ZIP)
- 10,794
- Household income
- $77,195
- Rent vs Own
- Severe rent burden
- 136.0
Population outlook (Liberty County) Hauer SSP2
- Today (2025)
- 58,689 people
- By 2030
- 57,670 · -1.7%
- By 2040
- 55,750 · -5.0%
- By 2050
- 54,155 · -7.7%
- By 2075
- 58,947 · +0.4%
- By 2100
- 66,919 · +14.0%
Race, ethnicity, and origin ACS 2023
- Neighborhood character
- Diverse neighborhood (Simpson 0.57)
- Race & ethnicity
- White 56% Black 33% Two or more races 8% Hispanic / Latino 5%
- Hispanic origin (detail)
- Mexican 1% Puerto Rican 3%
- Common ancestry
- Italian 2% Slovak 2% Lithuanian 1%
- Foreign-born
- 2% · Canada
- Languages at home
- 96% English-only · Spanish 3% German/W. Germanic 1%
Political lean MEDSL · Liberty
- 2024 margin
- D (+17.4) · D 58.5% · R 41.0%
- 2008→2024 swing
- -10.9pp toward R · 2008: 28.4pp · 2024: 17.4pp
- All cycles
- 2024: D+17.4 2020: D+24.1 2016: D+21.2 2012: D+30.2 2008: D+28.4
Not yet ingested
- Civics
- —
Market trends
- HPI YoY
- ▼ -25.67%
- Current HPI
- 239.3136
- Rent YoY
- —
- Metro
- Hinesville, GA
- State GDP YoY
- ▲ 2.66%
- F500 in state
- 28
Industry mix (Fortune 500 HQ in GA)
| Industry | F500 HQs | Revenue |
|---|---|---|
| Paper / Packaging | 2 | $29B |
|
||
| Retail | 1 | $160B |
|
||
| Transportation / Logistics | 1 | $91B |
|
||
| Airlines | 1 | $62B |
|
||
| Consumer Goods | 1 | $47B |
|
||
| Utilities | 1 | $25B |
|
||
Price history
+40.5% since first listed8 events — show timeline
- 2026-04-09 Price Changed $182,500 Hive MLS
- 2026-02-16 Listed $187,500 Hive MLS
- 2024-12-07 Listing Removed — Hive MLS
- 2024-04-01 Listing Removed — GAMLS
- 2023-12-08 Listed $172,000 GAMLS
- 2023-12-08 Listed $172,000 Hive MLS
- 2022-07-05 Listing Removed — Hive MLS
- 2022-05-28 Listed $129,900 Hive MLS
Property tax history
+72.1%/yrLatest (2018): $202 · +2.7% YoY. Source: county tax records.
Cash-flow waterfall
monthlySold comps — $/sqft
last 12 mo · ≤1 miLoading sold comps…