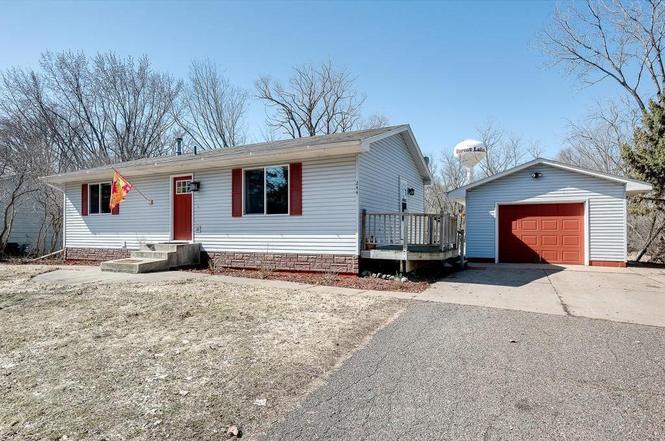
244 5th St NW · Forest Lake, MN
Flood risk 1/10 · Minimal
- FEMA flood zone
- X (unshaded)
- Chance of flooding over 30 yrs
- 0.0%
- Est. flood insurance / yr
- $473 – $860
Fire risk 2/10 · Minimal
- Est. fire insurance / yr
- $888 – $1,650
Heat risk 2/10 · Minimal
- Hot days now (above 100°F)
- 7 days/yr
- Hot days in 30 yrs
- 14 days/yr
Wind risk 2/10 · Minimal
- Chance of severe wind over 30 yrs
- —
Air-quality risk 2/10 · Minimal
- Unhealthy air days now
- 1 days/yr
- Unhealthy air days in 30 yrs
- 2 days/yr
Risk factors via First Street. Map © Google.
Why this score? — see what drove the D- grade
The composite is a weighted blend of 9 inputs, each scored 0–100. Each bar is that input's sub-score; the figure is the points it added to the 100-point composite (weight × sub-score).
- Cash flow +11.2/30.0
- ARV discount +7.5/15.0
- Schools +4.5/10.0
- Livability +3.8/5.0
- DSCR +3.3/10.0
- Rent growth +3.3/5.0
- 1% rule +2.8/10.0
- Condition / age +2.5/5.0
- Appreciation +0.0/10.0
$299,900
🖨 Deal sheet 📄 Offer letter ✓ Due diligence
Listing remarks MLS
Step outside to a generous deck and patio overlooking the peaceful wetland behind the home ? the perfect spot to unwind. A storage shed and detached garage round out this move-in ready package. Don't miss your chance to enjoy everything Forest Lake living has to offer!
Key facts
- Storage shed
- Deck
- Patio
Tags
Property features AI
Exterior
- Parking: Detached or attached 1-car garage (16 x 24, 9' door height)
- Utilities: City water (connected); City sewer (connected); Natural gas
- Home design: Residential property; One level (with lower level/basement)
- Construction: Block foundation
- Exterior features: Wood exterior; Medium tree coverage; City street frontage; Lot approximately 0.342 acres (85 x 174)
Interior
- Kitchen: Dishwasher; Range; Refrigerator
- Bedrooms: 4 bedrooms (mix of main and lower levels)
- Bathrooms: 1 full bath on main level; 1 three-quarter bath in basement
- Heating & cooling: Forced air heating; No central air
- Interior features: Eat-in kitchen; Full basement; Deck; Patio
- Laundry & utility: Washer; Dryer
Neighborhood map
What this means for you Summary
Snapshot
- This is a 4-bed/2.0-bath single-family listed at $300k.
Deal economics
- At list price, monthly cash flow is $-115 ($-1k/yr) — negative.
- To cash-flow at today's rent, offer at most $280k (6.7% below list).
- To meet the 1% rule (rent ≥ 1% of price), the offer needs to be $233k (22.2% below list).
- Recommended offer: $233k (22.2% below list) — sets the bar for 1% rule.
- Cap rate 5.8% vs local median 3.0% in Forest Lake — top-decile yield for the area; either an underpriced asset or a hidden risk that comps aren't pricing in. Stress-test before assuming the spread holds.
Location & tenants
- Location reads 75/100 on livability (#194 in MN, #4,132 nationally) — a middle-class / working-renter tenant base. Strengths: schools A+, employment A+, housing A+; Watch: cost of living C-, amenities F, commute F.
- Forest Lake Public School District (town): math 48% / reading 52% proficiency, ranked #90 of 301 in MN (top 30%) — acceptable for families but not a draw, mixed tenant base, ~2y average lease; only 17% free/reduced lunch — higher-income household profile.
- Market conditions: Rents rising (+3.3%/yr); 164 active listings in the ZIP; 2 comparable units currently listed for rent nearby; solid renter incomes; 1,405 units permitted in Washington County in 2024 (121 in 5+ unit buildings).
Forward outlook
- Local home prices are declining (-3.0%/yr); year-one equity from $2k of loan paydown is wiped out by about $9k of value loss. Plan a longer hold.
- Washington County population projected at +16% by 2050 — long-run rental-demand tailwind backs the buy-and-hold thesis.
Negotiation context
- Only 1 days on market — expect competitive offers; lowballing is unlikely to land.
- 5 sale attempts since 30y ago; this cycle's ask is 23% above the opening price — seller raised mid-cycle; expect resistance to lowballs.
- Current owner paid $245k; 22% above their basis — modest negotiation headroom, anchor on the comps not their cost.
Questions for the listing agent
- What do current leases actually rent for vs. the listed asking? Can we see a recent rent roll and the last 12 months of T-12 income?
- Is there a deadline driving the sale (1031 exchange, divorce, estate, relocation)? That informs how much negotiation room exists.
- Schools are A-rated — typically a magnet for longer-tenancy family renters. What's the average tenant stay here, and is there a school-zone premium baked into asking?
- The area grade is low — what's the realistic commute time and amenity access for the typical tenant pool here? Any planned neighborhood developments (good or bad) we should know about?
- What's the average days-on-market for RENTAL listings here right now (not sales)? A rising rental-DOM trend means longer vacancies and softer asking-rent achievability than the comps imply.
- What's the recent tenant-quality profile in this submarket — average credit score on applications, eviction rate, late-payment / NSF rate, and stable-employment percentage? A property-management company in the area should have these aggregated.
- How much new for-sale + rental construction is in the pipeline within 1–3 miles? Heavy new supply typically softens prices + rents 12–24 months out; constrained supply supports both.
Investment metrics
- 1% rule
- 0.78% ✗
- Cap rate
- 5.83%
- Cash-on-cash
- -1.64%
- DSCR
- 0.93
- GRM
- 10.7
CMA / ARV
No comps found within radius.
Projected returns pro-forma
-3.0% appreciation · 3.33% rent growth · sell at horizon
- IRR
- -18.7%
- Equity multiple
- 0.34×
- Total profit
- $-55,151
- Equity at exit
- $44,716
- IRR
- -10.5%
- Equity multiple
- 0.35×
- Total profit
- $-54,350
- Equity at exit
- $25,930
Cash invested: $83,972 (down + closing). Projections, not guarantees.
Landlord ↔ Tenant lean methodology
- Overall (STATE)
- 46 Balanced
- State Minnesota
- 46 Balanced · D+2
- County
- — inherits STATE
- City
- — inherits STATE
ZIP-level market 55025
- Rents YoY
- 3.3%
- Active inventory
- 164
- Price-to-rent
- 10.7×
Monthly cashflow live
- Estimated rent
- $2,334 medium interval (Pro) →
- Mortgage (P&I)
- −$1,573
- Tax from tax record
- −$261 /mo · $3,132/yr
- Insurance
- −$125
- HOA
- −$0
- Vacancy / Maint / Mgmt
- −$490
- Net cashflow
- $-115
Break-even live
UW: 25.0% down · 7.5% · 30yr · 1.5% tax · 5.0% vac · 8.0% maint · 8.0% mgmt
Financing live
Cash to close
- Down payment
- $74,975
- Closing costs
- $8,997
- Reserves months
- —
- Total cash needed
- —
Loan-product check · same deal, 3 products live
Conventional
25% down · 7.5% · 30yr
- Down + closing
- —
- Monthly P&I
- —
- Monthly cashflow
- —
- DSCR
- —
- Eligible?
- —
Personal DTI + credit; lowest rate.
DSCR
20% down · 8.5% · 30yr
- Down + closing
- —
- Monthly P&I
- —
- Monthly cashflow
- —
- DSCR
- —
- Eligible?
- —
No personal income docs; deal must DSCR.
Hard money
10% down · 12.0% · 12mo
- Down + closing
- —
- Monthly P&I
- —
- Monthly cashflow
- —
- DSCR
- —
- Eligible?
- —
Short-term bridge; refi at stabilization.
Rent comps 2 comps
| Address | Beds | Baths | Sqft | Rent | $/sqft | DOM | Units | Dist |
|---|---|---|---|---|---|---|---|---|
| 525 4th St SW Forest Lake, MN | 2.0–3.0 | 1.0 | 1070 | $1,927 | $1.80 | 1d | 10 | 0.66mi |
| 1081 4th St SW Forest Lake, MN | 1.0–3.0 | 1.0–2.0 | 939 | $2,455 | $2.61 | 1d | 12 | 0.99mi |
Listing history 2 events
-
2026-06-18remarks 269-char remark
-
2026-06-18$299,900 Coming Soon 1 DOM
ⓘ Source: listings_history table (triggers on properties + properties_extension) + one-shot
backfill from property_details.listing_events for pre-trigger history.
Tax reassessment forecast MN · Partial reset (capped growth)
- Current annual tax
- $3,132 · $261/mo
- Projected year-2 tax
- $3,245 · $270/mo
- Expected delta
- +$113/yr (+$9/mo · 3.6%)
ⓘ Screening estimate from a state-policy table — verify with the county assessor before closing.
Climate risk First Street
- Flood 1/10 Low FEMA zone X (unshaded) · 0% chance over 30 yrs
- Wildfire 2/10 Low
- Heat 2/10 Low 7 d/yr ≥100°F today · 14 d/yr by 30 yrs out
- Wind 2/10 Low
- Air quality 2/10 Low 1 unhealthy d/yr today · 2 by 30 yrs out
Nearby sold comps map
Loading sold comps map…
Walkable amenities ~0.75 mi
Loading nearby amenities…
Taxation est. · year 1
- Rental income
- $28,011
- − Mortgage interest
- −$16,799
- − Property taxes
- −$3,132
- − Insurance
- −$1,500
- − Repairs & maintenance
- −$2,241
- − Management
- −$2,241
- − Depreciation
- −$8,724
- Taxable loss
- −$6,625
- Est. tax savings @ 24.0%
- +$1,590
- After-tax cash flow
- $215/yr
For passive investors: Depreciation is non-cash, so a rental often shows a tax loss while cash-flowing — sheltering income. Rental losses are passive: they offset passive income freely, and up to $25,000/yr can offset ordinary (W-2) income if you actively participate and your MAGI is under $100k (phasing out to $0 by $150k); unused losses carry forward. On sale, claimed depreciation is recaptured at up to 25%, and gains may owe capital-gains tax (a 1031 exchange can defer both). Figures are a year-1 estimate at your 24.0% rate — not tax advice; consult a CPA.
Schools (NCES district)
- District
- Forest Lake Public School District
- NCES district ID
- 2712270
- Math proficiency
- 48% ▼ -12.00%
- Reading proficiency
- 52% ▼ -9.00%
- Median HH income
- $75,736
- Composite
- 45.24/100
- National rank
- #2664
- State rank
- #90 of 301 in MN
Livability — Forest Lake
- Score
- 75/100
- State rank
- #194
- US rank
- #4132
Category grades
Schools grade is shown separately in the Schools card above.
Census & demographics
- Census place
- Forest Lake, MN
- County
- Washington County · 235,613 people
- City population
- 25,891
- Metro
- Minneapolis-St. Paul-Bloomington, MN-WI
- Population (ZIP)
- 25,891
- Household income
- $98,382
- Rent vs Own
- Severe rent burden
- 420.0
Population outlook (Washington County) Hauer SSP2
- Today (2025)
- 278,554 people
- By 2030
- 290,465 · +4.3%
- By 2040
- 310,014 · +11.3%
- By 2050
- 324,118 · +16.4%
- By 2075
- 362,697 · +30.2%
- By 2100
- 381,491 · +37.0%
Race, ethnicity, and origin ACS 2023
- Neighborhood character
- Predominantly White (84%)
- Race & ethnicity
- White 84% Asian 5% Two or more races 5% Hispanic / Latino 4% Black 3%
- Common ancestry
- Portuguese 10% Romanian 4% Lithuanian 3%
- Foreign-born
- 5% · Canada, China
- Languages at home
- 92% English-only · Other Asian/Pacific 3% Spanish 2% Chinese 1%
Political lean MEDSL · Washington
- 2024 margin
- Lean D (+8.9) · D 53.5% · R 44.6% · Other 1.9%
- 2008→2024 swing
- +4.6pp toward D · 2008: 4.3pp · 2024: 8.9pp
- All cycles
- 2024: D+8.9 2020: D+9.2 2016: D+1.9 2012: D+0.8 2008: D+4.3
Not yet ingested
- Civics
- —
Market trends
- HPI YoY
- ▼ -280.92%
- Current HPI
- 235.3166
- Rent YoY
- ▲ 3.33%
- Metro
- Minneapolis-St. Paul-Bloomington, MN-WI
- State GDP YoY
- ▲ 2.41%
- F500 in state
- 34
Industry mix (Fortune 500 HQ in MN)
| Industry | F500 HQs | Revenue |
|---|---|---|
| Healthcare | 2 | $407B |
|
||
| Retail | 2 | $150B |
|
||
| Consumer Goods | 2 | $32B |
|
||
| Industrial Machinery | 2 | $6B |
|
||
| Agriculture | 1 | $40B |
|
||
| Healthcare / Medical Devices | 1 | $32B |
|
||
Price history
+222.8% since first listed18 events — show timeline
- 2026-06-17 Coming Soon $299,900 WWRA
- 2026-06-17 Coming Soon $299,900 NORTHSTARMLS as Distributed by MLS Grid
- 2020-06-01 Sold (MLS) $245,000 NORTHSTARMLS as Distributed by MLS Grid
- 2020-04-22 Pending — NORTHSTARMLS as Distributed by MLS Grid
- 2020-04-17 Contingent — NORTHSTARMLS as Distributed by MLS Grid
- 2020-03-24 Listed $244,750 NORTHSTARMLS as Distributed by MLS Grid
- 2008-10-04 Listing Removed — NORTHSTARMLS as Distributed by MLS Grid
- 2008-04-04 Listed $199,900 NORTHSTARMLS as Distributed by MLS Grid
- 2008-03-30 Listing Removed — NORTHSTARMLS as Distributed by MLS Grid
- 2007-11-16 Listed $199,900 NORTHSTARMLS as Distributed by MLS Grid
- 2002-10-02 Sold (MLS) $164,900 NORTHSTARMLS as Distributed by MLS Grid
- 2002-09-26 Sold (Public Records) $164,900 Public Records
- 2002-09-18 Listing Removed — NORTHSTARMLS as Distributed by MLS Grid
- 2002-09-08 Listed $164,900 NORTHSTARMLS as Distributed by MLS Grid
- 1996-05-01 Sold (Public Records) $90,500 Public Records
- 1996-04-30 Sold (MLS) $91,000 NORTHSTARMLS as Distributed by MLS Grid
- 1996-02-15 Listing Removed — NORTHSTARMLS as Distributed by MLS Grid
- 1996-01-22 Listed $92,900 NORTHSTARMLS as Distributed by MLS Grid
Property tax history
+6.1%/yrLatest (2025): $3,132 · -7.3% YoY. Source: county tax records.
Cash-flow waterfall
monthlySold comps — $/sqft
last 12 mo · ≤1 miLoading sold comps…