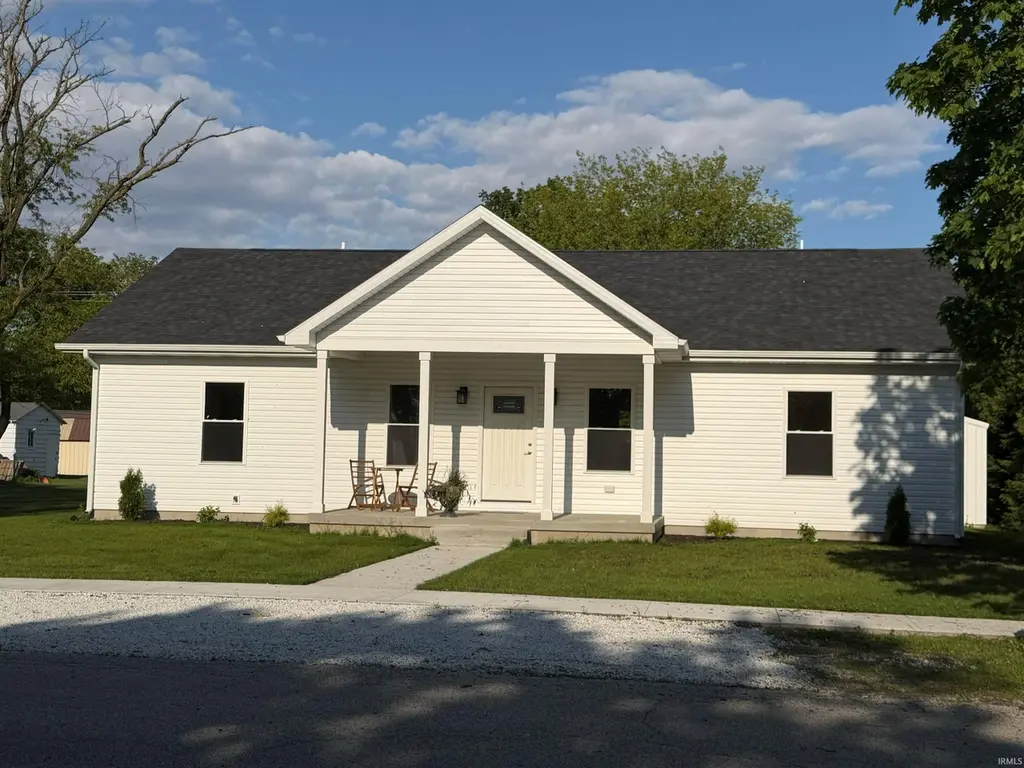
309 S Maine St · Remington, IN
Flood risk 1/10 · Minimal
- FEMA flood zone
- X (unshaded)
- Chance of flooding over 30 yrs
- 0.0%
- Est. flood insurance / yr
- $507 – $1,088
Fire risk 1/10 · Minimal
- Est. fire insurance / yr
- $717 – $1,331
Heat risk 3/10 · Minor
- Hot days now (above 102°F)
- 7 days/yr
- Hot days in 30 yrs
- 17 days/yr
Wind risk 2/10 · Minimal
- Chance of severe wind over 30 yrs
- —
Air-quality risk 2/10 · Minimal
- Unhealthy air days now
- 1 days/yr
- Unhealthy air days in 30 yrs
- 2 days/yr
Risk factors via First Street. Map © Google.
Why this score? — see what drove the F grade
The composite is a weighted blend of 9 inputs, each scored 0–100. Each bar is that input's sub-score; the figure is the points it added to the 100-point composite (weight × sub-score).
- ARV discount +7.5/15.0
- Schools +3.4/10.0
- Livability +3.4/5.0
- Cash flow +2.6/30.0
- Rent growth +2.5/5.0
- Condition / age +2.5/5.0
- Appreciation +1.7/10.0
- 1% rule +0.0/10.0
- DSCR +0.0/10.0
$282,900
🖨 Deal sheet (PDF) 📄 Offer letter ✓ Due diligence
Listing remarks MLS
Don't wait to view this quality new construction with 3 bedrooms, 2 bathrooms, and open floor plan with 9 foot ceilings. The kitchen boasts quartz countertops. The bathrooms also have quartz vanity tops. Open front 8' x 18' porch, 10' x 24' rear porch, generous enough for cozy seating area in addition to dining area. Generator ready. Many more perks, come take a look! Realtor owned.
Key facts
- Open floor plan
- Quartz countertops
- Open front porch
Tags
Neighborhood map
What this means for you Summary
Snapshot
- This is a 2-bed/1.0-bath single-family listed at $283k.
Deal economics
- At list price, monthly cash flow is $-973 ($-12k/yr) — negative.
- To cash-flow at today's rent, offer at most $111k (60.7% below list).
- To meet the 1% rule (rent ≥ 1% of price), the offer needs to be $90k (68.2% below list).
- Recommended offer: $90k (68.2% below list) — sets the bar for 1% rule.
Location & tenants
- Location reads 68/100 on livability (#223 in IN) — a middle-class / working-renter tenant base. Strengths: crime A+, cost of living A+, housing A+; Watch: amenities F, commute F, health & safety F.
- Tri-County School Corporation (rural): math 36% / reading 42% proficiency, ranked #146 of 301 in IN (top 48%) — families likely to look elsewhere, expect single-tenant / working-renter base with shorter leases.
- Zoned schools: Tri-County Intermediate School (math 40% / reading 30%, grade F, #590 of 994 statewide, top 60%, 227 students, 41% FRL); Tri-County Jr/Sr High School (math 32% / reading 57%, grade F, #169 of 369 statewide, top 51%, 329 students, 40% FRL).
- Market conditions: 9 active listings in the ZIP; 1 comparable units currently listed for rent nearby; 93 units permitted in Jasper County in 2024 (5 in 5+ unit buildings).
Forward outlook
- Local home prices are declining (-3.0%/yr); year-one equity from $2k of loan paydown is wiped out by about $8k of value loss. Plan a longer hold.
- Jasper County population projected at -11% by 2050 — secular population decline; favor cash flow + early exit over multi-decade hold.
Negotiation context
- It's been on market 147 days — a 12% lower offer ($249k) is reasonable based on typical stale-listing flexibility.
- 2 sale attempts with the ask held roughly flat each time — persistent listings suggest the price (not the market) is what's stuck; bring a comps-based counter.
Questions for the listing agent
- What do current leases actually rent for vs. the listed asking? Can we see a recent rent roll and the last 12 months of T-12 income?
- It's been on market 147 days. Have you received any prior offers? Is the seller open to a 68% concession, seller financing, or rate buy-down credit?
- Why hasn't it sold? Are there any deal-killer items the seller is aware of (foundation, flood, title, zoning, code violations)?
- Is there a deadline driving the sale (1031 exchange, divorce, estate, relocation)? That informs how much negotiation room exists.
- Schools are F-rated, which usually means shorter tenancies and higher turnover. Who's the typical renter profile here, and what's been the actual vacancy rate?
- The area grade is low — what's the realistic commute time and amenity access for the typical tenant pool here? Any planned neighborhood developments (good or bad) we should know about?
- What's the average days-on-market for RENTAL listings here right now (not sales)? A rising rental-DOM trend means longer vacancies and softer asking-rent achievability than the comps imply.
- What's the recent tenant-quality profile in this submarket — average credit score on applications, eviction rate, late-payment / NSF rate, and stable-employment percentage? A property-management company in the area should have these aggregated.
- How much new for-sale + rental construction is in the pipeline within 1–3 miles? Heavy new supply typically softens prices + rents 12–24 months out; constrained supply supports both.
Investment metrics
- 1% rule
- 0.32% ✗
- Cap rate
- 2.17%
- Cash-on-cash
- -14.74%
- DSCR
- 0.34
- GRM
- 26.2
CMA / ARV
- ARV (median comp)
- $170,918
- List price
- $282,900
- Delta
- 65.52%
- Verdict
- OVERPRICED
- Comps
- 20 within 1.0 mi
Show comp detail 3 sales within ~0.75 mi
| Address | Dist | Beds/Ba | Sqft | Sold | Price | $/sf | Match |
|---|---|---|---|---|---|---|---|
| 210 S New York St | 0.08mi | 3/1.0 (+1) | 825 (-9%) | 11mo | $125,000 | $152 | 68 |
| 23 E Michigan St | 0.38mi | 2/1.0 | 950 (+5%) | 9mo | $95,000 | $100 | 66 |
| 617 N New York St | 0.71mi | 3/1.0 (+1) | 1,000 (+11%) | 20mo | $122,500 | $123 | 27 |
Match score weights: distance 35% · size 25% · config 20% · recency 20%. Top-matched comps best support the ARV.
Projected returns pro-forma
-3.0% appreciation · 3.0% rent growth · sell at horizon
- IRR
- -44.6%
- Equity multiple
- -0.36×
- Total profit
- $-107,946
- Equity at exit
- $42,181
- IRR
- -81.4%
- Equity multiple
- -1.20×
- Total profit
- $-174,390
- Equity at exit
- $24,460
Cash invested: $79,212 (down + closing). Projections, not guarantees.
Landlord ↔ Tenant lean methodology
- Overall (STATE)
- 90 Strongly Landlord-Friendly
- State Indiana
- 90 Strongly Landlord-Friendly · R+11
- County
- — inherits STATE
- City
- — inherits STATE
ZIP-level market 47977
- Home prices YoY
- -3.1%
- Active inventory
- 9
- Price-to-rent
- 26.2×
Monthly cashflow live
- Estimated rent
- $900 medium interval (Pro) →
- Mortgage (P&I)
- −$1,484
- Tax from tax record
- −$82 /mo · $987/yr
- Insurance
- −$118
- HOA
- −$0
- Vacancy / Maint / Mgmt
- −$189
- Net cashflow
- $-973
Break-even live
Sensitivity live
| Price | -10% $-813 | -5% $-893 | +0% $-973 | +5% $-1,053 | +10% $-1,133 |
|---|---|---|---|---|---|
| Rent | -10% $-1,044 | -5% $-1,008 | +0% $-973 | +5% $-937 | +10% $-902 |
| Rate | -1.0pp $-830 | -0.5pp $-901 | base $-973 | +0.5pp $-1,046 | +1.0pp $-1,121 |
UW: 25.0% down · 7.5% · 30yr · 1.5% tax · 5.0% vac · 8.0% maint · 8.0% mgmt
Financing live
Cash to close
- Down payment
- $70,725
- Closing costs
- $8,487
- Reserves months
- —
- Total cash needed
- —
Loan-product check · same deal, 3 products live
Conventional
25% down · 7.5% · 30yr
- Down + closing
- —
- Monthly P&I
- —
- Monthly cashflow
- —
- DSCR
- —
- Eligible?
- —
Personal DTI + credit; lowest rate.
DSCR
20% down · 8.5% · 30yr
- Down + closing
- —
- Monthly P&I
- —
- Monthly cashflow
- —
- DSCR
- —
- Eligible?
- —
No personal income docs; deal must DSCR.
Hard money
10% down · 12.0% · 12mo
- Down + closing
- —
- Monthly P&I
- —
- Monthly cashflow
- —
- DSCR
- —
- Eligible?
- —
Short-term bridge; refi at stabilization.
Rent comps 1 comps
| Address | Beds | Baths | Sqft | Rent | $/sqft | DOM | Units | Dist |
|---|---|---|---|---|---|---|---|---|
| 312 N Illinois St Unit 2nd Floor Remington, IN | 1.0 | 1.0 | 1000 | $900 | $0.90 | 15d | 1 | 0.52mi |
Listing history 19 events
-
2026-06-21days on market $282,900 Active 147 DOM
-
2026-06-19days on market $282,900 Active 145 DOM
-
2026-06-18days on market $282,900 Active 144 DOM
-
2026-06-17days on market $282,900 Active 143 DOM
-
2026-06-16days on market $282,900 Active 142 DOM
-
2026-06-15days on market $282,900 Active 141 DOM
-
2026-06-14days on market $282,900 Active 139 DOM
-
2026-06-13days on market $282,900 Active 138 DOM
-
2026-06-10days on market $282,900 Active 136 DOM
-
2026-06-09days on market $282,900 Active 135 DOM
-
2026-06-08days on market $282,900 Active 134 DOM
-
2026-06-07days on market $282,900 Active 133 DOM
-
2026-06-03days on market $282,900 Active 129 DOM
-
2026-06-02days on market $282,900 Active 128 DOM
-
2026-06-01days on market $282,900 Active 127 DOM
-
2026-05-31days on market $282,900 Active 126 DOM
-
2026-05-30days on market $282,900 Active 125 DOM
-
2026-05-08status Active 385-char remark
Show marketing remark (385 chars)
Don't wait to view this quality new construction with 3 bedrooms, 2 bathrooms, and open floor plan with 9 foot ceilings. The kitchen boasts quartz countertops. The bathrooms also have quartz vanity tops. Open front 8' x 18' porch, 10' x 24' rear porch, generous enough for cozy seating area in addition to dining area. Generator ready. Many more perks, come take a look! Realtor owned.
-
2025-10-23$282,900 Active 385-char remark
Show marketing remark (385 chars)
Don't wait to view this quality new construction with 3 bedrooms, 2 bathrooms, and open floor plan with 9 foot ceilings. The kitchen boasts quartz countertops. The bathrooms also have quartz vanity tops. Open front 8' x 18' porch, 10' x 24' rear porch, generous enough for cozy seating area in addition to dining area. Generator ready. Many more perks, come take a look! Realtor owned.
ⓘ Source: listings_history table (triggers on properties + properties_extension) + one-shot
backfill from property_details.listing_events for pre-trigger history.
Tax reassessment forecast IN · Partial reset (capped growth)
- Current annual tax
- $987 · $82/mo
- Projected year-2 tax
- $1,696 · $141/mo
- Expected delta
- +$709/yr (+$59/mo · 71.8%)
ⓘ Screening estimate from a state-policy table — verify with the county assessor before closing.
Climate risk First Street
- Flood 1/10 Low FEMA zone X (unshaded) · 0% chance over 30 yrs
- Wildfire 1/10 Low
- Heat 3/10 Moderate 7 d/yr ≥102°F today · 17 d/yr by 30 yrs out
- Wind 2/10 Low
- Air quality 2/10 Low 1 unhealthy d/yr today · 2 by 30 yrs out
Nearby sold comps map
Loading sold comps map…
Walkable amenities ~0.75 mi
Loading nearby amenities…
Taxation est. · year 1
- Rental income
- $10,800
- − Mortgage interest
- −$15,847
- − Property taxes
- −$987
- − Insurance
- −$1,414
- − Repairs & maintenance
- −$864
- − Management
- −$864
- − Depreciation
- −$8,230
- Taxable loss
- −$17,406
- Est. tax savings @ 24.0%
- +$4,177
- After-tax cash flow
- $-7,495/yr
For passive investors: Depreciation is non-cash, so a rental often shows a tax loss while cash-flowing — sheltering income. Rental losses are passive: they offset passive income freely, and up to $25,000/yr can offset ordinary (W-2) income if you actively participate and your MAGI is under $100k (phasing out to $0 by $150k); unused losses carry forward. On sale, claimed depreciation is recaptured at up to 25%, and gains may owe capital-gains tax (a 1031 exchange can defer both). Figures are a year-1 estimate at your 24.0% rate — not tax advice; consult a CPA.
Schools (NCES district)
- District
- Tri-County School Corporation
- NCES district ID
- 1811430
- Math proficiency
- 36% ▼ -17.00%
- Reading proficiency
- 42% ▼ -16.00%
- Median HH income
- $52,924
- Composite
- 33.93/100
- National rank
- #5336
- State rank
- #146 of 301 in IN
Livability — Remington
- Score
- 68/100
- State rank
- #223
- US rank
- #9734
Category grades
Schools grade is shown separately in the Schools card above.
Census & demographics
- Census place
- Remington, IN
- City population
- 2,606
- Population (ZIP)
- 2,606
Population outlook (Jasper County) Hauer SSP2
- Today (2025)
- 33,185 people
- By 2030
- 32,635 · -1.7%
- By 2040
- 31,232 · -5.9%
- By 2050
- 29,630 · -10.7%
- By 2075
- 25,938 · -21.8%
- By 2100
- 21,635 · -34.8%
Race, ethnicity, and origin ACS 2023
- Neighborhood character
- Predominantly White (95%)
- Race & ethnicity
- White 95% Hispanic / Latino 4% Two or more races 4%
- Common ancestry
- Lithuanian 7% Italian 3% Slovak 2%
- Foreign-born
- 1% · Canada
- Languages at home
- 98% English-only · Spanish 2%
Political lean MEDSL · Jasper
- 2024 margin
- Solid R (+54.3) · D 22.1% · R 76.4% · Other 1.6%
- 2008→2024 swing
- -33.9pp toward R · 2008: -20.4pp · 2024: -54.3pp
- All cycles
- 2024: R+54.3 2020: R+49.0 2016: R+45.4 2012: R+25.5 2008: R+20.4
Not yet ingested
- Civics
- —
Market trends
- HPI YoY
- ▼ -6.58%
- Current HPI
- 206.4813
- Rent YoY
- —
- Metro
- —
- State GDP YoY
- ▲ 2.90%
- F500 in state
- 18
Industry mix (Fortune 500 HQ in IN)
| Industry | F500 HQs | Revenue |
|---|---|---|
| Industrial Machinery | 2 | $37B |
|
||
| Healthcare | 1 | $177B |
|
||
| Pharmaceuticals | 1 | $45B |
|
||
| Metals / Steel | 1 | $18B |
|
||
| Agriculture | 1 | $17B |
|
||
| Packaging | 1 | $12B |
|
||
Price history
2 events — show timeline
- 2026-05-08 Relisted — IRMLS
- 2025-10-23 Listed $282,900 IRMLS
Property tax history
+1.4%/yrLatest (2025): $987 · +6.4% YoY. Source: county tax records.
Cash-flow waterfall
monthlySold comps — $/sqft
last 12 mo · ≤1 miLoading sold comps…