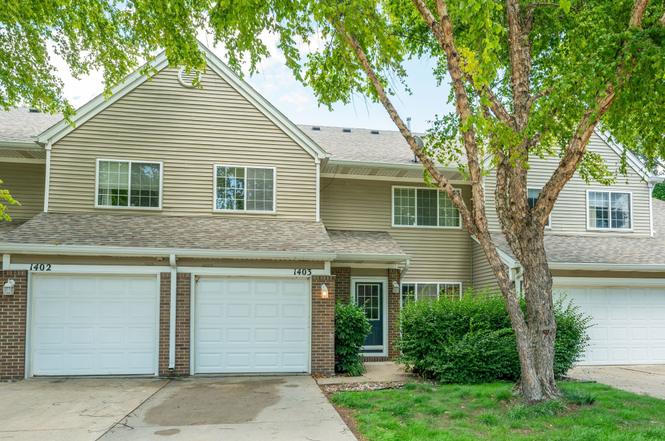
6855 Woodland Ave #1403 · West Des Moines, IA
Flood risk 1/10 · Minimal
- FEMA flood zone
- X (unshaded)
- Chance of flooding over 30 yrs
- 0.0%
- Est. flood insurance / yr
- $507 – $1,088
Fire risk 1/10 · Minimal
- Est. fire insurance / yr
- $902 – $1,676
Heat risk 3/10 · Minor
- Hot days now (above 103°F)
- 7 days/yr
- Hot days in 30 yrs
- 15 days/yr
Wind risk 2/10 · Minimal
- Chance of severe wind over 30 yrs
- —
Air-quality risk 1/10 · Minimal
- Unhealthy air days now
- 0 days/yr
- Unhealthy air days in 30 yrs
- 0 days/yr
Risk factors via First Street. Map © Google.
Why this score? — see what drove the D grade
The composite is a weighted blend of 9 inputs, each scored 0–100. Each bar is that input's sub-score; the figure is the points it added to the 100-point composite (weight × sub-score).
- Cash flow +10.2/30.0
- ARV discount +7.5/15.0
- Schools +7.1/10.0
- 1% rule +4.5/10.0
- Livability +4.4/5.0
- Rent growth +3.0/5.0
- DSCR +2.9/10.0
- Condition / age +2.5/5.0
- Appreciation +0.0/10.0
$170,000
🖨 Deal sheet (PDF) 📄 Offer letter ✓ Due diligence
Listing remarks MLS
FABULOUS, AFFORDABLE AND READY FOR A NEW OWNER! Nestled on a QUIET little nook in an established neighborhood, with lovely LANDSCAPING AND TREES, you will find this wonderful townhome! OPEN living area adjacent to the very FUNCTIONAL KITCHEN w/ ample counter space, storage and breakfast bar! 2 spacious bedrooms upstairs with GREAT CLOSETS! Laundry area includes the FRONT LOADING WASHER AND DRYER! Nice neutral decor! CONVENIENT LOCATION near walking paths, churches, restaurants, Jordan Creek Center, and easy interstate access! HSA HOME WARRANTY included for buyer's peace of mind!
Key facts
- Second-floor laundry
- Walk-in closet
- Newer roof
Tags
Property features AI
Finance
- Other: Pets allowed with size limits and restrictions
- HOA & community: Homeowners association: Villas of Woodland Lake (managed by Association Management Svcs); HOA fee $205 monthly; HOA covers grounds and structure maintenance, and snow removal
Exterior
- Parking: Attached one-car garage
- Security: Smoke detector(s)
- Utilities: Public water; Public sewer
- Home design: Two-story property; Vinyl siding
- Construction: Shingle/asphalt roof; Slab foundation
- Exterior features: Open patio; Patio
Interior
- Kitchen: Dishwasher; Microwave; Refrigerator; Stove
- Flooring: Carpet; Vinyl
- Bathrooms: One full bathroom; One half bathroom
- Heating & cooling: Central air conditioning; Gas heating (natural gas)
- Interior features: Dining area; Cable TV
- Laundry & utility: Washer; Dryer; Laundry located on upper level
Neighborhood map
What this means for you Summary
Snapshot
- This is a 2-bed/1.5-bath condo listed at $170k.
Deal economics
- At list price, monthly cash flow is $-96 ($-1k/yr) — negative.
- To cash-flow at today's rent, offer at most $153k (10.0% below list).
- To meet the 1% rule (rent ≥ 1% of price), the offer needs to be $162k (4.6% below list).
- Recommended offer: $153k (10.0% below list) — sets the bar for cash-flow.
- Cap rate 5.6% vs local median 2.5% in West Des Moines — top-decile yield for the area; either an underpriced asset or a hidden risk that comps aren't pricing in. Stress-test before assuming the spread holds.
Location & tenants
- Location reads 87/100 on livability (#11 in IA, #336 nationally) — a professional / high-income tenant draw. Strengths: amenities A+, cost of living A+, housing A+; Watch: commute F.
- Waukee Community School District (suburban): math 80% / reading 79% proficiency, ranked #14 of 289 in IA (top 5%) — strong family-tenant draw, lease renewals of 3-5y typical; only 11% free/reduced lunch — higher-income household profile.
- Zoned schools: Brookview Elementary School (math 85% / reading 73%, grade A, #93 of 616 statewide, top 15%, 603 students, 21% FRL); South Middle School (math 78% / reading 77%, grade A+, #50 of 246 statewide, top 20%, 909 students, 26% FRL); Waukee High School (math 74% / reading 82%, grade A-, #53 of 336 statewide, top 16%, 1,268 students, 24% FRL).
- Market conditions: Rents rising (+1.9%/yr); 591 active listings in the ZIP; 17 comparable units currently listed for rent nearby; rentals at typical pace (median 16d on market — plan ~3-4 weeks tenant-placement turnaround); solid renter incomes; 1,503 units permitted in Dallas County in 2024 (630 in 5+ unit buildings).
Forward outlook
- Local home prices are declining (-3.0%/yr); year-one equity from $1k of loan paydown is wiped out by about $5k of value loss. Plan a longer hold.
- Dallas County population projected at +74% by 2050 — long-run rental-demand tailwind backs the buy-and-hold thesis.
Negotiation context
- Only 3 days on market — expect competitive offers; lowballing is unlikely to land.
- 4 sale attempts since 18y ago with the ask held roughly flat each time — persistent listings suggest the price (not the market) is what's stuck; bring a comps-based counter.
- Current owner paid $102k; list at $170k implies a 67% gain — meaningful room to come down on a strong offer.
Questions for the listing agent
- What do current leases actually rent for vs. the listed asking? Can we see a recent rent roll and the last 12 months of T-12 income?
- What does the HOA fee cover, when was the last increase, and are there any pending special assessments or reserve-fund shortfalls?
- Any open or pending special assessments — roof, HVAC, plumbing, elevator, façade? What's the per-unit balance and payoff schedule, and is the seller paying it off at close or rolling it to the buyer?
- Is there a deadline driving the sale (1031 exchange, divorce, estate, relocation)? That informs how much negotiation room exists.
- Schools are A-rated — typically a magnet for longer-tenancy family renters. What's the average tenant stay here, and is there a school-zone premium baked into asking?
- The area grade is low — what's the realistic commute time and amenity access for the typical tenant pool here? Any planned neighborhood developments (good or bad) we should know about?
- What's the average days-on-market for RENTAL listings here right now (not sales)? A rising rental-DOM trend means longer vacancies and softer asking-rent achievability than the comps imply.
- What's the recent tenant-quality profile in this submarket — average credit score on applications, eviction rate, late-payment / NSF rate, and stable-employment percentage? A property-management company in the area should have these aggregated.
- How much new apartment / multifamily construction is in the pipeline within 1–3 miles? Heavy new supply (>2% of stock underway) typically softens rents 12–24 months out; light construction supports rent growth.
Investment metrics
- 1% rule
- 0.95% ✗
- Cap rate
- 5.61%
- Cash-on-cash
- -2.42%
- DSCR
- 0.89
- GRM
- 8.7
CMA / ARV
No comps found within radius.
Projected returns pro-forma
-3.0% appreciation · 1.94% rent growth · sell at horizon
- IRR
- -21.6%
- Equity multiple
- 0.26×
- Total profit
- $-35,237
- Equity at exit
- $25,348
- IRR
- -18.3%
- Equity multiple
- 0.06×
- Total profit
- $-44,844
- Equity at exit
- $14,698
Cash invested: $47,600 (down + closing). Projections, not guarantees.
Landlord ↔ Tenant lean methodology
- Overall (STATE)
- 83 Strongly Landlord-Friendly
- State Iowa
- 83 Strongly Landlord-Friendly · R+6
- County
- — inherits STATE
- City
- — inherits STATE
ZIP-level market 50266
- Home prices YoY
- -17.5%
- Rents YoY
- 1.9%
- Active inventory
- 591
- Price-to-rent
- 8.7×
Monthly cashflow live
- Estimated rent
- $1,622 high interval (Pro) →
- Mortgage (P&I)
- −$891
- Tax from tax record
- −$210 /mo · $2,526/yr
- Insurance
- −$71
- HOA
- −$205
- Vacancy / Maint / Mgmt
- −$341
- Net cashflow
- $-96
Break-even live
Sensitivity live
| Price | -10% $0 | -5% $-48 | +0% $-96 | +5% $-144 | +10% $-192 |
|---|---|---|---|---|---|
| Rent | -10% $-224 | -5% $-160 | +0% $-96 | +5% $-32 | +10% $32 |
| Rate | -1.0pp $-11 | -0.5pp $-53 | base $-96 | +0.5pp $-140 | +1.0pp $-185 |
UW: 25.0% down · 7.5% · 30yr · 1.5% tax · 5.0% vac · 8.0% maint · 8.0% mgmt
Financing live
Cash to close
- Down payment
- $42,500
- Closing costs
- $5,100
- Reserves months
- —
- Total cash needed
- —
Loan-product check · same deal, 3 products live
Conventional
25% down · 7.5% · 30yr
- Down + closing
- —
- Monthly P&I
- —
- Monthly cashflow
- —
- DSCR
- —
- Eligible?
- —
Personal DTI + credit; lowest rate.
DSCR
20% down · 8.5% · 30yr
- Down + closing
- —
- Monthly P&I
- —
- Monthly cashflow
- —
- DSCR
- —
- Eligible?
- —
No personal income docs; deal must DSCR.
Hard money
10% down · 12.0% · 12mo
- Down + closing
- —
- Monthly P&I
- —
- Monthly cashflow
- —
- DSCR
- —
- Eligible?
- —
Short-term bridge; refi at stabilization.
Rent comps 17 comps
| Address | Beds | Baths | Sqft | Rent | $/sqft | DOM | Units | Dist |
|---|---|---|---|---|---|---|---|---|
| 7171 Woodland Ave West Des Moines, IA | 1.0–2.0 | 1.0–2.0 | 1085 | $1,825 | $1.68 | 16d | 1 | 0.17mi |
| 950 67th St #410 West Des Moines, IA | 2.0 | 2.0 | 999 | $1,295 | $1.30 | 25d | 1 | 0.23mi |
| 6814 Meadow Ct West Des Moines, IA | 3.0 | 2.5 | 1462 | $2,495 | $1.71 | 23d | 1 | 0.42mi |
| 950 Jordan Creek Pkwy West Des Moines, IA | 1.0–2.0 | 1.0–2.0 | 1082 | $3,546 | $3.28 | 16d | 37 | 0.49mi |
| 6630 Cody Dr West Des Moines, IA | 2.0 | 2.5 | 1200 | $1,565 | $1.30 | 16d | 1 | 0.70mi |
| 5901 Vista Dr West Des Moines, IA | 3.0 | 2.0 | 830 | $1,269 | $1.53 | 16d | 130 | 0.75mi |
| 8302 Westown Pkwy #2107 West Des Moines, IA | 2.0 | 1.5 | 1056 | $1,495 | $1.42 | 45d | 1 | 1.01mi |
| 6565 Wistful Vista Dr West Des Moines, IA | 2.0 | 1.0–2.0 | 871 | $1,765 | $2.03 | 16d | 19 | 1.11mi |
| 360 Bridgewood Dr West Des Moines, IA | 2.0 | 1.0–2.0 | 795 | $1,855 | $2.33 | 16d | 21 | 1.15mi |
| 8601 Westown Pkwy West Des Moines, IA | 2.0–3.0 | 2.0 | 1099 | $1,295 | $1.18 | 25d | 1 | 1.28mi |
| 8602 Westown Pkwy West Des Moines, IA | 2.0–3.0 | 2.0 | 1222 | $1,218 | $1.00 | 16d | 9 | 1.30mi |
| 204 S 64th St West Des Moines, IA | 1.0–3.0 | 1.0–2.5 | 1346 | $2,195 | $1.63 | 16d | 2 | 1.31mi |
| 8350 Ep True Pkwy #3105 West Des Moines, IA | 2.0 | 2.0 | 1100 | $1,450 | $1.32 | 21d | 1 | 1.36mi |
| 716 Knolls Ct West Des Moines, IA | 3.0 | 2.5 | 1448 | $2,095 | $1.45 | 45d | 1 | 1.38mi |
| 7425 Wistful Vista Dr #802 West Des Moines, IA | 2.0 | 1.5 | 1276 | $1,475 | $1.16 | 45d | 1 | 1.47mi |
| 7425 Wistful Vista Dr #304 West Des Moines, IA | 2.0 | 2.0 | 1268 | $1,875 | $1.48 | 16d | 1 | 1.47mi |
| 595 88th St West Des Moines, IA | 2.0 | 1.0–2.0 | 818 | $1,570 | $1.92 | 16d | 20 | 1.50mi |
HOA detail condo
- Monthly dues
- $205 · $2,460/yr
- Likely covers
- landscaping
- Assessments
- None detected in remarks — confirm with the listing agent.
Listing history 3 events
-
2026-06-21days on market $170,000 Active 3 DOM
-
2026-06-18remarks 699-char remark
-
2026-06-18$170,000 Active 1 DOM
ⓘ Source: listings_history table (triggers on properties + properties_extension) + one-shot
backfill from property_details.listing_events for pre-trigger history.
Tax reassessment forecast IA · Partial reset (capped growth)
- Current annual tax
- $2,526 · $210/mo
- Projected year-2 tax
- $2,598 · $216/mo
- Expected delta
- +$72/yr (+$6/mo · 2.8%)
ⓘ Screening estimate from a state-policy table — verify with the county assessor before closing.
Climate risk First Street
- Flood 1/10 Low FEMA zone X (unshaded) · 0% chance over 30 yrs
- Wildfire 1/10 Low
- Heat 3/10 Moderate 7 d/yr ≥103°F today · 15 d/yr by 30 yrs out
- Wind 2/10 Low
- Air quality 1/10 Low 0 unhealthy d/yr today · 0 by 30 yrs out
Nearby sold comps map
Loading sold comps map…
Walkable amenities ~0.75 mi
Loading nearby amenities…
Taxation est. · year 1
- Rental income
- $19,468
- − Mortgage interest
- −$9,523
- − Property taxes
- −$2,526
- − Insurance
- −$850
- − Repairs & maintenance
- −$1,557
- − Management
- −$1,557
- − HOA
- −$2,460
- − Depreciation
- −$4,945
- Taxable loss
- −$3,951
- Est. tax savings @ 24.0%
- +$948
- After-tax cash flow
- $-206/yr
For passive investors: Depreciation is non-cash, so a rental often shows a tax loss while cash-flowing — sheltering income. Rental losses are passive: they offset passive income freely, and up to $25,000/yr can offset ordinary (W-2) income if you actively participate and your MAGI is under $100k (phasing out to $0 by $150k); unused losses carry forward. On sale, claimed depreciation is recaptured at up to 25%, and gains may owe capital-gains tax (a 1031 exchange can defer both). Figures are a year-1 estimate at your 24.0% rate — not tax advice; consult a CPA.
Schools (NCES district)
- District
- Waukee Community School District
- NCES district ID
- 1930510
- Math proficiency
- 80% ▼ -6.00%
- Reading proficiency
- 79% ▼ -5.00%
- Median HH income
- $88,580
- Composite
- 70.94/100
- National rank
- #245
- State rank
- #14 of 289 in IA
Livability — West Des Moines
- Score
- 87/100
- State rank
- #11
- US rank
- #336
Category grades
Schools grade is shown separately in the Schools card above.
Census & demographics
- Census place
- West Des Moines, IA
- County
- Dallas County · 77,082 people
- City population
- 71,011
- Metro
- Des Moines-West Des Moines, IA
- Population (ZIP)
- 37,523
- Household income
- $87,025
- Rent vs Own
- Severe rent burden
- 1561.0
Population outlook (Dallas County) Hauer SSP2
- Today (2025)
- 111,904 people
- By 2030
- 127,807 · +14.2%
- By 2040
- 160,576 · +43.5%
- By 2050
- 194,154 · +73.5%
- By 2075
- 271,895 · +143.0%
- By 2100
- 326,525 · +191.8%
Race, ethnicity, and origin ACS 2023
- Neighborhood character
- Predominantly White (80%)
- Race & ethnicity
- White 80% Asian 8% Two or more races 6% Hispanic / Latino 5% Black 3%
- Hispanic origin (detail)
- Mexican 3%
- Common ancestry
- Portuguese 5% Italian 3% Iranian 2%
- Foreign-born
- 12% · Canada, South Korea, Vietnam
- Languages at home
- 86% English-only · Spanish 4% Other Asian/Pacific 3% Other Indo-European 2%
Political lean MEDSL · Dallas
- 2024 margin
- Toss-up / Even · D 46.9% · R 51.7% · Other 1.4%
- 2008→2024 swing
- +0.8pp no change · 2008: -5.5pp · 2024: -4.8pp
- All cycles
- 2024: R+4.8 2020: R+2.0 2016: R+9.6 2012: R+11.8 2008: R+5.5
Not yet ingested
- Civics
- —
Market trends
- HPI YoY
- ▼ -43.24%
- Current HPI
- 203.6979
- Rent YoY
- ▲ 1.94%
- Metro
- Des Moines-West Des Moines, IA
- State GDP YoY
- ▲ 2.48%
- F500 in state
- 4
Industry mix (Fortune 500 HQ in IA)
| Industry | F500 HQs | Revenue |
|---|---|---|
| Financial Services | 1 | $16B |
|
||
| Retail / Convenience | 1 | $15B |
|
||
Price history
+68.3% since first listed10 events — show timeline
- 2026-06-18 Listed $170,000 DMMLS
- 2014-08-22 Sold (MLS) $102,000 DMMLS
- 2014-07-15 Listed $104,900 DMMLS
- 2013-10-01 Listing Removed — DMMLS
- 2013-04-01 Listed $103,000 DMMLS
- 2008-10-16 Sold (Public Records) $111,000 Public Records
- 2008-10-15 Sold (MLS) $110,750 DMMLS
- 2008-06-23 Listed $115,900 DMMLS
- 2005-06-02 Sold (Public Records) $112,000 Public Records
- 2002-08-12 Sold (Public Records) $101,000 Public Records
Property tax history
+3.5%/yrLatest (2025): $2,526 · +6.7% YoY. Source: county tax records.
Cash-flow waterfall
monthlySold comps — $/sqft
last 12 mo · ≤1 miLoading sold comps…