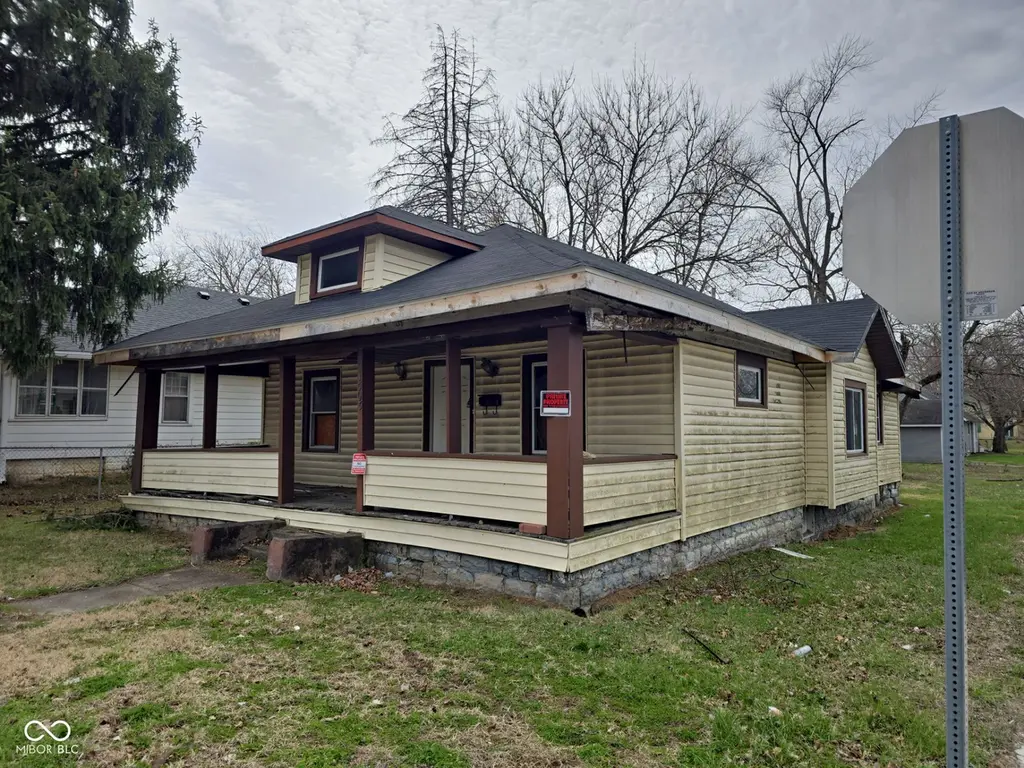
1503 Arrow Ave · Anderson, IN
Flood risk 1/10 · Minimal
- FEMA flood zone
- X (unshaded)
- Chance of flooding over 30 yrs
- 0.0%
- Est. flood insurance / yr
- $473 – $860
Fire risk 1/10 · Minimal
- Est. fire insurance / yr
- $717 – $1,331
Heat risk 3/10 · Minor
- Hot days now (above 100°F)
- 7 days/yr
- Hot days in 30 yrs
- 18 days/yr
Wind risk 2/10 · Minimal
- Chance of severe wind over 30 yrs
- —
Air-quality risk 3/10 · Minor
- Unhealthy air days now
- 2 days/yr
- Unhealthy air days in 30 yrs
- 3 days/yr
Risk factors via First Street. Map © Google.
Why this score? — see what drove the D grade
The composite is a weighted blend of 9 inputs, each scored 0–100. Each bar is that input's sub-score; the figure is the points it added to the 100-point composite (weight × sub-score).
- Cash flow +15.0/30.0
- ARV discount +7.5/15.0
- 1% rule +5.0/10.0
- DSCR +5.0/10.0
- Rent growth +4.5/5.0
- Livability +3.0/5.0
- Condition / age +2.5/5.0
- Schools +1.6/10.0
- Appreciation +0.0/10.0
$24,900
🖨 Deal sheet (PDF) 📄 Offer letter ✓ Due diligence
Listing remarks MLS
Fixer upper 3 bedroom in up and coming area of Anderson, IN. This property has a newer roof, but the interior is a full rehab. Needs extensive work, but priced accordingly. Come see today!
Key facts
- Newer roof
- 6,350 sq ft lot
- Built 1920
Tags
Neighborhood map
What this means for you Summary
Snapshot
- This is a 3-bed/1.0-bath single-family listed at $25k.
Deal economics
- At list price, monthly cash flow is $653 ($8k/yr) — positive.
- The deal already cash-flows at list — no discount required.
- Meets the 1% rule at list price ($1k rent vs $25k).
- Recommended offer: $23k (6.0% below list) — sets the bar for market timing.
- Cap rate 37.8% vs local median 6.5% in Anderson — top-decile yield for the area; either an underpriced asset or a hidden risk that comps aren't pricing in. Stress-test before assuming the spread holds.
Location & tenants
- Location reads 60/100 on livability (#521 in IN) — a middle-class / working-renter tenant base. Strengths: cost of living A+, housing A+; Watch: schools F, crime D-, amenities F.
- Anderson Community School Corporation (urban): math 15% / reading 23% proficiency, ranked #280 of 301 in IN (top 93%) — low school quality limits family demand, transient renter base, plan for 1-2y turnover; 70% free/reduced lunch — lower-income household profile, screen leases tightly.
- Market conditions: Rents rising fast (+7.9%/yr); 185 active listings in the ZIP; 30 comparable units currently listed for rent nearby; rentals at typical pace (median 25d on market — plan ~3-4 weeks tenant-placement turnaround); 43% of comp listings sitting > 30 days — soft ceiling on asking rent; lower-income renter base — watch delinquency; 184 units permitted in Madison County in 2024 (0 in 5+ unit buildings).
- This rent runs 36% of the median local income ($36k/yr) — at the standard rent-burdened threshold; future hikes will face affordability resistance.
Forward outlook
- Local home prices are declining (-3.0%/yr); year-one equity from $172 of loan paydown is wiped out by about $747 of value loss. Plan a longer hold.
- Madison County population projected at -14% by 2050 — secular population decline; favor cash flow + early exit over multi-decade hold.
- At projected returns (-3.0% appreciation + 7.9% rent growth), your $7k cash investment doubles in ~1 year — after that, you're playing with house money.
Negotiation context
- It's been on market 76 days — a 6% lower offer ($23k) is reasonable based on typical stale-listing flexibility.
- 2 sale attempts since 6y ago; this cycle's ask has dropped $15k (38%) from the opening price — seller is motivated, your offer sets the floor, not the list.
- Current owner paid $11k; list at $25k implies a 126% gain — meaningful room to come down on a strong offer.
Risks & watch-outs
- Watch-outs: property tax is 3.1% of price; built in 1920 — expect roof / HVAC / electrical / plumbing capex.
Questions for the listing agent
- It's been on market 76 days. Have you received any prior offers? Is the seller open to a 6% concession, seller financing, or rate buy-down credit?
- Built in 1920 — when were the roof, HVAC, electrical panel, plumbing, and water heater last replaced?
- Property tax is high relative to price — has the assessment been appealed recently, and will the sale trigger a re-assessment?
- Why hasn't it sold? Are there any deal-killer items the seller is aware of (foundation, flood, title, zoning, code violations)?
- Is there a deadline driving the sale (1031 exchange, divorce, estate, relocation)? That informs how much negotiation room exists.
- Schools are F-rated, which usually means shorter tenancies and higher turnover. Who's the typical renter profile here, and what's been the actual vacancy rate?
- Crime grade is D in this area — have there been break-ins, vandalism, or insurance claims at this property in the last 3 years? What carrier currently insures it and at what premium?
- The area grade is low — what's the realistic commute time and amenity access for the typical tenant pool here? Any planned neighborhood developments (good or bad) we should know about?
- What's the average days-on-market for RENTAL listings here right now (not sales)? A rising rental-DOM trend means longer vacancies and softer asking-rent achievability than the comps imply.
- What's the recent tenant-quality profile in this submarket — average credit score on applications, eviction rate, late-payment / NSF rate, and stable-employment percentage? A property-management company in the area should have these aggregated.
- How much new for-sale + rental construction is in the pipeline within 1–3 miles? Heavy new supply typically softens prices + rents 12–24 months out; constrained supply supports both.
Investment metrics
- 1% rule
- 4.37% ✓
- Cap rate
- 37.78%
- Cash-on-cash
- 112.45%
- DSCR
- 6.00
- GRM
- 1.9
CMA / ARV
- ARV (median comp)
- $85,327
- List price
- $24,900
- Delta
- -70.82%
- Verdict
- UNDERPRICED
- Comps
- 20 within 1.0 mi
Show comp detail 12 sales within ~0.75 mi
| Address | Dist | Beds/Ba | Sqft | Sold | Price | $/sf | Match |
|---|---|---|---|---|---|---|---|
| 1430 W 14th St | 0.23mi | 2/1.0 (-1) | 1,404 (+3%) | 8mo | $141,000 | $100 | 73 |
| 1314 Arrow Ave | 0.10mi | 3/1.0 | 1,476 (+8%) | 12mo | $103,000 | $70 | 72 |
| 1209 Nichol Ave | 0.42mi | 2/1.0 (-1) | 1,428 (+5%) | 2mo | $23,750 | $17 | 66 |
| 1644 W 7th St | 0.57mi | 3/1.0 | 1,351 (-1%) | 10mo | $38,000 | $28 | 64 |
| 1310 W 13th St | 0.35mi | 2/1.0 (-1) | 1,178 (-14%) | 1mo | $62,000 | $53 | 56 |
| 2218 Atwood Dr | 0.52mi | 3/2.0 | 1,445 (+6%) | 15mo | $217,900 | $151 | 49 |
| 1227 W 9th St | 0.54mi | 3/1.0 | 1,158 (-15%) | 1mo | $84,000 | $73 | 49 |
| 1728 W 20th St | 0.32mi | 3/1.0 | 1,536 (+13%) | 19mo | $132,900 | $87 | 49 |
| 1002 Raible Ave | 0.58mi | 2/1.5 (-1) | 1,382 (+1%) | 20mo | $175,000 | $127 | 47 |
| 1805 W 21st St | 0.40mi | 4/1.5 (+1) | 1,225 (-10%) | 15mo | $52,000 | $42 | 45 |
| 2215 Fountain St | 0.65mi | 3/1.0 | 1,540 (+13%) | 7mo | $60,000 | $39 | 42 |
| 711 Madison Ave | 0.74mi | 3/2.0 | 1,506 (+10%) | 7mo | $135,000 | $90 | 38 |
Match score weights: distance 35% · size 25% · config 20% · recency 20%. Top-matched comps best support the ARV.
Projected returns pro-forma
-3.0% appreciation · 7.88% rent growth · sell at horizon
- IRR
- —
- Equity multiple
- 7.20×
- Total profit
- $43,213
- Equity at exit
- $3,713
- IRR
- —
- Equity multiple
- 17.75×
- Total profit
- $116,783
- Equity at exit
- $2,153
Cash invested: $6,972 (down + closing). Projections, not guarantees.
Landlord ↔ Tenant lean methodology
- Overall (STATE)
- 90 Strongly Landlord-Friendly
- State Indiana
- 90 Strongly Landlord-Friendly · R+11
- County
- — inherits STATE
- City
- — inherits STATE
ZIP-level market 46016
- Home prices YoY
- -3.5%
- Rents YoY
- 7.9%
- Active inventory
- 185
- Price-to-rent
- 1.9×
Monthly cashflow live
- Estimated rent
- $1,087 high interval (Pro) →
- Mortgage (P&I)
- −$131
- Tax from tax record
- −$64 /mo · $773/yr
- Insurance
- −$10
- HOA
- −$0
- Vacancy / Maint / Mgmt
- −$228
- Net cashflow
- $653
Break-even live
Sensitivity live
| Price | -10% $667 | -5% $660 | +0% $653 | +5% $646 | +10% $639 |
|---|---|---|---|---|---|
| Rent | -10% $567 | -5% $610 | +0% $653 | +5% $696 | +10% $739 |
| Rate | -1.0pp $666 | -0.5pp $660 | base $653 | +0.5pp $647 | +1.0pp $640 |
UW: 25.0% down · 7.5% · 30yr · 1.5% tax · 5.0% vac · 8.0% maint · 8.0% mgmt
Financing live
Cash to close
- Down payment
- $6,225
- Closing costs
- $747
- Reserves months
- —
- Total cash needed
- —
Loan-product check · same deal, 3 products live
Conventional
25% down · 7.5% · 30yr
- Down + closing
- —
- Monthly P&I
- —
- Monthly cashflow
- —
- DSCR
- —
- Eligible?
- —
Personal DTI + credit; lowest rate.
DSCR
20% down · 8.5% · 30yr
- Down + closing
- —
- Monthly P&I
- —
- Monthly cashflow
- —
- DSCR
- —
- Eligible?
- —
No personal income docs; deal must DSCR.
Hard money
10% down · 12.0% · 12mo
- Down + closing
- —
- Monthly P&I
- —
- Monthly cashflow
- —
- DSCR
- —
- Eligible?
- —
Short-term bridge; refi at stabilization.
Rent comps 30 comps
| Address | Beds | Baths | Sqft | Rent | $/sqft | DOM | Units | Dist |
|---|---|---|---|---|---|---|---|---|
| 1616 W 16th St Anderson, IN | 2.0 | 1.0 | 1038 | $1,050 | $1.01 | 44d | 1 | 0.14mi |
| 1136 Irving Way Anderson, IN | 2.0 | 1.0 | 900 | $895 | $0.99 | 22d | 1 | 0.25mi |
| 1404 Walton St Anderson, IN | 3.0 | 1.0 | 1090 | $995 | $0.91 | 44d | 1 | 0.27mi |
| 1532 Walton St Anderson, IN | 3.0 | 1.0 | 1342 | $1,100 | $0.82 | 44d | 1 | 0.27mi |
| 1310 W 13th St Anderson, IN | 2.0 | 1.0 | 1178 | $895 | $0.76 | 2d | 1 | 0.35mi |
| 1222 Nichol Ave Unit 4 Anderson, IN | 3.0 | 1.0 | 1000 | $1,135 | $1.14 | 8d | 1 | 0.43mi |
| 1502 Cedar St Anderson, IN | 2.0 | 1.0 | 1104 | $850 | $0.77 | 44d | 1 | 0.48mi |
| 1631 W 7th St Anderson, IN | 3.0 | 1.0 | 900 | $1,000 | $1.11 | 44d | 1 | 0.55mi |
| 2705 Horton Dr Anderson, IN | 3.0 | 1.0 | 936 | $1,050 | $1.12 | 21d | 1 | 0.70mi |
| 921 W 9th St Anderson, IN | 3.0 | 2.0 | 1611 | $1,375 | $0.85 | 24d | 1 | 0.71mi |
| 1212 W 5th St Anderson, IN | 3.0 | 1.0 | 1252 | $1,295 | $1.03 | 13d | 1 | 0.79mi |
| 2613 Louise St Anderson, IN | 2.0 | 1.0 | 1096 | $950 | $0.87 | 22d | 1 | 0.82mi |
| 820 W 7th St Apt A Anderson, IN | 2.0 | 2.0 | 1400 | $1,200 | $0.86 | 24d | 1 | 0.86mi |
| 618 W 22nd St Anderson, IN | 3.0 | 1.0 | 900 | $1,250 | $1.39 | 44d | 1 | 0.86mi |
| 1529 W 2nd St Anderson, IN | 3.0 | 1.0 | 884 | $1,200 | $1.36 | 24d | 1 | 0.87mi |
| 2301 Sheridan St Anderson, IN | 2.0 | 1.0 | 900 | $950 | $1.06 | 44d | 1 | 0.88mi |
| 2719 Dewey St Anderson, IN | 2.0 | 1.0 | 877 | $1,150 | $1.31 | 44d | 1 | 0.91mi |
| 2233 Fairview St Anderson, IN | 3.0 | 1.5 | 1452 | $1,195 | $0.82 | 24d | 1 | 0.92mi |
| 2203 W 28th St Anderson, IN | 3.0 | 1.0 | 1068 | $1,000 | $0.94 | 44d | 1 | 0.96mi |
| 229 W 19th St Anderson, IN | 3.0 | 1.0 | 1200 | $1,000 | $0.83 | 44d | 1 | 1.02mi |
| 1010 W 2nd St Unit 3 Anderson, IN | 3.0 | 1.0 | 1025 | $1,125 | $1.10 | 15d | 1 | 1.02mi |
| 1010 W 2nd St Unit 2 Anderson, IN | 2.0 | 1.0 | 875 | $1,025 | $1.17 | 22d | 1 | 1.02mi |
| 2916 W 12th St Anderson, IN | 3.0 | 1.0 | 1271 | $1,295 | $1.02 | 44d | 1 | 1.04mi |
| 510 W 5th St Anderson, IN | 3.0 | 1.5 | 1617 | $995 | $0.62 | 44d | 1 | 1.07mi |
| 120 W 10th St Anderson, IN | 1.0–3.0 | 1.0 | 1066 | $1,150 | $1.08 | 2d | 1 | 1.15mi |
| 506 W 2nd St Anderson, IN | 3.0 | 1.0 | 964 | $1,095 | $1.14 | 24d | 1 | 1.23mi |
| 2627 Chase St Anderson, IN | 3.0 | 1.0 | 1050 | $850 | $0.81 | 18d | 1 | 1.25mi |
| 219 E 13th St Anderson, IN | 3.0 | 1.0 | 882 | $1,000 | $1.13 | 4d | 1 | 1.38mi |
| 2111 Central Ave Anderson, IN | 3.0 | 1.0 | 1026 | $1,250 | $1.22 | 44d | 1 | 1.38mi |
| 3021 Delaware St Anderson, IN | 2.0 | 1.0 | 1154 | $1,150 | $1.00 | 8d | 1 | 1.49mi |
Listing history 19 events
-
2026-06-18days on market $24,900 Active 76 DOM
-
2026-06-17days on market $24,900 Active 75 DOM
-
2026-06-16days on market $24,900 Active 74 DOM
-
2026-06-15days on market $24,900 Active 73 DOM
-
2026-06-13days on market $24,900 Active 71 DOM
-
2026-06-09days on market $24,900 Active 67 DOM
-
2026-06-08days on market $24,900 Active 66 DOM
-
2026-06-07days on market $24,900 Active 65 DOM
-
2026-06-05days on market $24,900 Active 62 DOM
-
2026-06-03days on market $24,900 Active 61 DOM
-
2026-06-02days on market $24,900 Active 60 DOM
-
2026-06-01days on market $24,900 Active 59 DOM
-
2026-05-31days on market $24,900 Active 58 DOM
-
2026-04-29price $24,900 191-char remark
Show marketing remark (191 chars)
Fixer upper 3 bedroom in up and coming area of Anderson, IN. This property has a newer roof, but the interior is a full rehab. Needs extensive work, but priced accordingly. Come see today!
-
2026-04-24price $29,900 191-char remark
Show marketing remark (191 chars)
Fixer upper 3 bedroom in up and coming area of Anderson, IN. This property has a newer roof, but the interior is a full rehab. Needs extensive work, but priced accordingly. Come see today!
-
2026-04-02$39,900 Active 191-char remark
Show marketing remark (191 chars)
Fixer upper 3 bedroom in up and coming area of Anderson, IN. This property has a newer roof, but the interior is a full rehab. Needs extensive work, but priced accordingly. Come see today!
-
2020-11-13soldstatus $11,000 Sold 140-char remark
Show marketing remark (140 chars)
Attention investors! Here is your Fall project! Needs full rehab and priced accordingly. Could be great addition to your rental portfolio.
-
2020-11-06status Pending 140-char remark
Show marketing remark (140 chars)
Attention investors! Here is your Fall project! Needs full rehab and priced accordingly. Could be great addition to your rental portfolio.
-
2020-09-25$14,500 Active 140-char remark
Show marketing remark (140 chars)
Attention investors! Here is your Fall project! Needs full rehab and priced accordingly. Could be great addition to your rental portfolio.
ⓘ Source: listings_history table (triggers on properties + properties_extension) + one-shot
backfill from property_details.listing_events for pre-trigger history.
Tax reassessment forecast IN · Partial reset (capped growth)
- Current annual tax
- $773 · $64/mo
- Projected year-2 tax
- $773 · $64/mo
- Expected delta
- $0/yr ($0/mo · 0.0%)
ⓘ Screening estimate from a state-policy table — verify with the county assessor before closing.
Climate risk First Street
- Flood 1/10 Low FEMA zone X (unshaded) · 0% chance over 30 yrs
- Wildfire 1/10 Low
- Heat 3/10 Moderate 7 d/yr ≥100°F today · 18 d/yr by 30 yrs out
- Wind 2/10 Low
- Air quality 3/10 Moderate 2 unhealthy d/yr today · 3 by 30 yrs out
Nearby sold comps map
Loading sold comps map…
Walkable amenities ~0.75 mi
Loading nearby amenities…
Taxation est. · year 1
- Rental income
- $13,044
- − Mortgage interest
- −$1,395
- − Property taxes
- −$773
- − Insurance
- −$124
- − Repairs & maintenance
- −$1,044
- − Management
- −$1,044
- − Depreciation
- −$724
- Taxable income
- $7,940
- Est. tax owed @ 24.0%
- −$1,906
- After-tax cash flow
- $5,934/yr
For passive investors: Depreciation is non-cash, so a rental often shows a tax loss while cash-flowing — sheltering income. Rental losses are passive: they offset passive income freely, and up to $25,000/yr can offset ordinary (W-2) income if you actively participate and your MAGI is under $100k (phasing out to $0 by $150k); unused losses carry forward. On sale, claimed depreciation is recaptured at up to 25%, and gains may owe capital-gains tax (a 1031 exchange can defer both). Figures are a year-1 estimate at your 24.0% rate — not tax advice; consult a CPA.
Schools (NCES district)
- District
- Anderson Community School Corporation
- NCES district ID
- 1800150
- Math proficiency
- 15% ▼ -14.00%
- Reading proficiency
- 23% ▼ -7.00%
- Median HH income
- $38,208
- Composite
- 15.93/100
- National rank
- #9250
- State rank
- #280 of 301 in IN
Livability — Anderson
- Score
- 60/100
- State rank
- #521
- US rank
- #18709
Category grades
Schools grade is shown separately in the Schools card above.
Census & demographics
- Census place
- Anderson, IN
- County
- Madison County · 69,445 people
- City population
- 57,762
- Metro
- Indianapolis-Carmel-Anderson, IN
- Population (ZIP)
- 17,834
- Household income
- $36,029
- Rent vs Own
- Severe rent burden
- 1193.0
Population outlook (Madison County) Hauer SSP2
- Today (2025)
- 125,800 people
- By 2030
- 122,640 · -2.5%
- By 2040
- 115,420 · -8.3%
- By 2050
- 108,148 · -14.0%
- By 2075
- 91,838 · -27.0%
- By 2100
- 75,670 · -39.8%
Race, ethnicity, and origin ACS 2023
- Neighborhood character
- Diverse neighborhood (Simpson 0.58)
- Race & ethnicity
- White 61% Black 18% Hispanic / Latino 13% Two or more races 11% Native American 1%
- Hispanic origin (detail)
- Mexican 10% Puerto Rican 1%
- Common ancestry
- Italian 2% Slovak 1% Iranian 1%
- Foreign-born
- 4% · Canada
- Languages at home
- 86% English-only · Spanish 12%
Political lean MEDSL · Madison
- 2024 margin
- Strong R (+26.9) · D 35.6% · R 62.5% · Other 1.9%
- 2008→2024 swing
- -33.5pp toward R · 2008: 6.5pp · 2024: -26.9pp
- All cycles
- 2024: R+26.9 2020: R+22.6 2016: R+25.7 2012: R+4.5 2008: D+6.5
Not yet ingested
- Civics
- —
Market trends
- HPI YoY
- ▼ -11.12%
- Current HPI
- 302.7437
- Rent YoY
- ▲ 7.88%
- Metro
- Indianapolis-Carmel-Anderson, IN
- State GDP YoY
- ▲ 2.90%
- F500 in state
- 18
Industry mix (Fortune 500 HQ in IN)
| Industry | F500 HQs | Revenue |
|---|---|---|
| Industrial Machinery | 2 | $37B |
|
||
| Healthcare | 1 | $177B |
|
||
| Pharmaceuticals | 1 | $45B |
|
||
| Metals / Steel | 1 | $18B |
|
||
| Agriculture | 1 | $17B |
|
||
| Packaging | 1 | $12B |
|
||
Price history
+71.7% since first listed6 events — show timeline
- 2026-04-29 Price Changed $24,900 MIBOR as Distributed by MLS Grid
- 2026-04-24 Price Changed $29,900 MIBOR as Distributed by MLS Grid
- 2026-04-02 Listed $39,900 MIBOR as Distributed by MLS Grid
- 2020-11-13 Sold (MLS) $11,000 MIBOR as Distributed by MLS Grid
- 2020-11-06 Pending — MIBOR as Distributed by MLS Grid
- 2020-09-25 Listed $14,500 MIBOR as Distributed by MLS Grid
Property tax history
+8.7%/yrLatest (2024): $773 · +9.4% YoY. Source: county tax records.
Cash-flow waterfall
monthlySold comps — $/sqft
last 12 mo · ≤1 miLoading sold comps…