 🏗️ New Construction
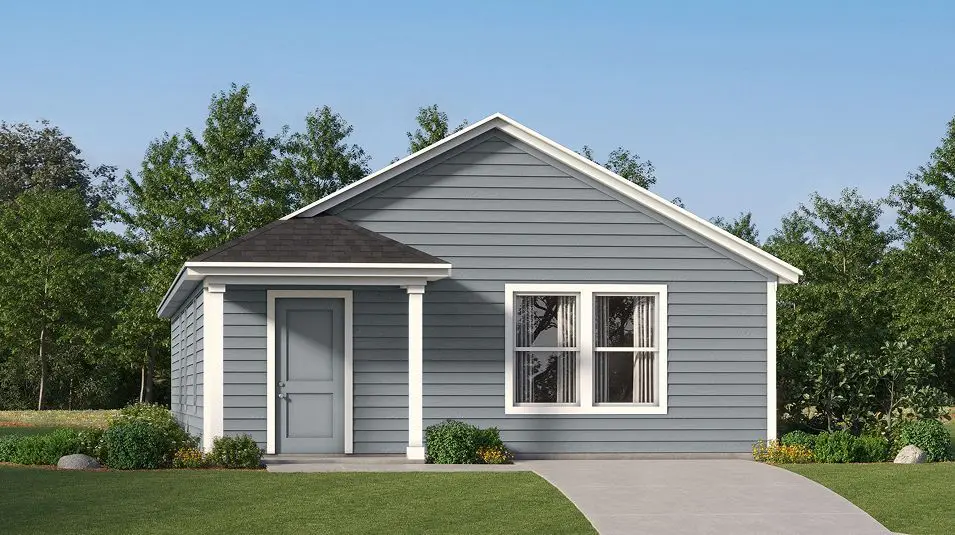
Avas Plan · Pleasanton, TX
Flood risk 1/10 · Minimal
- FEMA flood zone
- X (unshaded)
- Chance of flooding over 30 yrs
- 0.0%
- Est. flood insurance / yr
- $507 – $1,088
Fire risk 6/10 · Moderate
- Est. fire insurance / yr
- $1,222 – $2,270
Heat risk 8/10 · Major
- Hot days now (above 111°F)
- 7 days/yr
- Hot days in 30 yrs
- 22 days/yr
Wind risk 8/10 · Major
- Chance of severe wind over 30 yrs
- 80.0%
Air-quality risk 1/10 · Minimal
- Unhealthy air days now
- 0 days/yr
- Unhealthy air days in 30 yrs
- 0 days/yr
Risk factors via First Street. Map © Google.
Why this score? — see what drove the F grade
The composite is a weighted blend of 9 inputs, each scored 0–100. Each bar is that input's sub-score; the figure is the points it added to the 100-point composite (weight × sub-score).
- ARV discount +7.5/15.0
- Cash flow +7.1/30.0
- Condition / age +4.8/5.0
- Schools +3.2/10.0
- Livability +3.2/5.0
- Rent growth +2.5/5.0
- 1% rule +2.0/10.0
- DSCR +1.3/10.0
- Appreciation +0.0/10.0
$162,999
🖨 Deal sheet 📄 Offer letter ✓ Due diligence
Listing remarks MLS
This single-level home showcases a spacious open floorplan shared between the kitchen, dining area and family room for easy entertaining. An owner's suite enjoys a private location in a rear corner of the home, complemented by an en-suite bathroom and walk-in closet. There are two secondary bedrooms at the front of the home, which are comfortable spaces for household members and overnight guests.
Key facts
- Walk-in closet
- Open floorplan
- Secondary bedrooms
Tags
Neighborhood map
What this means for you Summary
Snapshot
- This is a 3-bed/2.0-bath single-family listed at $163k. Condition is rated excellent.
Deal economics
- At list price, monthly cash flow is $-314 ($-4k/yr) — negative.
- The deal already cash-flows at list — no discount required.
- To meet the 1% rule (rent ≥ 1% of price), the offer needs to be $155k (4.9% below list).
- Recommended offer: $143k (12.0% below list) — sets the bar for market timing.
- Cap rate 4.6% vs local median 3.3% in Pleasanton — top-decile yield for the area; either an underpriced asset or a hidden risk that comps aren't pricing in. Stress-test before assuming the spread holds.
Location & tenants
- Location reads 65/100 on livability (#679 in TX) — a middle-class / working-renter tenant base. Strengths: cost of living A+, housing A+, employment B; Watch: schools C-, amenities F, commute F.
- Pleasanton ISD (town): math 36% / reading 37% proficiency, ranked #470 of 826 in TX (top 57%) — families likely to look elsewhere, expect single-tenant / working-renter base with shorter leases.
- Market conditions: 233 active listings in the ZIP; 10 comparable units currently listed for rent nearby; rentals at typical pace (median 24d on market — plan ~3-4 weeks tenant-placement turnaround); 40% of comp listings sitting > 30 days — soft ceiling on asking rent; 224 units permitted in Atascosa County in 2024 (0 in 5+ unit buildings).
Forward outlook
- Local home prices are declining (-3.0%/yr); year-one equity from $2k of loan paydown is wiped out by about $7k of value loss. Plan a longer hold.
- Atascosa County population projected at +41% by 2050 — long-run rental-demand tailwind backs the buy-and-hold thesis.
Negotiation context
- It's been on market 496 days — a 12% lower offer ($143k) is reasonable based on typical stale-listing flexibility.
Risks & watch-outs
- Climate carrying-cost: severe wind risk, 80% chance of damaging wind over 30y; major wildfire risk; extreme-heat days projected 7→22/yr by 2055 (HVAC capex compounding) — expect insurance premiums to compound above CPI over the hold.
Questions for the listing agent
- What do current leases actually rent for vs. the listed asking? Can we see a recent rent roll and the last 12 months of T-12 income?
- It's been on market 496 days. Have you received any prior offers? Is the seller open to a 12% concession, seller financing, or rate buy-down credit?
- Why hasn't it sold? Are there any deal-killer items the seller is aware of (foundation, flood, title, zoning, code violations)?
- Is there a deadline driving the sale (1031 exchange, divorce, estate, relocation)? That informs how much negotiation room exists.
- The area grade is low — what's the realistic commute time and amenity access for the typical tenant pool here? Any planned neighborhood developments (good or bad) we should know about?
- What's the average days-on-market for RENTAL listings here right now (not sales)? A rising rental-DOM trend means longer vacancies and softer asking-rent achievability than the comps imply.
- What's the recent tenant-quality profile in this submarket — average credit score on applications, eviction rate, late-payment / NSF rate, and stable-employment percentage? A property-management company in the area should have these aggregated.
- How much new for-sale + rental construction is in the pipeline within 1–3 miles? Heavy new supply typically softens prices + rents 12–24 months out; constrained supply supports both.
Investment metrics
- 1% rule
- 0.70% ✗
- Cap rate
- 4.60%
- Cash-on-cash
- -6.05%
- DSCR
- 0.73
- GRM
- 12.0
CMA / ARV
- ARV (median comp)
- $222,635
- List price
- $162,999
- Delta
- -26.79%
- Verdict
- UNDERPRICED
- Comps
- 20 within 1.0 mi
Show comp detail 12 sales within ~0.75 mi
| Address | Dist | Beds/Ba | Sqft | Sold | Price | $/sf | Match |
|---|---|---|---|---|---|---|---|
| 105 Bronco Rdg | 0.23mi | 3/2.0 | 1,411 (+2%) | 1mo | $182,999 | $130 | 85 |
| 124 Horseshoe Trl | 0.14mi | 3/2.0 | 1,450 (+5%) | 1mo | $135,000 | $93 | 84 |
| 185 Bronco Rdg | 0.38mi | 3/2.0 | 1,380 (0%) | 3mo | $144,999 | $105 | 80 |
| 168 Bronco Rdg | 0.36mi | 3/2.0 | 1,402 (+2%) | 2mo | $181,999 | $130 | 79 |
| 157 Bronco Rdg | 0.33mi | 3/2.0 | 1,402 (+2%) | 4mo | $179,999 | $128 | 79 |
| 189 Bronco Rdg | 0.39mi | 3/2.0 | 1,402 (+2%) | 2mo | $177,999 | $127 | 77 |
| 197 Bronco Rdg | 0.42mi | 3/2.0 | 1,402 (+2%) | 3mo | $186,999 | $133 | 75 |
| 117 Bronco Rdg | 0.25mi | 3/2.0 | 1,266 (-8%) | 1mo | $169,999 | $134 | 74 |
| 180 Bronco Rdg | 0.39mi | 3/2.0 | 1,266 (-8%) | 3mo | $179,999 | $142 | 66 |
| 176 Bronco Rdg | 0.38mi | 4/2.0 (+1) | 1,500 (+9%) | 1mo | $155,999 | $104 | 62 |
| 101 Bronco Rdg | 0.21mi | 4/2.0 (+1) | 1,575 (+14%) | 1mo | $183,999 | $117 | 61 |
| 224 Bunker Hl | 0.65mi | 3/2.0 | 1,470 (+6%) | 1mo | $299,000 | $203 | 58 |
Match score weights: distance 35% · size 25% · config 20% · recency 20%. Top-matched comps best support the ARV.
Projected returns pro-forma
-3.0% appreciation · 3.0% rent growth · sell at horizon
- IRR
- -26.7%
- Equity multiple
- 0.10×
- Total profit
- $-56,059
- Equity at exit
- $33,196
- IRR
- -24.0%
- Equity multiple
- -0.19×
- Total profit
- $-74,480
- Equity at exit
- $19,249
Cash invested: $62,338 (down + closing). Projections, not guarantees.
Landlord ↔ Tenant lean methodology
- Overall (STATE)
- 87 Strongly Landlord-Friendly
- State Texas
- 87 Strongly Landlord-Friendly · R+5
- County
- — inherits STATE
- City
- — inherits STATE
ZIP-level market 78064
- Home prices YoY
- -32.7%
- Active inventory
- 233
- Price-to-rent
- 8.8×
Monthly cashflow live
- Estimated rent
- $1,550 high interval (Pro) →
- Mortgage (P&I)
- −$1,168
- Tax est. 1.5%
- −$278 /mo · $3,340/yr
- Insurance
- −$93
- HOA
- −$0
- Vacancy / Maint / Mgmt
- −$325
- Net cashflow
- $-314
Break-even live
UW: 25.0% down · 7.5% · 30yr · 1.5% tax · 5.0% vac · 8.0% maint · 8.0% mgmt
Financing live
Cash to close
- Down payment
- $55,659
- Closing costs
- $6,679
- Reserves months
- —
- Total cash needed
- —
Loan-product check · same deal, 3 products live
Conventional
25% down · 7.5% · 30yr
- Down + closing
- —
- Monthly P&I
- —
- Monthly cashflow
- —
- DSCR
- —
- Eligible?
- —
Personal DTI + credit; lowest rate.
DSCR
20% down · 8.5% · 30yr
- Down + closing
- —
- Monthly P&I
- —
- Monthly cashflow
- —
- DSCR
- —
- Eligible?
- —
No personal income docs; deal must DSCR.
Hard money
10% down · 12.0% · 12mo
- Down + closing
- —
- Monthly P&I
- —
- Monthly cashflow
- —
- DSCR
- —
- Eligible?
- —
Short-term bridge; refi at stabilization.
Rent comps 10 comps
| Address | Beds | Baths | Sqft | Rent | $/sqft | DOM | Units | Dist |
|---|---|---|---|---|---|---|---|---|
| 140 Maverick Cv Pleasanton, TX | 3.0 | 2.0 | 1450 | $1,800 | $1.24 | 14d | 1 | 0.20mi |
| 268 Cowboy Rdg Pleasanton, TX | 3.0 | 2.0 | 1200 | $1,525 | $1.27 | 12d | 1 | 0.38mi |
| 701 Oakhaven Rd Unit 901 Pleasanton, TX | 2.0 | 1.0 | 875 | $950 | $1.09 | 43d | 1 | 0.70mi |
| 701 Oakhaven Rd Apt 504 Pleasanton, TX | 3.0 | 1.0 | 1075 | $1,100 | $1.02 | 43d | 1 | 0.70mi |
| 211 Circle Ct Pleasanton, TX | 3.0 | 2.0 | 1678 | $1,700 | $1.01 | 4d | 1 | 0.86mi |
| 211 Circle Ct Unit 211 Pleasanton, TX | 3.0 | 2.0 | 1679 | $1,700 | $1.01 | 11d | 1 | 0.87mi |
| 223 Circle Ct #223 Pleasanton, TX | 2.0 | 1.5 | 1544 | $1,600 | $1.04 | 23d | 1 | 0.87mi |
| 1324 W Goodwin St Pleasanton, TX | 2.0 | 1.0 | 960 | $1,100 | $1.15 | 43d | 1 | 0.92mi |
| 404 High Meadow Dr Pleasanton, TX | 3.0 | 2.0 | 1428 | $1,800 | $1.26 | 17d | 1 | 1.04mi |
| 1209 W Goodwin St Pleasanton, TX | 2.0 | 1.0 | 910 | $1,000 | $1.10 | 43d | 1 | 1.06mi |
Listing history 16 events
-
2026-06-18days on market $162,999 Active 496 DOM
-
2026-06-17days on market $162,999 Active 495 DOM
-
2026-06-16days on market $162,999 Active 494 DOM
-
2026-06-15days on market $162,999 Active 493 DOM
-
2026-06-13days on market $162,999 Active 491 DOM
-
2026-06-09days on market $162,999 Active 487 DOM
-
2026-06-08days on market $162,999 Active 486 DOM
-
2026-06-07days on market $162,999 Active 485 DOM
-
2026-06-04days on market $162,999 Active 482 DOM
-
2026-06-03days on market $162,999 Active 481 DOM
-
2026-06-02days on market $162,999 Active 480 DOM
-
2026-06-01days on market $162,999 Active 479 DOM
-
2026-05-31days on market $162,999 Active 478 DOM
-
2026-05-01price $162,999 399-char remark
Show marketing remark (399 chars)
This single-level home showcases a spacious open floorplan shared between the kitchen, dining area and family room for easy entertaining. An owner's suite enjoys a private location in a rear corner of the home, complemented by an en-suite bathroom and walk-in closet. There are two secondary bedrooms at the front of the home, which are comfortable spaces for household members and overnight guests.
-
2026-04-17price $179,999 399-char remark
Show marketing remark (399 chars)
This single-level home showcases a spacious open floorplan shared between the kitchen, dining area and family room for easy entertaining. An owner's suite enjoys a private location in a rear corner of the home, complemented by an en-suite bathroom and walk-in closet. There are two secondary bedrooms at the front of the home, which are comfortable spaces for household members and overnight guests.
-
2025-02-08$185,999 Active 399-char remark
Show marketing remark (399 chars)
This single-level home showcases a spacious open floorplan shared between the kitchen, dining area and family room for easy entertaining. An owner's suite enjoys a private location in a rear corner of the home, complemented by an en-suite bathroom and walk-in closet. There are two secondary bedrooms at the front of the home, which are comfortable spaces for household members and overnight guests.
ⓘ Source: listings_history table (triggers on properties + properties_extension) + one-shot
backfill from property_details.listing_events for pre-trigger history.
Climate risk First Street
- Flood 1/10 Low FEMA zone X (unshaded) · 0% chance over 30 yrs
- Wildfire 6/10 Major
- Heat 8/10 Severe 7 d/yr ≥111°F today · 22 d/yr by 30 yrs out
- Wind 8/10 Severe 80% chance of damaging wind over 30 yrs
- Air quality 1/10 Low 0 unhealthy d/yr today · 0 by 30 yrs out
Nearby sold comps map
Loading sold comps map…
Walkable amenities ~0.75 mi
Loading nearby amenities…
Taxation est. · year 1
- Rental income
- $18,600
- − Mortgage interest
- −$12,471
- − Property taxes
- −$3,340
- − Insurance
- −$1,113
- − Repairs & maintenance
- −$1,488
- − Management
- −$1,488
- − Depreciation
- −$6,477
- Taxable loss
- −$7,777
- Est. tax savings @ 24.0%
- +$1,866
- After-tax cash flow
- $-1,903/yr
For passive investors: Depreciation is non-cash, so a rental often shows a tax loss while cash-flowing — sheltering income. Rental losses are passive: they offset passive income freely, and up to $25,000/yr can offset ordinary (W-2) income if you actively participate and your MAGI is under $100k (phasing out to $0 by $150k); unused losses carry forward. On sale, claimed depreciation is recaptured at up to 25%, and gains may owe capital-gains tax (a 1031 exchange can defer both). Figures are a year-1 estimate at your 24.0% rate — not tax advice; consult a CPA.
Condition & rehab AI · 12 photos
This single-family home is in excellent condition with a modern and well-maintained interior and exterior. It is move-in ready and would benefit from minor aesthetic updates to further enhance its value.
Value-add opportunities
- Both Painting exterior and interior walls — Enhances curb appeal and interior aesthetics
- Both Landscaping improvements — Enhances curb appeal and adds value
- Resale New flooring in bathrooms — Improves functionality and appearance
- Resale New kitchen appliances — Modernizes the space and adds value
Renovation cost estimate screening
Value-add ROI direction
- Both Painting exterior and interior walls — Enhances curb appeal and interior aesthetics ↑
- Both Landscaping improvements — Enhances curb appeal and adds value ↑
- Resale New flooring in bathrooms — Improves functionality and appearance ↑
- Resale New kitchen appliances — Modernizes the space and adds value ↑
ⓘ Cost ranges are severity-bucket heuristics (US national rule-of-thumb). Get contractor quotes + a written scope before underwriting a rehab budget.
Schools (NCES district)
- District
- Pleasanton ISD
- NCES district ID
- 4835190
- Math proficiency
- 36% ▼ -2.00%
- Reading proficiency
- 37% ▲ 4.00%
- Median HH income
- $53,885
- Composite
- 31.97/100
- National rank
- #5843
- State rank
- #470 of 826 in TX
Livability — Pleasanton
- Score
- 65/100
- State rank
- #679
- US rank
- #12731
Category grades
Schools grade is shown separately in the Schools card above.
Census & demographics
- Population (ZIP)
- 16,420
Population outlook (Atascosa County) Hauer SSP2
- Today (2025)
- 57,233 people
- By 2030
- 61,729 · +7.9%
- By 2040
- 71,122 · +24.3%
- By 2050
- 80,906 · +41.4%
- By 2075
- 106,134 · +85.4%
- By 2100
- 122,415 · +113.9%
Race, ethnicity, and origin ACS 2023
- Neighborhood character
- Majority Hispanic (55%)
- Race & ethnicity
- Hispanic / Latino 55% White 41% Two or more races 27% Black 2%
- Hispanic origin (detail)
- Mexican 49%
- Common ancestry
- Romanian 2% Lithuanian 2% Portuguese 1%
- Foreign-born
- 7% · Canada
- Languages at home
- 67% English-only · Spanish 32% Other Indo-European 1% German/W. Germanic 1%
Political lean MEDSL · Atascosa
- 2024 margin
- Solid R (+43.3) · D 27.9% · R 71.3%
- 2008→2024 swing
- -32.8pp toward R · 2008: -10.5pp · 2024: -43.3pp
- All cycles
- 2024: R+43.3 2020: R+34.0 2016: R+29.1 2012: R+18.3 2008: R+10.5
Not yet ingested
- Civics
- —
Market trends
- HPI YoY
- ▼ -91.53%
- Current HPI
- 188.725
- Rent YoY
- —
- Metro
- —
- State GDP YoY
- ▲ 3.95%
- F500 in state
- 110
Industry mix (Fortune 500 HQ in TX)
| Industry | F500 HQs | Revenue |
|---|---|---|
| Energy | 16 | $1,198B |
|
||
| Technology | 5 | $198B |
|
||
| Engineering / Construction | 4 | $72B |
|
||
| Energy Services | 3 | $60B |
|
||
| Utilities | 3 | $41B |
|
||
| Healthcare | 2 | $330B |
|
||
Price history
-12.4% since first listed3 events — show timeline
- 2026-05-01 Price Changed $162,999 Zillow
- 2026-04-17 Price Changed $179,999 Zillow
- 2025-02-08 Listed $185,999 Zillow
Cash-flow waterfall
monthlySold comps — $/sqft
last 12 mo · ≤1 miLoading sold comps…