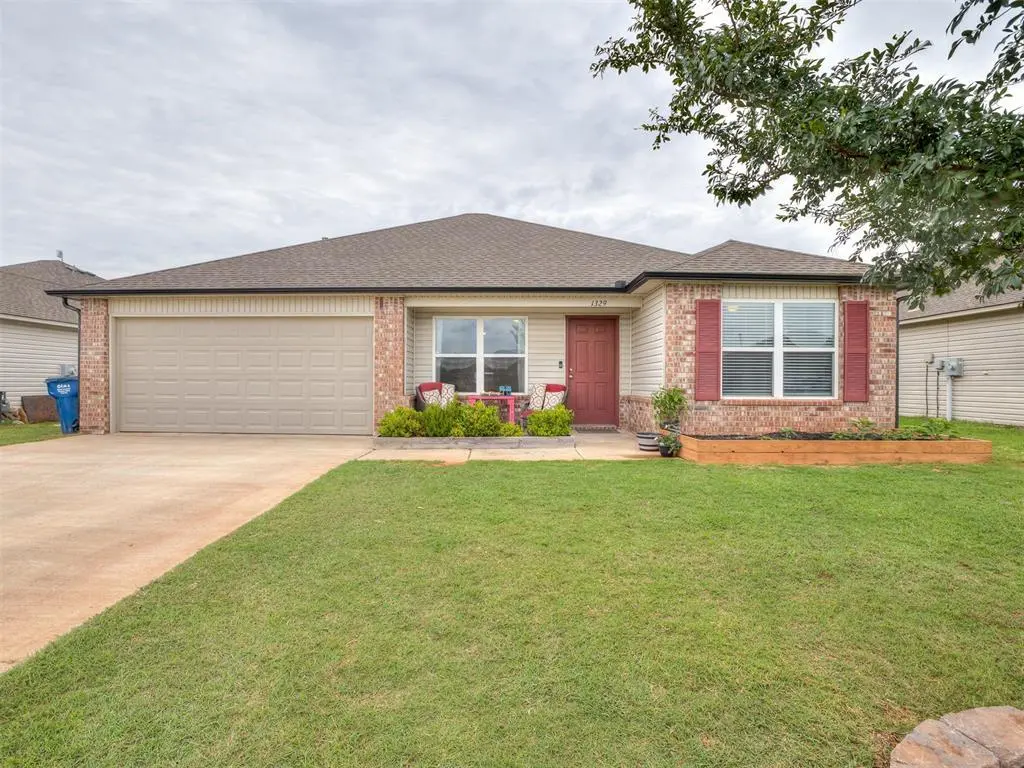
1329 S Rae Dr · Mustang, OK
Flood risk No data
- FEMA flood zone
- —
- Chance of flooding over 30 yrs
- —
- Est. flood insurance / yr
- —
Fire risk No data
- Est. fire insurance / yr
- —
Heat risk No data
- Hot days now (above threshold)
- —
- Hot days in 30 yrs
- —
Wind risk No data
- Chance of severe wind over 30 yrs
- —
Air-quality risk No data
- Unhealthy air days now
- —
- Unhealthy air days in 30 yrs
- —
Risk factors via First Street. Map © Google.
Why this score? — see what drove the D- grade
The composite is a weighted blend of 9 inputs, each scored 0–100. Each bar is that input's sub-score; the figure is the points it added to the 100-point composite (weight × sub-score).
- Cash flow +12.8/30.0
- ARV discount +7.3/15.0
- DSCR +3.8/10.0
- Condition / age +3.8/5.0
- Livability +3.5/5.0
- 1% rule +3.2/10.0
- Schools +3.1/10.0
- Rent growth +2.4/5.0
- Appreciation +0.0/10.0
$225,000
🖨 Deal sheet 📄 Offer letter ✓ Due diligence
Listing remarks MLS
The CARNEGIE floor plan offers a ton of usable space. Every single square inch is utilized making this home feel much bigger and more spacious. This home includes an open concept from the kitchen to the living room. The master bedroom in this home is large enough to accommodate any furniture while leaving room for more and that's on top of having a large walk-in closet with a very comfortable bathroom. Three additional bedrooms that are evenly sized. Home is currently under construction with anticipated completion in October.
Key facts
- 7,218 sq ft lot
- 2 garage spots
- Built 2021
Property features AI
Finance
- Other: Located in Mustang Farms Ph 1
- Financial info: Loan qualification possible
- HOA & community: Mandatory association dues; Association fee $200 (includes greenbelt and common area maintenance)
Exterior
- Parking: 2-car garage
- Home design: Single family residence; One story; Residential property; Existing property; Homestead eligible
- Construction: Brick and frame construction; Shingle roof; Slab foundation; Built with traditional construction materials
- Exterior features: Porch; Interior lot
Interior
- Bedrooms: 4 bedrooms
- Bathrooms: 2 full bathrooms
- Interior features: No fireplace; No in-law plan; One living area
Neighborhood map
What this means for you Summary
Snapshot
- This is a 4-bed/2.0-bath single-family listed at $225k. Condition is rated good.
Deal economics
- At list price, monthly cash flow is $-21 ($-252/yr) — negative.
- To cash-flow at today's rent, offer at most $221k (1.6% below list).
- To meet the 1% rule (rent ≥ 1% of price), the offer needs to be $184k (18.1% below list).
- Recommended offer: $184k (18.1% below list) — sets the bar for 1% rule.
- Cap rate 6.2% vs local median 4.5% in Mustang — top-decile yield for the area; either an underpriced asset or a hidden risk that comps aren't pricing in. Stress-test before assuming the spread holds.
Location & tenants
- Location reads 69/100 on livability (#52 in OK) — a middle-class / working-renter tenant base. Strengths: crime A+, cost of living A+, housing A+; Watch: amenities F, commute F, health & safety F.
- Mustang (suburban): math 35% / reading 33% proficiency, ranked #28 of 270 in OK (top 10%) — families likely to look elsewhere, expect single-tenant / working-renter base with shorter leases.
- Zoned schools: Mustang Centennial Es (math 46% / reading 42%, grade F, #73 of 845 statewide, top 9%, 643 students, 0% FRL); Mustang Hs (math 28% / reading 39%, grade F, #65 of 447 statewide, top 14%, 3,756 students, 0% FRL) — zoned schools average 0% FRL vs 28% district-wide (28 pts lower); this property's tenant base skews higher-income than the district average.
- Market conditions: Rents soft (-0.3%/yr); 512 active listings in the ZIP; 8 comparable units currently listed for rent nearby; rentals at typical pace (median 21d on market — plan ~3-4 weeks tenant-placement turnaround); solid renter incomes; 260 units permitted in Canadian County in 2024 (0 in 5+ unit buildings).
Forward outlook
- Local home prices are declining (-3.0%/yr); year-one equity from $2k of loan paydown is wiped out by about $7k of value loss. Plan a longer hold.
- Canadian County population projected at +64% by 2050 — long-run rental-demand tailwind backs the buy-and-hold thesis.
Negotiation context
- Only 1 days on market — expect competitive offers; lowballing is unlikely to land.
- 2 sale attempts since 5y ago with the ask held roughly flat each time — persistent listings suggest the price (not the market) is what's stuck; bring a comps-based counter.
Questions for the listing agent
- What do current leases actually rent for vs. the listed asking? Can we see a recent rent roll and the last 12 months of T-12 income?
- What does the HOA fee cover, when was the last increase, and are there any pending special assessments or reserve-fund shortfalls?
- Is there a deadline driving the sale (1031 exchange, divorce, estate, relocation)? That informs how much negotiation room exists.
- The area grade is low — what's the realistic commute time and amenity access for the typical tenant pool here? Any planned neighborhood developments (good or bad) we should know about?
- What's the average days-on-market for RENTAL listings here right now (not sales)? A rising rental-DOM trend means longer vacancies and softer asking-rent achievability than the comps imply.
- What's the recent tenant-quality profile in this submarket — average credit score on applications, eviction rate, late-payment / NSF rate, and stable-employment percentage? A property-management company in the area should have these aggregated.
- How much new for-sale + rental construction is in the pipeline within 1–3 miles? Heavy new supply typically softens prices + rents 12–24 months out; constrained supply supports both.
Investment metrics
- 1% rule
- 0.82% ✗
- Cap rate
- 6.18%
- Cash-on-cash
- -0.40%
- DSCR
- 0.98
- GRM
- 10.2
CMA / ARV
- ARV (on-the-fly)
- $224,235
- Comps found
- 12
Show comp detail 12 sales within ~0.75 mi
| Address | Dist | Beds/Ba | Sqft | Sold | Price | $/sf | Match |
|---|---|---|---|---|---|---|---|
| 1315 S Grace Dr | 0.07mi | 3/2.0 (-1) | 1,617 (+9%) | 7mo | $225,000 | $139 | 72 |
| 629 W Dowden Dr | 0.31mi | 3/2.0 (-1) | 1,460 (-2%) | 9mo | $230,000 | $158 | 70 |
| 1302 S Silver Dr | 0.16mi | 3/2.0 (-1) | 1,355 (-9%) | 8mo | $205,000 | $151 | 67 |
| 722 W Carson Dr | 0.13mi | 3/2.0 (-1) | 1,575 (+6%) | 17mo | $235,000 | $149 | 65 |
| 640 W Perry Dr | 0.33mi | 4/2.0 | 1,523 (+3%) | 19mo | $208,000 | $137 | 64 |
| 707 W Ava Dr | 0.15mi | 3/2.0 (-1) | 1,354 (-9%) | 17mo | $220,000 | $162 | 59 |
| 825 S Lariat Dr | 0.66mi | 3/1.5 (-1) | 1,427 (-4%) | 5mo | $336,000 | $235 | 52 |
| 915 S Lariat Dr | 0.64mi | 3/1.5 (-1) | 1,516 (+2%) | 10mo | $320,000 | $211 | 51 |
| 413 W Linden Dr | 0.64mi | 4/1.0 | 1,335 (-10%) | 5mo | $187,000 | $140 | 45 |
| 1220 S Highland Dr | 0.38mi | 3/2.0 (-1) | 1,360 (-8%) | 22mo | $223,900 | $165 | 45 |
| 417 S Woodland Dr | 0.73mi | 3/1.5 (-1) | 1,567 (+6%) | 16mo | $159,000 | $101 | 36 |
| 423 S Woodland Dr | 0.72mi | 3/2.0 (-1) | 1,626 (+10%) | 16mo | $195,500 | $120 | 32 |
Match score weights: distance 35% · size 25% · config 20% · recency 20%. Top-matched comps best support the ARV.
Projected returns pro-forma
-3.0% appreciation · 0.0% rent growth · sell at horizon
- IRR
- -20.2%
- Equity multiple
- 0.31×
- Total profit
- $-43,218
- Equity at exit
- $33,548
- IRR
- -21.2%
- Equity multiple
- 0.04×
- Total profit
- $-60,309
- Equity at exit
- $19,454
Cash invested: $63,000 (down + closing). Projections, not guarantees.
Landlord ↔ Tenant lean methodology
- Overall (STATE)
- 83 Strongly Landlord-Friendly
- State Oklahoma
- 83 Strongly Landlord-Friendly · R+20
- County
- — inherits STATE
- City
- — inherits STATE
ZIP-level market 73064
- Home prices YoY
- -17.9%
- Rents YoY
- -0.3%
- Active inventory
- 512
- Price-to-rent
- 10.2×
Monthly cashflow live
- Estimated rent
- $1,843 high interval (Pro) →
- Mortgage (P&I)
- −$1,180
- Tax from tax record
- −$186 /mo · $2,234/yr
- Insurance
- −$94
- HOA
- −$17
- Vacancy / Maint / Mgmt
- −$387
- Net cashflow
- $-21
Break-even live
UW: 25.0% down · 7.5% · 30yr · 1.5% tax · 5.0% vac · 8.0% maint · 8.0% mgmt
Financing live
Cash to close
- Down payment
- $56,250
- Closing costs
- $6,750
- Reserves months
- —
- Total cash needed
- —
Loan-product check · same deal, 3 products live
Conventional
25% down · 7.5% · 30yr
- Down + closing
- —
- Monthly P&I
- —
- Monthly cashflow
- —
- DSCR
- —
- Eligible?
- —
Personal DTI + credit; lowest rate.
DSCR
20% down · 8.5% · 30yr
- Down + closing
- —
- Monthly P&I
- —
- Monthly cashflow
- —
- DSCR
- —
- Eligible?
- —
No personal income docs; deal must DSCR.
Hard money
10% down · 12.0% · 12mo
- Down + closing
- —
- Monthly P&I
- —
- Monthly cashflow
- —
- DSCR
- —
- Eligible?
- —
Short-term bridge; refi at stabilization.
Rent comps 8 comps
| Address | Beds | Baths | Sqft | Rent | $/sqft | DOM | Units | Dist |
|---|---|---|---|---|---|---|---|---|
| 733 W Perry Dr Mustang, OK | 3.0 | 1.5 | 999 | $1,345 | $1.35 | 1d | 1 | 0.31mi |
| 742 W Juniper Dr Mustang, OK | 3.0 | 1.5 | 1100 | $1,475 | $1.34 | 1d | 1 | 0.44mi |
| 936 W Tesio Way Mustang, OK | 3.0 | 1.5 | 1255 | $1,425 | $1.14 | 23d | 1 | 0.97mi |
| 548 W Shadow Ridge Way Mustang, OK | 4.0 | 2.0 | 1734 | $1,945 | $1.12 | 19d | 1 | 0.99mi |
| 313 N Shannon Way Mustang, OK | 3.0 | 2.0 | 1706 | $1,750 | $1.03 | 15d | 1 | 1.23mi |
| 1136 W Johnathan Way Mustang, OK | 3.0 | 2.0 | 1415 | $1,450 | $1.02 | 23d | 1 | 1.26mi |
| 605 N Ponderosa Way Mustang, OK | 3.0 | 2.0 | 1686 | $2,000 | $1.19 | 23d | 1 | 1.26mi |
| 1013 W Gladys Way Mustang, OK | 3.0 | 2.0 | 1116 | $1,450 | $1.30 | 21d | 1 | 1.40mi |
HOA detail
- Monthly dues
- $17 · $204/yr
Listing history 2 events
-
2026-06-05remarks 699-char remark
-
2026-06-05$225,000 Pending 1 DOM
ⓘ Source: listings_history table (triggers on properties + properties_extension) + one-shot
backfill from property_details.listing_events for pre-trigger history.
Tax reassessment forecast OK · Resets to sale price
- Current annual tax
- $2,234 · $186/mo
- Projected year-2 tax
- $2,234 · $186/mo
- Expected delta
- $0/yr ($0/mo · 0.0%)
ⓘ Screening estimate from a state-policy table — verify with the county assessor before closing.
Nearby sold comps map
Loading sold comps map…
Walkable amenities ~0.75 mi
Loading nearby amenities…
Taxation est. · year 1
- Rental income
- $22,114
- − Mortgage interest
- −$12,603
- − Property taxes
- −$2,234
- − Insurance
- −$1,125
- − Repairs & maintenance
- −$1,769
- − Management
- −$1,769
- − HOA
- −$204
- − Depreciation
- −$6,545
- Taxable loss
- −$4,136
- Est. tax savings @ 24.0%
- +$993
- After-tax cash flow
- $741/yr
For passive investors: Depreciation is non-cash, so a rental often shows a tax loss while cash-flowing — sheltering income. Rental losses are passive: they offset passive income freely, and up to $25,000/yr can offset ordinary (W-2) income if you actively participate and your MAGI is under $100k (phasing out to $0 by $150k); unused losses carry forward. On sale, claimed depreciation is recaptured at up to 25%, and gains may owe capital-gains tax (a 1031 exchange can defer both). Figures are a year-1 estimate at your 24.0% rate — not tax advice; consult a CPA.
Condition & rehab AI · 12 photos
This 4-bedroom, 2-bath home in Mustang is in good condition with a good layout and modern finishes. It's ready for a new owner to move in and enjoy.
Value-add opportunities
- Both paint interior walls — neutral paint can be refreshed to enhance curb appeal
- Both replace carpet with hardwood in living areas — hardwood floors are more durable and aesthetically pleasing
- Both install smart home devices — improves convenience and energy efficiency
Renovation cost estimate screening
Value-add ROI direction
- Both paint interior walls — neutral paint can be refreshed to enhance curb appeal ↑
- Both replace carpet with hardwood in living areas — hardwood floors are more durable and aesthetically pleasing ↑
- Both install smart home devices — improves convenience and energy efficiency ↑
ⓘ Cost ranges are severity-bucket heuristics (US national rule-of-thumb). Get contractor quotes + a written scope before underwriting a rehab budget.
Schools (NCES district)
- District
- Mustang
- NCES district ID
- 4021000
- Math proficiency
- 35% ▼ -10.00%
- Reading proficiency
- 33% ▼ -7.00%
- Median HH income
- $67,559
- Composite
- 31.21/100
- National rank
- #6038
- State rank
- #28 of 270 in OK
Livability — Mustang
- Score
- 69/100
- State rank
- #52
- US rank
- #8746
Category grades
Schools grade is shown separately in the Schools card above.
Census & demographics
- Census place
- Mustang, OK
- County
- Canadian County · 154,341 people
- City population
- 28,919
- Metro
- Oklahoma City, OK
- Population (ZIP)
- 28,919
- Household income
- $94,402
- Rent vs Own
- Severe rent burden
- 384.0
Population outlook (Canadian County) Hauer SSP2
- Today (2025)
- 174,062 people
- By 2030
- 195,170 · +12.1%
- By 2040
- 239,293 · +37.5%
- By 2050
- 285,457 · +64.0%
- By 2075
- 403,766 · +132.0%
- By 2100
- 498,766 · +186.5%
Race, ethnicity, and origin ACS 2023
- Neighborhood character
- Predominantly White (74%)
- Race & ethnicity
- White 74% Two or more races 11% Hispanic / Latino 10% Native American 3% Black 3% Asian 2%
- Hispanic origin (detail)
- Mexican 8%
- Common ancestry
- Italian 2% Scottish 2% Slovak 2%
- Foreign-born
- 4% · Canada, Vietnam
- Languages at home
- 93% English-only · Spanish 5% Other Indo-European 1% Tagalog/Filipino 1%
Political lean MEDSL · Canadian
- 2024 margin
- Solid R (+40.4) · D 28.8% · R 69.2% · Other 2.0%
- 2008→2024 swing
- +11.9pp toward D · 2008: -52.2pp · 2024: -40.4pp
- All cycles
- 2024: R+40.4 2020: R+43.3 2016: R+51.2 2012: R+54.4 2008: R+52.2
Not yet ingested
- Civics
- —
Market trends
- HPI YoY
- ▼ -56.66%
- Current HPI
- 260.2863
- Rent YoY
- ▼ -0.33%
- Metro
- Oklahoma City, OK
- State GDP YoY
- ▲ 1.55%
- F500 in state
- 6
Industry mix (Fortune 500 HQ in OK)
| Industry | F500 HQs | Revenue |
|---|---|---|
| Energy | 3 | $48B |
|
||
Price history
+14.7% since first listed5 events — show timeline
- 2026-06-04 Pending — MLSOK
- 2026-06-04 Listed $225,000 MLSOK
- 2021-10-28 Sold (MLS) $196,240 MLSOK
- 2021-09-02 Pending — MLSOK
- 2021-08-10 Listed $196,240 MLSOK
Property tax history
+3.8%/yrLatest (2025): $2,234 · +4.2% YoY. Source: county tax records.
Cash-flow waterfall
monthlySold comps — $/sqft
last 12 mo · ≤1 miLoading sold comps…